







Williams% signals on chart
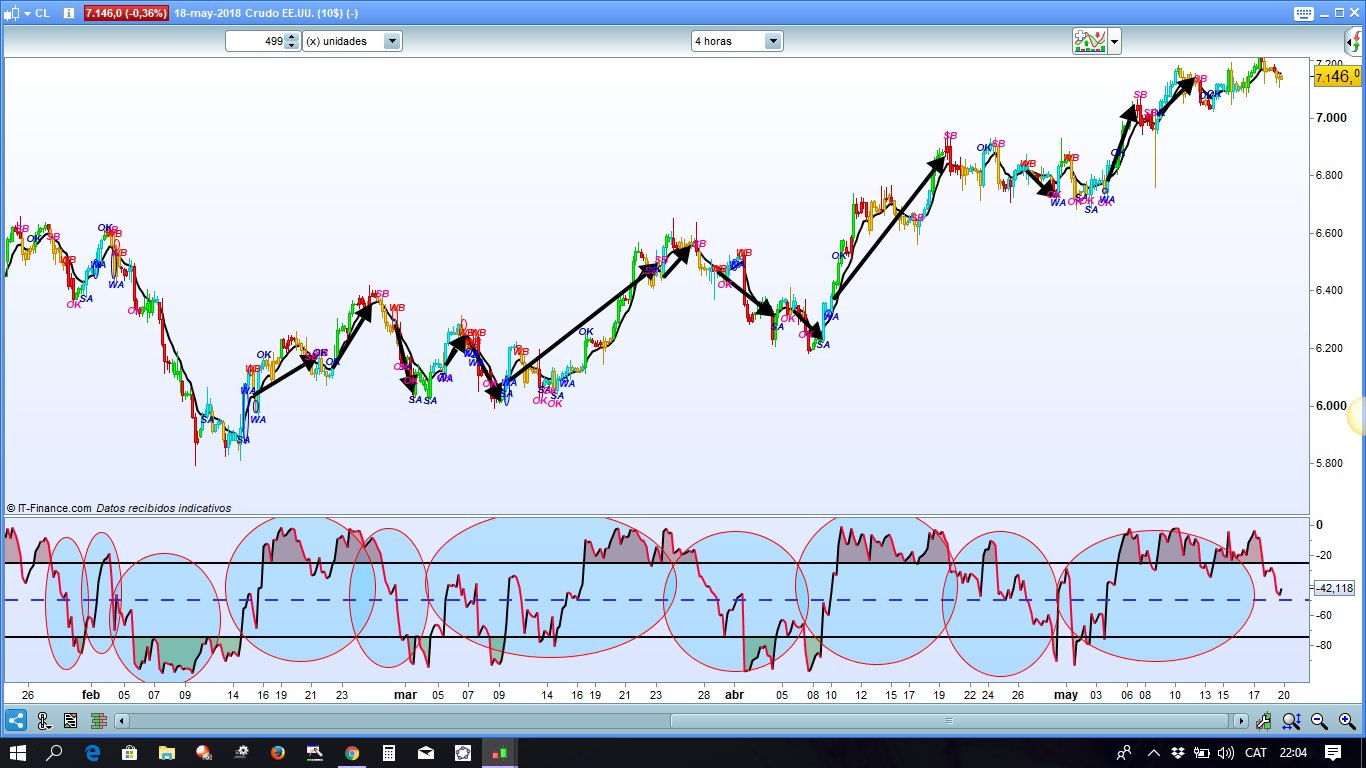
Signals of Williams% programmed by Domenec Suria
This indicator gives the willy signals (the Williams% oscillator with 40-period programming and the lines over -25 and -75 with a central line at -50. This information or signals draws them directly on the graph)
The functioning of this indicator is the following:
The willy Williams oscillator% [40] marks the cycles with a very high probability every time that it crosses the middle line of -50 I say that it opens cycle and if it is checked with history in any temporality it has a probability of successes superior to 90% and when it fails is usually to go against a very strong trend if only cycles are checked in favor of Trend this is 99%.
In view of this feature the information given by this indicator or the signals given in the graph are the following:
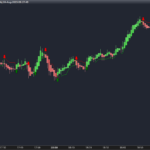
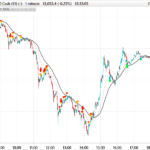
SA output from the line of “overselling” then WA that is accompanied by a small ellipse to make it more visual, is open cycle , OK blue is cycle closure, however you have to keep the trade until the SB signal comes out if it comes back OK blue checking with other systems but it is more likely to continue the bullish movement until it comes back out SB.
In a bearish sense it is the same but on the other hand the movement with SB is validated and the trade with WB is opened and the cycle with red OK is closed, however, as before, the trade remains until it leaves SA in a clear and definitive way
willy = Williams [40] -75 -25 and opening cycles when crossing -50
//Señales del Willy programado por Domenec Suria
//Este indicador lo que hace es dar las señales del willy (El oscilador Williams% con programacion de 40 periodos y las lineas sobre ajustadas a -25 y -75 con una linea central en -50  Esta informacion o señales las dibuja directamente sobre el grafico
// El funcionamiento de este indicador es el siguiente:
//El Oscilador willy Williams%[40] marca los ciclos con una altisima probabilidad cada vez que cruza la linea media de -50 digo que abre ciclo y si se comprueba con historico en cualquier temporalidad tiene una probabilidad de aciertos superior al 90% y cuando falla suele ser por ir contra una tendencia muy fuerte si solo se comprueban los ciclos a favor de Tendencia esta es de un 99%
//En vistas de esta caracteristica la informacion que da  este indicador  o las señales que da en el grafico son las siguientes:  SA salida de la linea de "sobreventa"   luego WA  que va acompañada de una pequeña elipse para que sea mas visual, es ciclo abierto, OK azul es cierre de ciclo, sin embargo hay que mantener el trade hasta que sale la señal SB si vuelve a salir OK azul comprobando con otros sistemas pero mo mas probable es que siga el movimiento alcista hasta que vuelva a salir SB
//En sentido bajista es igual pero al reves empeza el movimiento con SB se valida y se abre el trade con WB y se cierra el ciclo con OK rojo sin embargo igual que antes se mantiene el trade hasta que sale de SA de forma clara y definitiva

siFrameTime = 1

willy = Williams[40]
radius=average[50](range)/4


if SiFrameTime =1 then
if willy CROSSES OVER -50.1 then

DRAWTEXT("WA", barindex,low-1.5*pointsize / 0.2,SansSerif,boldItalic,10) COLOURED(0,0,255)
DRAWELLIPSE(barindex[0], low-1.5*pointsize+radius, barindex[2], low[2]-radius) COLOURED(0,0,255)

elsif willy CROSSES UNDER -50 then
DRAWTEXT("WB", barindex,high+1.5*pointsize/ 0.2,SansSerif,boldItalic,10) COLOURED(255,0,0)
DRAWELLIPSE(barindex, high+1.5*pointsize+radius, barindex[2], high[2]-radius) COLOURED(255,0,0)

elsif willy CROSSES OVER -75 then

DRAWTEXT("SA", barindex,low-1*pointsize / 0.2,SansSerif,boldItalic,10) COLOURED(0,0,150)

elsif willy CROSSES under -25 then

DRAWTEXT("SB", barindex,high+1*pointsize / 0.2,SansSerif,boldItalic,10) COLOURED(255,0,150)

elsif willy CROSSES under -73 then

DRAWTEXT("OK", barindex,low-2*pointsize / 0.2,SansSerif,boldItalic,10) COLOURED(255,0,150)

elsif willy CROSSES over -27 then

DRAWTEXT("OK", barindex,high+2*pointsize / 0.2,SansSerif,boldItalic,10) COLOURED(0,0,150)

endif
endif
If SiFrameTime= 2 then
if willy CROSSES OVER -50.1 then

DRAWTEXT("WA", barindex,low-3.5*pointsize / 0.2,SansSerif,boldItalic,10) COLOURED(0,0,255)
DRAWELLIPSE(barindex[0], low-2.5*pointsize+radius, barindex[2], low[2]-radius) COLOURED(0,0,255)

elsif willy CROSSES UNDER -50 then
DRAWTEXT("WB", barindex,high+3.5*pointsize/ 0.2,SansSerif,boldItalic,10) COLOURED(255,0,0)
DRAWELLIPSE(barindex, high+2.5*pointsize+radius, barindex[2], high[2]-radius) COLOURED(255,0,0)

elsif willy CROSSES OVER -75 then

DRAWTEXT("SA", barindex,low-3*pointsize / 0.2,SansSerif,boldItalic,10) COLOURED(0,0,150)

elsif willy CROSSES under -25 then

DRAWTEXT("SB", barindex,high+3*pointsize / 0.2,SansSerif,boldItalic,10) COLOURED(255,0,150)

elsif willy CROSSES under -73 then

DRAWTEXT("OK", barindex,low-3*pointsize / 0.2,SansSerif,boldItalic,10) COLOURED(255,0,150)

elsif willy CROSSES over -27 then

DRAWTEXT("OK", barindex,high+3*pointsize / 0.2,SansSerif,boldItalic,10) COLOURED(0,0,150)

endif
endif
If SiFrameTime=3 then
if willy CROSSES OVER -50.1 then

DRAWTEXT("WA", barindex,low-7*pointsize / 0.2,SansSerif,boldItalic,10) COLOURED(0,0,255)
DRAWELLIPSE(barindex[0], low-5*pointsize+radius, barindex[2], low[2]-radius) COLOURED(0,0,255)

elsif willy CROSSES UNDER -50 then
DRAWTEXT("WB", barindex,high+7*pointsize/ 0.2,SansSerif,boldItalic,10) COLOURED(255,0,0)
DRAWELLIPSE(barindex, high+5*pointsize+radius, barindex[2], high[2]-radius) COLOURED(255,0,0)

elsif willy CROSSES OVER -75 then

DRAWTEXT("SA", barindex,low-6*pointsize / 0.2,SansSerif,boldItalic,10) COLOURED(0,0,150)

elsif willy CROSSES under -25 then

DRAWTEXT("SB", barindex,high+6*pointsize / 0.2,SansSerif,boldItalic,10) COLOURED(255,0,150)

elsif willy CROSSES under -73 then

DRAWTEXT("OK", barindex,low-6*pointsize / 0.2,SansSerif,boldItalic,10) COLOURED(255,0,150)

elsif willy CROSSES over -27 then

DRAWTEXT("OK", barindex,high+6*pointsize / 0.2,SansSerif,boldItalic,10) COLOURED(0,0,150)
endif
endif


return
Comments
You must be logged in to post a comment.

okay bien estaré pendiente en esta pagina gracias
Hola Geronima Yo no creo en los sistemas individualizados obviamente que se puede hacer de forma muy facil es cambiar las instrucciones de drawtext por buy or sell at market sin embargo los robots no tienen materia gris y al final siempre acaban en perdidas el dia que un solo robot funcione se acabara este negocio a nivel mundial Considero mas interesante que los robots den las señales y el trader toma las decisiones si el parametro de si frametime lo que hace es dibujar las señales mas cerca o mas lejos del final de la vela para las diferentes tempos si es en m1 no es igual que si es en semanal sin embargo he aabado de pulirlo y este parametro ha cambiado esta misma semana colgare el robot ya definitivo para mi y un video explicando bien como funciona y como leer las señales
gracias me parece muy interesante una pregunta: seria interesante individuar las zonas oraria mas profitable de cada mercado/instrumentos no te parece? y tambien cosa muy importante: crear un sistema de trading para ver si en ne largo plazo gana algo.... en cial instruemnto y con que parametros.... me dice que es y a que sirve SIFRAMETIME????? lo muevo desde 1 a 3 pero no pasa nada....


NO plota nada! porque?

mi scrivi il codice per metterlo in automatico ? grazie
si puo fare come trading sistem ?
tradingpro Yo no creo en sistemas automatizados conozco bastante bien el tema y desde hace muchos años los robots No tienen materia gris (aun asi voy probando) el otro dia uno con unos resultados sorprendentes en H1 profit de 4:1 y 65% de operaciones positivas en 500 barras en bactesting ganaba mas de un 500% sin embargo si lo probabas en 600 barras en solo 3 dias perdia los 10000 euros del Capital (operaba a 5 euros punto) Por tanto prefiero hacer robots que me den señales provechosas y yo tomo las decisiones de trading
Gracias Domenec