





VWAP Range Breakout
Introduction
Most channel indicators move with every bar, so their edges are always chasing price. The VWAP Range Breakout by Zeiierman takes the opposite approach: it builds a horizontal range around a volume-weighted center and keeps it fixed until a whole candle closes outside it. Only then is a new range anchored.
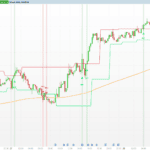
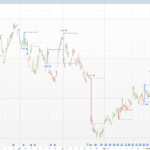
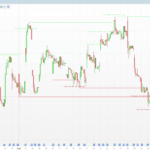
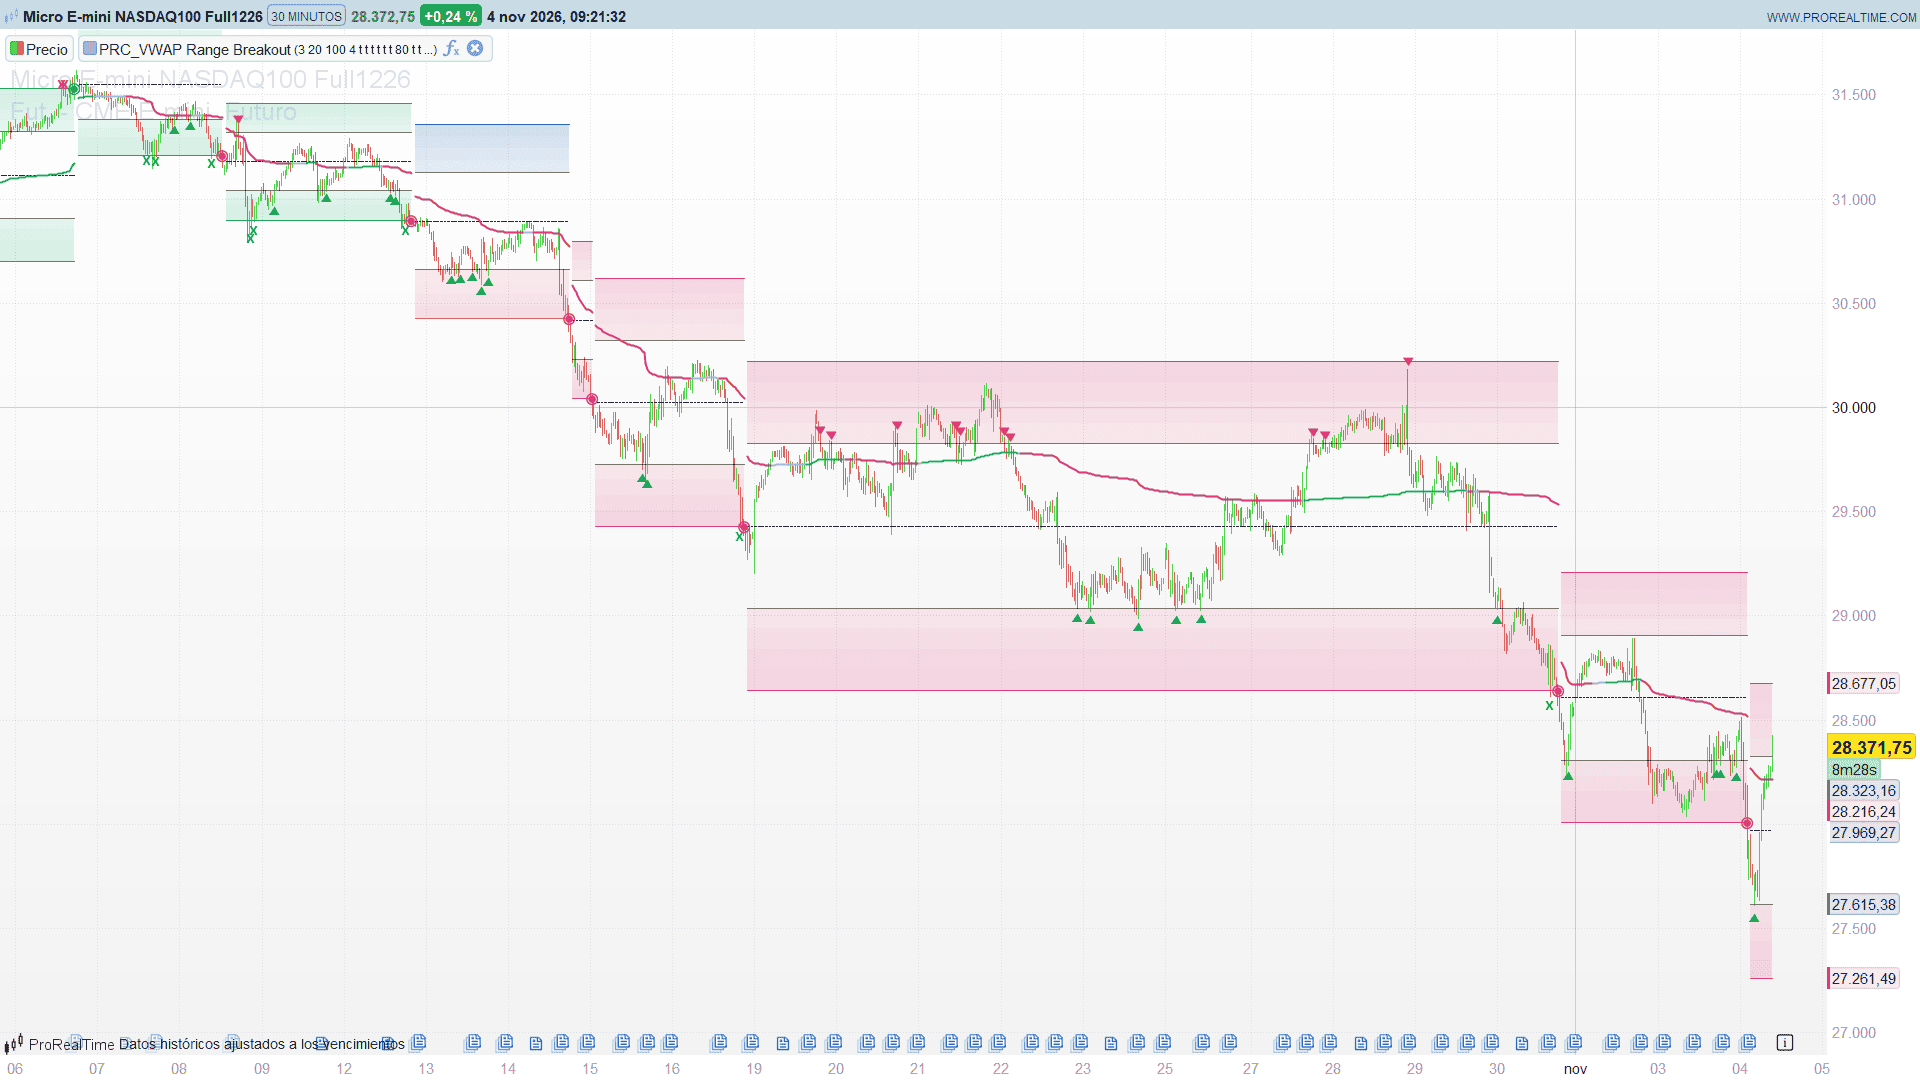
The result is a clean map of balance areas. Inside each range you get interior bands for mean-reversion entries, outer boundaries that mark failed excursions, a VWAP anchored to the start of the range that is colored by the flow of value, and a circle on every confirmed breakout. Each range is also colored by the internal trend that was active when it formed, so you can tell at a glance whether a balance area was built in a bullish, bearish or neutral context.
Theory Behind the Indicator
The range engine. When a range forms, its center is the VWAP of the typical price over the last few bars (3 by default). Its half-width is the larger of two values:
- the volume-weighted dispersion of the typical price around a rolling 20-bar VWAP, measured over the last 100 bars and multiplied by the Width factor (4 by default);
- the distance needed for the formation candle to fit entirely inside the range.
The interior bands sit halfway between the center and each boundary. The range stays exactly where it is until the low of a bar crosses above the upper boundary or the high of a bar crosses below the lower one. That full-candle breakout is the only event that anchors a new range.
The range-anchored VWAP. From the bar the range forms, a cumulative VWAP is calculated, seeded with the volume and typical price of the previous 34 bars so that it does not start from a single point.
The smart trend. An internal trend structure works in the background:
- a rolling 200-bar VWAP moves through a staircase of adaptive steps; each step is ATR(14) times the Sensitivity, scaled by a sigmoid of the ratio between ATR(14) and ATR(56) and of the z-score of ATR(14) over 120 bars, so the structure needs a larger move when volatility expands;
- when the staircase changes direction, a reversal VWAP is anchored at that bar;
- the trend turns bullish after two consecutive closes above both the range VWAP and the reversal VWAP while the structure points up, and bearish in the opposite case. It goes back to neutral when the structure flips or price moves back through the reversal VWAP.
Value Transfer. The default VWAP color mode keeps an exponential memory of the moves of the range VWAP that go in the same direction as price, weighted by the size of the move, the relative volume and the distance from the VWAP. A memory above +0.25 colors the VWAP bullish, below -0.25 bearish, and neutral in between. It resets with every new range.
Key Features at a Glance
- Horizontal ranges anchored to a volume-weighted center, fixed until a confirmed full-candle breakout.
- Range width adapted to volume-weighted volatility, never narrower than the formation candle.
- Interior bands and a dashed center line.
- Gradient fills that fade from each boundary toward the interior.
- Each range colored by the smart trend at its formation (bullish, bearish or neutral); the color never changes during that range.
- Range-anchored VWAP with four color modes: Trend, Slope, Price and Value Transfer.
- Arrows for lower-band recoveries and upper-band rejections, optionally filtered by the smart trend.
- X markers for failed excursions beyond the outer boundaries.
- Circles on confirmed breakouts, drawn on the broken boundary.
How to Read the Indicator
- Green up arrow: the low crosses back above the lower interior band. Price is recovering from the bottom of the range.
- Red down arrow: the high crosses back below the upper interior band. Price is being rejected from the top of the range.
- X above the candles: the high was beyond the upper boundary and returns inside. A failed upside excursion.
- X below the candles: the low was below the lower boundary and returns inside. A failed downside excursion.
- Circle on the boundary: a whole candle has broken out of the range. A new range starts on that bar.
- Range colors: both bands green means the range formed in a bullish trend, both red in a bearish one, blue upper and orange lower in a neutral context.
- VWAP color: green, red or grey according to the selected mode.
By default the arrows, X markers and circles are placed on the candle before the one that confirms them, so that they line up with the move on the chart. Set backOn to 0 to place them on the detection candle.
Practical Applications
- Range trading: buy recoveries of the lower interior band and sell rejections of the upper one while the range holds. With trFilter = 1, only the arrows in the direction of the smart trend are shown.
- Fakeout detection: an X marker after a push beyond a boundary often precedes a move back to the center or to the opposite side.
- Breakout confirmation: the circle only appears when a whole candle is outside the range, which filters out wicks that briefly pierce a boundary.
- Context: the locked color of each range and the color of its VWAP tell you whether the balance area is being accepted higher, lower or not at all.
During the live bar the indicator recalculates with every tick, so a breakout or a signal can appear and disappear before the bar closes. It is final at the close.
Indicator Configuration
- seedLen (default 3): bars used for the volume-weighted center of a new range (1 to 30).
- eqLen (default 20): rolling VWAP period used as the equilibrium of the dispersion (2 to 100).
- devLen (default 100): bars of the dispersion memory (20 to 400).
- chMult (default 4.0): range width multiplier. Higher values give wider ranges and fewer resets.
- arrOn (default 1): show the arrows.
- xOn (default 1): show the X markers.
- dotOn (default 1): show the breakout circles.
- backOn (default 1): place the marks on the preceding candle.
- lockOn (default 1): color each range by the smart trend at its formation. With 0, the upper band uses the up color and the lower band the down color.
- gradOn (default 1): fade the colored bands toward the interior.
- fade (default 80): transparency of the colored band edges (0 to 100).
- midOn (default 1): dashed center line; 0 draws it continuous.
- vOn (default 1): show the range-anchored VWAP.
- vMode (default 3): VWAP color mode. 0 = Trend, 1 = Slope, 2 = Price, 3 = Value Transfer.
- trLen (default 200): length of the rolling VWAP of the trend structure (20 to 500).
- trMult (default 1.5): sensitivity of the trend structure (0.1 to 6).
- trFilter (default 0): 1 = bullish arrows only in a bullish smart trend and bearish arrows only in a bearish one.
- Palette: the red, green and blue components of every color are at the start of the code (up, down, bullish range, bearish range, neutral upper and lower bands, and the three VWAP colors).
The first range appears after eqLen + devLen – 2 bars (118 with the default settings), so load enough history.
The Code
//---------------------------------------------------------------
// PRC_VWAP Range Breakout
// version = 0
// 04.11.2026
// Iván González @ www.prorealcode.com
// Author: Zeiierman
// Sharing ProRealTime knowledge
//--------------------------------------------------------------------//
DEFPARAM DRAWONLASTBARONLY = true

// ===================== INPUTS: RANGE =====================
seedLen = 3            // re-anchor: bars of the volume-weighted center of a new range (1 - 30)
eqLen = 20             // equilibrium: rolling VWAP period of the dispersion (2 - 100)
devLen = 100           // deviation memory, in bars (20 - 400)
chMult = 4.0           // range width multiplier (0.5 - 15)

// ===================== INPUTS: SIGNALS =====================
arrOn = 1              // 1 = arrows (lower-band recovery / upper-band rejection)
xOn = 1                // 1 = X markers (failed excursion beyond an outer boundary)
dotOn = 1              // 1 = circles on confirmed full-candle breakouts
backOn = 1             // 1 = place the marks on the preceding candle

// ===================== INPUTS: RANGE COLORS =====================
lockOn = 1             // 1 = color each range by the smart trend at its formation
gradOn = 1             // 1 = fade the colored bands toward the channel interior
fade = 80              // transparency of the colored band edges (0 - 100)
midOn = 1              // 1 = dashed center line, 0 = continuous

// ===================== INPUTS: RANGE VWAP =====================
vOn = 1                // 1 = show the range-anchored VWAP
vMode = 3              // VWAP color mode: 0 = Trend, 1 = Slope, 2 = Price, 3 = Value Transfer

// ===================== INPUTS: SMART TREND =====================
trLen = 200            // length of the rolling VWAP of the trend structure (20 - 500)
trMult = 1.5           // sensitivity: distance multiplier of the structure (0.1 - 6)
trFilter = 0           // 1 = bullish arrows only in a bullish smart trend, bearish in a bearish one

// ===================== PALETTE =====================
upR = 29               // up color (arrows, upward circles, lower X)
upG = 172
upB = 112
dnR = 223              // down color (arrows, downward circles, upper X)
dnG = 58
dnB = 121
zuR = 29               // bullish range (both bands)
zuG = 172
zuB = 112
zdR = 223              // bearish range (both bands)
zdG = 58
zdB = 121
nuR = 29               // neutral range, upper band
nuG = 93
nuB = 172
ndR = 223              // neutral range, lower band
ndG = 97
ndB = 58
vuR = 29               // VWAP bullish
vuG = 172
vuB = 112
vdR = 223              // VWAP bearish
vdG = 58
vdB = 121
vfR = 176              // VWAP neutral
vfG = 182
vfB = 194

// ===================== VWAP RANGE ENGINE =====================
hlc = (high + low + close) / 3
IF volume > 0 THEN
   wt = volume
ELSE
   wt = 1
ENDIF
pw = hlc * wt
seedPV = summation[34](pw)
seedV = summation[34](wt)
baseVW = summation[seedLen](pw) / max(summation[seedLen](wt), 0.00000001)
eqVW = summation[eqLen](pw) / max(summation[eqLen](wt), 0.00000001)
devV = summation[devLen](wt)
resV = hlc - eqVW
wRes = wt * resV * resV
devW = sqrt(max(0, summation[devLen](wRes) / max(devV, 0.00000001)))
wBase = max(devW * chMult, ticksize * 2)
wCover = max(abs(high - baseVW), abs(low - baseVW)) + ticksize
rWidth = max(wBase, wCover)

// the dispersion needs devLen bars of residuals, and each residual needs eqLen bars of VWAP
readyBar = max(max(max(seedLen, eqLen), devLen), eqLen + devLen - 2)
ready = 0
IF barindex >= readyBar THEN
   ready = 1
ENDIF

ONCE rngOn = 0

// full-candle breakout of the range that was active before this bar
brUp = 0
brDn = 0
IF barindex >= 2 THEN
   IF rngOn[2] = 1 THEN
      IF low > rgHi[1] AND low[1] <= rgHi[2] THEN
         brUp = 1
      ENDIF
      IF high < rgLo[1] AND high[1] >= rgLo[2] THEN
         brDn = 1
      ENDIF
   ENDIF
ENDIF

rngNew = 0
IF ready = 1 THEN
   IF rngOn = 0 OR brUp = 1 OR brDn = 1 THEN
      rngNew = 1
   ENDIF
ENDIF

IF rngNew = 1 THEN
   rgMid = baseVW
   rgHi = baseVW + rWidth
   rgLo = baseVW - rWidth
   rgHiM = (rgMid + rgHi) / 2
   rgLoM = (rgMid + rgLo) / 2
   sumPV = seedPV
   sumV = seedV
   rngOn = 1
ELSIF rngOn = 1 THEN
   sumPV = sumPV + pw
   sumV = sumV + wt
ENDIF

IF rngOn = 1 THEN
   rngVW = sumPV / max(sumV, 0.00000001)
ENDIF

// ===================== VOLATILITY-DRIVEN TREND STRUCTURE =====================
trVW = summation[trLen](pw) / max(summation[trLen](wt), 0.00000001)
aFast = averagetruerange[14](close)
aSlow = averagetruerange[56](close)
aMean = average[120](aFast)
aDev = std[120](aFast)

// ATR(14) starts at bar 13 and its 120-bar mean at bar 132
trReady = 0
stepT = 0
IF barindex >= max(trLen - 1, 132) THEN
   aZ = 0
   IF aDev > 0 THEN
      aZ = (aFast - aMean) / aDev
   ENDIF
   vRatio = 1
   IF aSlow > 0 THEN
      vRatio = aFast / aSlow
   ENDIF
   xS = 4.0 * (vRatio - 1.0) + 0.75 * max(-3.0, min(3.0, aZ))
   stepT = aFast * trMult * (0.5 + 1.5 / (1.0 + exp(0 - xS)))
   IF stepT > 0 THEN
      trReady = 1
   ENDIF
ENDIF

ONCE tInit = 0
ONCE tDir = 0
IF trReady = 1 THEN
   IF tInit = 0 THEN
      tHi = trVW
      tLo = trVW - stepT
      tDir = 1
      tInit = 1
   ELSE
      expUp = trVW > tHi + stepT
      expDn = trVW < tLo - stepT
      IF expUp THEN
         nDir = 1
      ELSIF expDn THEN
         nDir = -1
      ELSE
         nDir = tDir
      ENDIF
      IF expUp OR expDn THEN
         IF nDir = 1 THEN
            refT = tHi
         ELSE
            refT = tLo
         ENDIF
         nSteps = max(1, floor(abs(trVW - refT) / stepT))
         IF nDir = 1 THEN
            tLo = tHi + (nSteps - 1) * stepT
            tHi = tHi + nSteps * stepT
         ELSE
            tHi = tLo - (nSteps - 1) * stepT
            tLo = tLo - nSteps * stepT
         ENDIF
         tDir = nDir
      ENDIF
   ENDIF
ENDIF

trFlip = 0
IF barindex >= 1 THEN
   IF tDir <> 0 AND tDir[1] <> 0 AND tDir <> tDir[1] THEN
      trFlip = 1
   ENDIF
ENDIF

// ===================== INTERNAL REVERSAL VWAP & SMART TREND =====================
ONCE revOn = 0
IF trReady = 1 THEN
   IF trFlip = 1 OR revOn = 0 THEN
      revPV = pw
      revV = wt
      revOn = 1
   ELSE
      revPV = revPV + pw
      revV = revV + wt
   ENDIF
ENDIF

revOk = 0
IF revOn = 1 THEN
   IF revV > 0 THEN
      revVW = revPV / max(revV, 0.00000001)
      revOk = 1
   ENDIF
ENDIF

IF barindex >= 13 THEN
   atrV = max(aFast, ticksize)
ELSE
   atrV = ticksize
ENDIF

upAgree = 0
dnAgree = 0
IF trReady = 1 AND rngOn = 1 AND revOk = 1 THEN
   IF tDir = 1 AND close > rngVW AND close > revVW + atrV * 0.05 THEN
      upAgree = 1
   ENDIF
   IF tDir = -1 AND close < rngVW AND close < revVW - atrV * 0.05 THEN
      dnAgree = 1
   ENDIF
ENDIF

ONCE upStreak = 0
ONCE dnStreak = 0
ONCE smTrend = 0
IF upAgree = 1 THEN
   upStreak = upStreak + 1
ELSE
   upStreak = 0
ENDIF
IF dnAgree = 1 THEN
   dnStreak = dnStreak + 1
ELSE
   dnStreak = 0
ENDIF
IF trFlip = 1 THEN
   smTrend = 0
ENDIF
IF upStreak >= 2 THEN
   smTrend = 1
ELSIF dnStreak >= 2 THEN
   smTrend = -1
ELSIF smTrend = 1 AND (tDir <> 1 OR (revOk = 1 AND close < revVW - atrV * 0.15)) THEN
   smTrend = 0
ELSIF smTrend = -1 AND (tDir <> -1 OR (revOk = 1 AND close > revVW + atrV * 0.15)) THEN
   smTrend = 0
ENDIF

// ===================== LOCKED RANGE COLORS =====================
ONCE rngState = 0
IF rngNew = 1 THEN
   rngState = smTrend
ENDIF

IF lockOn = 1 THEN
   IF rngState = 1 THEN
      hR = zuR
      hG = zuG
      hB = zuB
      lR = zuR
      lG = zuG
      lB = zuB
   ELSIF rngState = -1 THEN
      hR = zdR
      hG = zdG
      hB = zdB
      lR = zdR
      lG = zdG
      lB = zdB
   ELSE
      hR = nuR
      hG = nuG
      hB = nuB
      lR = ndR
      lG = ndG
      lB = ndB
   ENDIF
ELSE
   hR = upR
   hG = upG
   hB = upB
   lR = dnR
   lG = dnG
   lB = dnB
ENDIF

// ===================== SIGNAL ENGINE =====================
steady = 0
IF barindex >= 1 THEN
   IF rngOn[1] = 1 AND rgMid = rgMid[1] THEN
      steady = 1
   ENDIF
ENDIF

buySig = 0
sellSig = 0
failUp = 0
failDn = 0
IF steady = 1 THEN
   IF low > rgLoM AND low[1] <= rgLoM[1] THEN
      IF trFilter = 0 OR smTrend = 1 THEN
         buySig = 1
      ENDIF
   ENDIF
   IF high < rgHiM AND high[1] >= rgHiM[1] THEN
      IF trFilter = 0 OR smTrend = -1 THEN
         sellSig = 1
      ENDIF
   ENDIF
   IF high < rgHi AND high[1] >= rgHi[1] THEN
      failUp = 1
   ENDIF
   IF low > rgLo AND low[1] <= rgLo[1] THEN
      failDn = 1
   ENDIF
ENDIF

// ===================== RANGE RENDERING =====================
// a new range leaves a gap: the bar where it forms and the next one are hidden (alpha 0)
newSeg = 1
IF barindex >= 1 THEN
   IF rngOn[1] = 1 AND rgMid = rgMid[1] THEN
      newSeg = 0
   ENDIF
ENDIF
segVis = 0
IF barindex >= 1 THEN
   IF rngOn = 1 AND newSeg = 0 AND newSeg[1] = 0 THEN
      segVis = 1
   ENDIF
ENDIF

IF barindex < readyBar THEN
   pTop = undefined
   pTopI = undefined
   pBotI = undefined
   pBot = undefined
   pMid = undefined
   pVW = undefined
ELSE
   pTop = rgHi
   pTopI = rgHiM
   pBotI = rgLoM
   pBot = rgLo
   pMid = rgMid
   pVW = rngVW
ENDIF

lnA = 0
inA = 0
midA = 0
IF segVis = 1 THEN
   lnA = 255
   inA = 127
   IF midOn = 0 OR barindex MOD 2 = 0 THEN
      midA = 255
   ENDIF
ENDIF

// gradient fills: 4 bands per side, each with the opacity of the gradient at its center
// (opacity goes from 0 at the range center to the edge opacity at the outer boundary)
edgeA = (100 - fade) * 2.55
IF gradOn = 1 THEN
   fA0 = edgeA * (0.5 + 0.5 / 8)
   fA1 = edgeA * (0.5 + 1.5 / 8)
   fA2 = edgeA * (0.5 + 2.5 / 8)
   fA3 = edgeA * (0.5 + 3.5 / 8)
ELSE
   fA0 = edgeA
   fA1 = edgeA
   fA2 = edgeA
   fA3 = edgeA
ENDIF
IF segVis = 0 THEN
   fA0 = 0
   fA1 = 0
   fA2 = 0
   fA3 = 0
ENDIF
uStep = (pTop - pTopI) / 4
dStep = (pBotI - pBot) / 4
u1 = pTopI + uStep
u2 = pTopI + 2 * uStep
u3 = pTopI + 3 * uStep
d1 = pBotI - dStep
d2 = pBotI - 2 * dStep
d3 = pBotI - 3 * dStep
COLORBETWEEN(pTopI, u1, hR, hG, hB, fA0)
COLORBETWEEN(u1, u2, hR, hG, hB, fA1)
COLORBETWEEN(u2, u3, hR, hG, hB, fA2)
COLORBETWEEN(u3, pTop, hR, hG, hB, fA3)
COLORBETWEEN(pBotI, d1, lR, lG, lB, fA0)
COLORBETWEEN(d1, d2, lR, lG, lB, fA1)
COLORBETWEEN(d2, d3, lR, lG, lB, fA2)
COLORBETWEEN(d3, pBot, lR, lG, lB, fA3)

// ===================== RANGE VWAP COLOR ENGINE =====================
dv = 0
IF rngNew = 0 AND rngOn = 1 AND barindex >= 1 THEN
   IF rngOn[1] = 1 THEN
      dv = rngVW - rngVW[1]
   ENDIF
ENDIF
adv = abs(dv)
// EMA(12) of the VWAP step; it is 0 until the first range, so a zero seed is exact
ONCE stepAvg = 0
IF barindex >= 1 THEN
   stepAvg = adv * 2 / 13 + stepAvg[1] * 11 / 13
ENDIF
volAvg = average[20](wt)
exc = 0
IF rngOn = 1 THEN
   exc = (hlc - rngVW) / atrV
ENDIF
mvR = min(2.5, adv / max(stepAvg, ticksize * 0.1))
impV = 0
IF exc * dv > 0 THEN
   relVol = max(0.25, min(3.0, wt / max(volAvg, 0.00000001)))
   impV = sgn(dv) * mvR * sqrt(relVol) * min(2.0, abs(exc))
ENDIF

ONCE vMem = 0
IF rngNew = 1 THEN
   vMem = 0
ELSE
   vMem = 0.85 * vMem + 0.15 * impV
ENDIF

vwState = 0
IF rngOn = 1 THEN
   IF vMode = 0 THEN
      vwState = smTrend
   ELSIF vMode = 1 THEN
      slTol = max(atrV * 0.0005, ticksize * 0.1)
      IF rngNew = 1 OR rngOn[1] = 0 THEN
         vwState = 0
      ELSIF dv > slTol THEN
         vwState = 1
      ELSIF dv < 0 - slTol THEN
         vwState = -1
      ENDIF
   ELSIF vMode = 2 THEN
      IF close > rngVW THEN
         vwState = 1
      ELSIF close < rngVW THEN
         vwState = -1
      ENDIF
   ELSE
      IF vMem > 0.25 THEN
         vwState = 1
      ELSIF vMem < -0.25 THEN
         vwState = -1
      ENDIF
   ENDIF
ENDIF

IF vwState = 1 THEN
   vR = vuR
   vG = vuG
   vB = vuB
ELSIF vwState = -1 THEN
   vR = vdR
   vG = vdG
   vB = vdB
ELSE
   vR = vfR
   vG = vfG
   vB = vfB
ENDIF

vA = 0
IF vOn = 1 AND rngOn = 1 AND barindex >= 1 THEN
   IF rngNew = 0 AND rngNew[1] = 0 THEN
      vA = 255
   ENDIF
ENDIF

// ===================== MARKERS =====================
IF backOn = 1 THEN
   mX = barindex - 1
   yLo = low[1]
   yHi = high[1]
ELSE
   mX = barindex
   yLo = low
   yHi = high
ENDIF
mOff = 0.4 * atrV

// marks are stored when they happen and redrawn on the last bar (the source keeps the last 480)
// pure assignment at a scalar index: a tick that drops the signal is overwritten, never added twice
ONCE nMk = 0
IF dotOn = 1 AND brUp = 1 THEN
   $mkX[nMk] = mX
   $mkY[nMk] = rgHi[1]
   $mkT[nMk] = 1
   nMk = nMk + 1
ENDIF
IF dotOn = 1 AND brDn = 1 THEN
   $mkX[nMk] = mX
   $mkY[nMk] = rgLo[1]
   $mkT[nMk] = 2
   nMk = nMk + 1
ENDIF
IF arrOn = 1 AND buySig = 1 THEN
   $mkX[nMk] = mX
   $mkY[nMk] = yLo - mOff
   $mkT[nMk] = 3
   nMk = nMk + 1
ENDIF
IF arrOn = 1 AND sellSig = 1 THEN
   $mkX[nMk] = mX
   $mkY[nMk] = yHi + mOff
   $mkT[nMk] = 4
   nMk = nMk + 1
ENDIF
IF xOn = 1 AND failUp = 1 THEN
   $mkX[nMk] = mX
   $mkY[nMk] = yHi + mOff
   $mkT[nMk] = 5
   nMk = nMk + 1
ENDIF
IF xOn = 1 AND failDn = 1 THEN
   $mkX[nMk] = mX
   $mkY[nMk] = yLo - mOff
   $mkT[nMk] = 6
   nMk = nMk + 1
ENDIF

IF islastbarupdate AND nMk > 0 THEN
   FOR k = max(0, nMk - 480) TO nMk - 1 DO
      kX = $mkX[k]
      kY = $mkY[k]
      IF $mkT[k] = 1 THEN
         DRAWTEXT("◉", kX, kY, sansserif, bold, 16) COLOURED(upR, upG, upB, 255)
      ELSIF $mkT[k] = 2 THEN
         DRAWTEXT("◉", kX, kY, sansserif, bold, 16) COLOURED(dnR, dnG, dnB, 255)
      ELSIF $mkT[k] = 3 THEN
         DRAWTEXT("▲", kX, kY, sansserif, bold, 12) COLOURED(upR, upG, upB, 255)
      ELSIF $mkT[k] = 4 THEN
         DRAWTEXT("▼", kX, kY, sansserif, bold, 12) COLOURED(dnR, dnG, dnB, 255)
      ELSIF $mkT[k] = 5 THEN
         DRAWTEXT("X", kX, kY, sansserif, bold, 12) COLOURED(dnR, dnG, dnB, 255)
      ELSE
         DRAWTEXT("X", kX, kY, sansserif, bold, 12) COLOURED(upR, upG, upB, 255)
      ENDIF
   NEXT
ENDIF

RETURN pTop COLOURED(hR, hG, hB, lnA) AS "Range Upper", pTopI COLOURED(0, 0, 0, inA) AS "Range Upper Interior", pBotI COLOURED(0, 0, 0, inA) AS "Range Lower Interior", pBot COLOURED(lR, lG, lB, lnA) AS "Range Lower", pMid COLOURED(0, 0, 0, midA) AS "Range Center", pVW COLOURED(vR, vG, vB, vA) STYLE(line, 2) AS "Range-Anchored VWAP"