FRAMA Channel
Introduction
Every moving average forces the same compromise: fast enough to follow a trend means jumpy enough to whipsaw in a range. The usual answers are to smooth harder and accept the lag, or to add a second filter and accept the extra parameter.
A fractal adaptive moving average takes a different route. It measures how rough the recent price path is and changes its own smoothing constant bar by bar. When price travels in a straight line, the average speeds up until it is almost sitting on the close. When price shuttles up and down inside a range, the average slows down to a near-flat line. One parameter, and the responsiveness is decided by the market rather than by you.
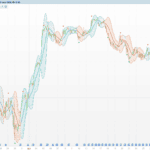
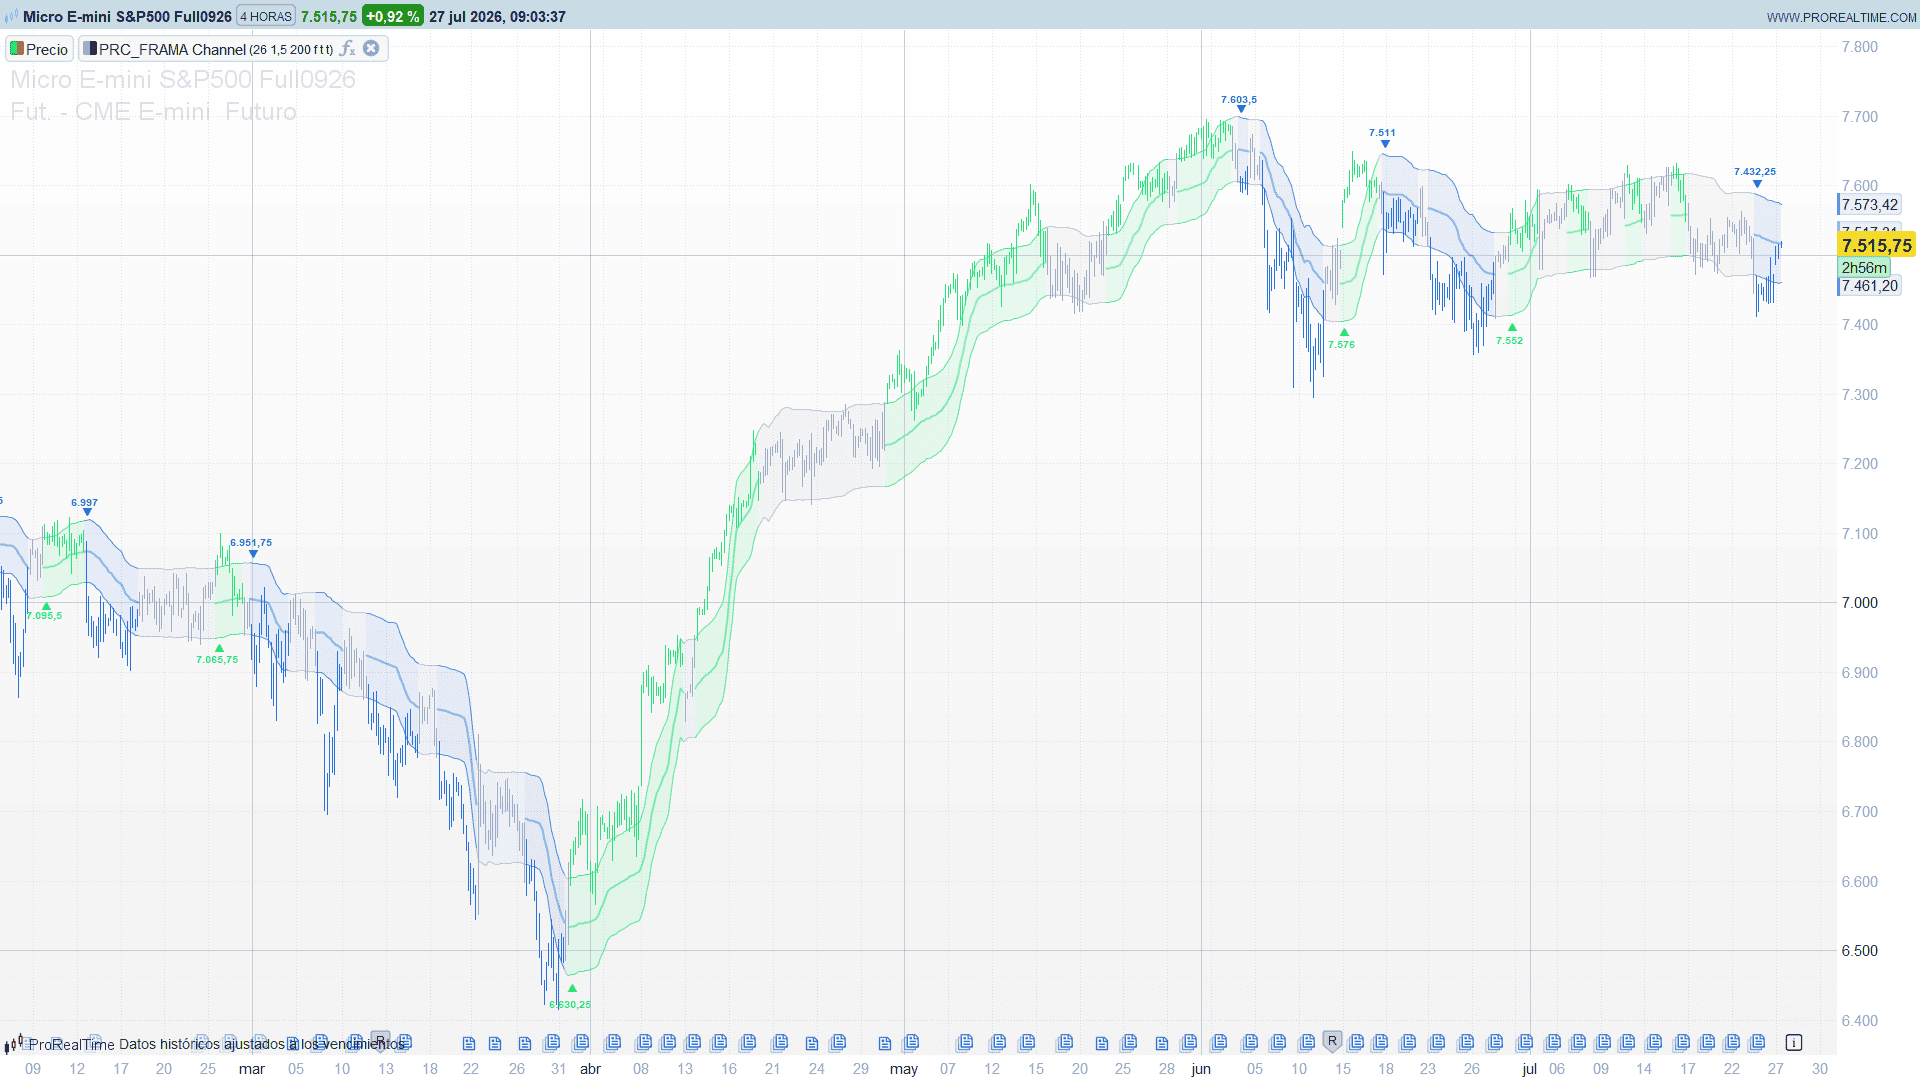
This indicator wraps that average in a channel: two bands at a fixed multiple of recent volatility, plus a momentum state that turns green when price breaks out above, blue when it breaks down below, and grey when price comes back through the middle. It is a price overlay and works on any instrument and timeframe with enough history loaded.
The Fractal Dimension Behind the Average
The idea comes from John Ehlers. The fractal dimension of a price path is a number between 1 and 2: a perfectly straight line has dimension 1, and a path so jagged that it fills a two-dimensional area has dimension 2. Real price sits somewhere in between, and where it sits tells you whether you are in a trend or in noise.
It is estimated with three range measurements over a window of N bars:
N3 = (highest high over N   - lowest low over N)   / N          the whole window
N1 = (highest high over N/2 - lowest low over N/2) / (N/2)      the recent half
N2 = the same measurement over the older half
D  = ( log(N1 + N2) - log(N3) ) / log(2)
The logic is easier to see than to write. If the two halves together travel exactly as much ground as the whole window, price went one way and never came back: N1 + N2 is close to N3, the logarithms nearly cancel, and D approaches 1. If each half covers almost as much range as the entire window, price went up and came back down: N1 + N2 is close to 2 * N3, and D approaches 2.
That dimension is then mapped onto the smoothing constant of an exponential average:
alpha = exp( -4.6 * (D - 1) ) clamped to [0.01, 1]
The constant -4.6 is Ehlers’ own, chosen so that D = 1 gives alpha = 1 — no smoothing at all, the average equals the source — and D = 2 gives alpha = 0.01, which is roughly a 200-period exponential average. Everything in between is interpolated exponentially, so the response collapses quickly once the path starts to look rough. The source is the bar midpoint (high + low) / 2.
One detail that matters more than it looks: the adaptive value is then smoothed by a 5-period simple average, and that smoothed value is what feeds back into the next bar’s recursion. It is not a smoothing layer bolted on top of a finished average; it sits inside the loop. The practical effect is a noticeably cleaner line, at the cost of a couple of bars of lag when the market flips from range to trend.
The Channel and the Three-State Momentum
The bands are placed at a fixed multiple of a volatility unit, and the unit chosen here is worth a comment:
volatility = 200-period average of (high - low)
upper = FRAMA + 1.5 * volatility
lower = FRAMA - 1.5 * volatility
This is the mean bar range over the last 200 bars — not a standard deviation, and not an average true range. Two consequences follow. First, the channel width ignores gaps, because high - low does not see the distance from the previous close. Second, and more important, the width is deliberately slow: with a 200-bar window it barely reacts to a single volatile session, so the bands stay put and let price come to them. A channel built on a 14-period ATR would widen underneath a breakout and swallow its own signal; this one does not.
On top of that sits a momentum state with three values, and the third one is what makes the indicator more than a breakout box:
- Bullish when the typical price
(high + low + close) / 3crosses above the upper band. - Bearish when it crosses below the lower band.
- Neutral as soon as the close crosses the central average, in either direction.
So a signal is not held until the opposite signal appears. It expires on its own the moment price returns through the middle of the channel. Read the colour as “a breakout is still in force”, not as “we are long”. The state drives the colour of the average, of the bands, of the channel fill and — if you leave colorCandles on — of the candles themselves. While the state is neutral, the central line is drawn fully transparent and disappears from the chart; only the two bands remain.
Reading the Signals
An arrow is printed only on the first breakout of each sequence: the first close above the upper band gets a mark, and any further breakouts in the same direction do not, until a breakout in the other direction resets the counter. That single detail turns a stream of arrows into one mark per swing.
Under the arrow — above it, for bearish signals — the indicator prints a number. With signalData = 0 that number is the closing price of the breakout bar, which gives you a readable record of the level each swing started from. With signalData = 1 it prints instead the 10-bar average volume, which answers a different question: was there any participation behind this break, or did price drift through the band on nothing?
That second reading is the more interesting one on liquid instruments. A breakout with average volume well below its recent norm is the classic candidate for a return inside the channel, and because the arrow is only printed once per swing, comparing the numbers across successive swings is straightforward.
Parameters
N = 26 is the fractal window. Use an even number: the dimension estimate splits the window in two halves, and an odd value leaves the oldest bar out of the older half. Smaller values make the dimension estimate noisier and the average faster; larger values stabilise the estimate but the adaptation becomes sluggish.
bandDist = 1.5 is the band distance in volatility units. Raise it to demand a larger displacement before a breakout counts, lower it for more signals.
volPeriod = 200 is the lookback of the volatility unit. Note that no band is drawn until that many bars have loaded.
signalData picks what the labels print: 0 for the closing price, 1 for the 10-bar average volume.
showLabels and colorCandles turn the arrows and the candle colouring on and off.
The three colours are declared as plain RGB triplets at the top of the code, one component per line, so they are easy to change.
Code
//----------------------------------------------
//PRC_FRAMA Channel by BigBeluga
//version = 0
//27.07.26
//Ivan Gonzalez @ www.prorealcode.com
//Sharing ProRealTime knowledge
//----------------------------------------------
// === PARAMETERS ===
//----------------------------------------------
N            = 26    // FRAMA length (use an EVEN value, minimum 2)
bandDist     = 1.5   // band distance (multiple of the volatility unit)
volPeriod    = 200   // lookback of the high-low range average
signalData   = 0     // 0 = closing price on the label, 1 = 10-bar average volume
showLabels   = 1     // 1 = arrows on breakouts
colorCandles = 1     // 1 = repaint candles with the momentum colour
//----------------------------------------------
// === COLOURS (RGB + alpha, 0=transparent 255=opaque) ===
//----------------------------------------------
upR = 39     // bullish momentum
upG = 226
upB = 123
dnR = 39     // bearish momentum
dnG = 114
dnB = 226
nuR = 162    // neutral
nuG = 181
nuB = 202
//----------------------------------------------
// === FRACTAL DIMENSION ===
//----------------------------------------------
srcHL = (high + low) / 2
half  = max(1, floor(N / 2))
warm  = max(N, 5)


n3 = (highest[N](high) - lowest[N](low)) / N
n1 = (highest[half](high) - lowest[half](low)) / half
n2 = (highest[half](high)[half] - lowest[half](low)[half]) / half


dimen = 0
if n1 > 0 and n2 > 0 and n3 > 0 then
    dimen = (log(n1 + n2) - log(n3)) / log(2)
endif


alph = exp(-4.6 * (dimen - 1))
alph = max(min(alph, 1), 0.01)
//----------------------------------------------
// === ADAPTIVE FILTER + 5-BAR SMOOTHING ===
// rawf feeds back the ALREADY smoothed filt of the previous bar
//----------------------------------------------
if barindex <= warm then
    rawf = srcHL
    filt = srcHL
else
    rawf = alph * srcHL + (1 - alph) * filt[1]
    filt = (rawf + rawf[1] + rawf[2] + rawf[3] + rawf[4]) / 5
endif
//----------------------------------------------
// === BANDS ===
//----------------------------------------------
volat  = average[volPeriod](high - low)
bandUp = filt + volat * bandDist
bandDn = filt - volat * bandDist
//----------------------------------------------
// === BREAKOUTS AND MOMENTUM STATE ===
//----------------------------------------------
src3 = (high + low + close) / 3


breakUp = 0
breakDn = 0
if src3 crosses over bandUp then
    breakUp = 1
endif
if src3 crosses under bandDn then
    breakDn = 1
endif


if barindex <= warm then
    trendState = 0
else
    trendState = trendState[1]
    if (close crosses over filt) or (close crosses under filt) then
        trendState = 0
    endif
    if breakUp = 1 then
        trendState = 1
    endif
    if breakDn = 1 then
        trendState = -1
    endif
endif


if trendState = 1 then
    cr = upR
    cg = upG
    cb = upB
elsif trendState = -1 then
    cr = dnR
    cg = dnG
    cb = dnB
else
    cr = nuR
    cg = nuG
    cb = nuB
endif


// the central line is hidden while the state is neutral
if trendState = 0 then
    aMid = 0
else
    aMid = 130
endif


if colorCandles = 1 then
    aFill = 25
else
    aFill = 50
endif
//----------------------------------------------
// === COUNTERS: only the FIRST breakout of each sequence ===
//----------------------------------------------
if barindex <= warm then
    cntUp = 0
    cntDn = 0
else
    cntUp = cntUp[1]
    cntDn = cntDn[1]
    if breakUp = 1 then
        cntDn = 0
        cntUp = cntUp + 1
    endif
    if breakDn = 1 then
        cntUp = 0
        cntDn = cntDn + 1
    endif
endif
//----------------------------------------------
// === LABELS ===
//----------------------------------------------
if signalData = 1 then
    pv = round(average[10](volume))
else
    pv = round(close * 100) / 100
endif


offs = volat * 0.4


if showLabels = 1 and breakUp = 1 and cntUp = 1 then
    drawtext("▲", barindex, bandDn - offs, SansSerif, Bold, 11) coloured(upR, upG, upB, 255)
    drawtext("#pv#", barindex, bandDn - offs * 2.2, SansSerif, Bold, 10) coloured(upR, upG, upB, 255)
endif


if showLabels = 1 and breakDn = 1 and cntDn = 1 then
    drawtext("#pv#", barindex, bandUp + offs * 2.2, SansSerif, Bold, 10) coloured(dnR, dnG, dnB, 255)
    drawtext("▼", barindex, bandUp + offs, SansSerif, Bold, 11) coloured(dnR, dnG, dnB, 255)
endif
//----------------------------------------------
// === CANDLES AND FILL ===
//----------------------------------------------
if colorCandles = 1 then
    drawcandle(open, high, low, close) coloured(cr, cg, cb)
endif


colorbetween(bandUp, bandDn, cr, cg, cb, aFill)
//----------------------------------------------
return filt coloured(cr, cg, cb, aMid) style(line, 2) as "FRAMA", bandUp coloured(cr, cg, cb, 205) as "Upper band", bandDn coloured(cr, cg, cb, 205) as "Lower band"