

Breakout Probability
Most breakout tools tell you when a breakout happens. Breakout Probability, by Zeiierman, asks a quieter and more useful question: given everything this instrument has done before, how often does price actually push beyond the previous bar’s range by a given amount? It turns that historical frequency into a grid of horizontal levels projected above and below the last candle, each one labelled with its own empirical probability.
The clever part is the conditioning. The indicator does not pool all bars together. It keeps two separate populations depending on whether the previous candle was bullish or bearish, and reports the odds for the population that matches the current setup. So what you read is not “price extends 1% about 60% of the time” but “after a green candle, price has exceeded the prior high by 1% about 60% of the time on this instrument and timeframe”.
Theory Behind the Indicator
The question it answers
For every bar, the indicator checks two things against the previous bar:
did the high reach   high[1] + x   ?      (upside extension)
did the low reach    low[1]  - x   ?      (downside extension)
for a ladder of distances x = 0, 1·step, 2·step, 3·step, 4·step. The step is a fixed percentage of price:
step = close[1] * (perc / 100)
With the default perc = 1.0, the five rungs sit at 0%, 1%, 2%, 3% and 4% beyond the previous bar’s high (and symmetrically below its low).
Conditioning on the previous candle
Before counting anything, each bar is tagged by the colour of the previous candle:
green = close[1] > open[1]
red   = close[1] < open[1]
Two independent tallies are maintained — one for bars that followed a green candle, one for bars that followed a red candle — each with its own denominator (totalGreenCandles, totalRedCandles). This is what lets the indicator show different odds depending on the immediate context instead of a single blended average.
From counts to probabilities
For each of the five rungs and each population, the indicator increments a counter every time the extension actually occurred, then divides by the size of that population:
P(up, level i | green) = (# times high >= high[1] + i·step after a green candle) / totalGreenCandles
The result is a pure empirical frequency over the whole loaded history. Near rungs (level 0, level 1) carry high probabilities — price almost always clears the previous high by something. Far rungs (level 4) carry low ones — a 4% extension in a single bar is rare. The shape of that decay is the real information: an instrument whose probabilities stay high out to level 3 or 4 is one that tends to make large directional bars.
Projecting the grid
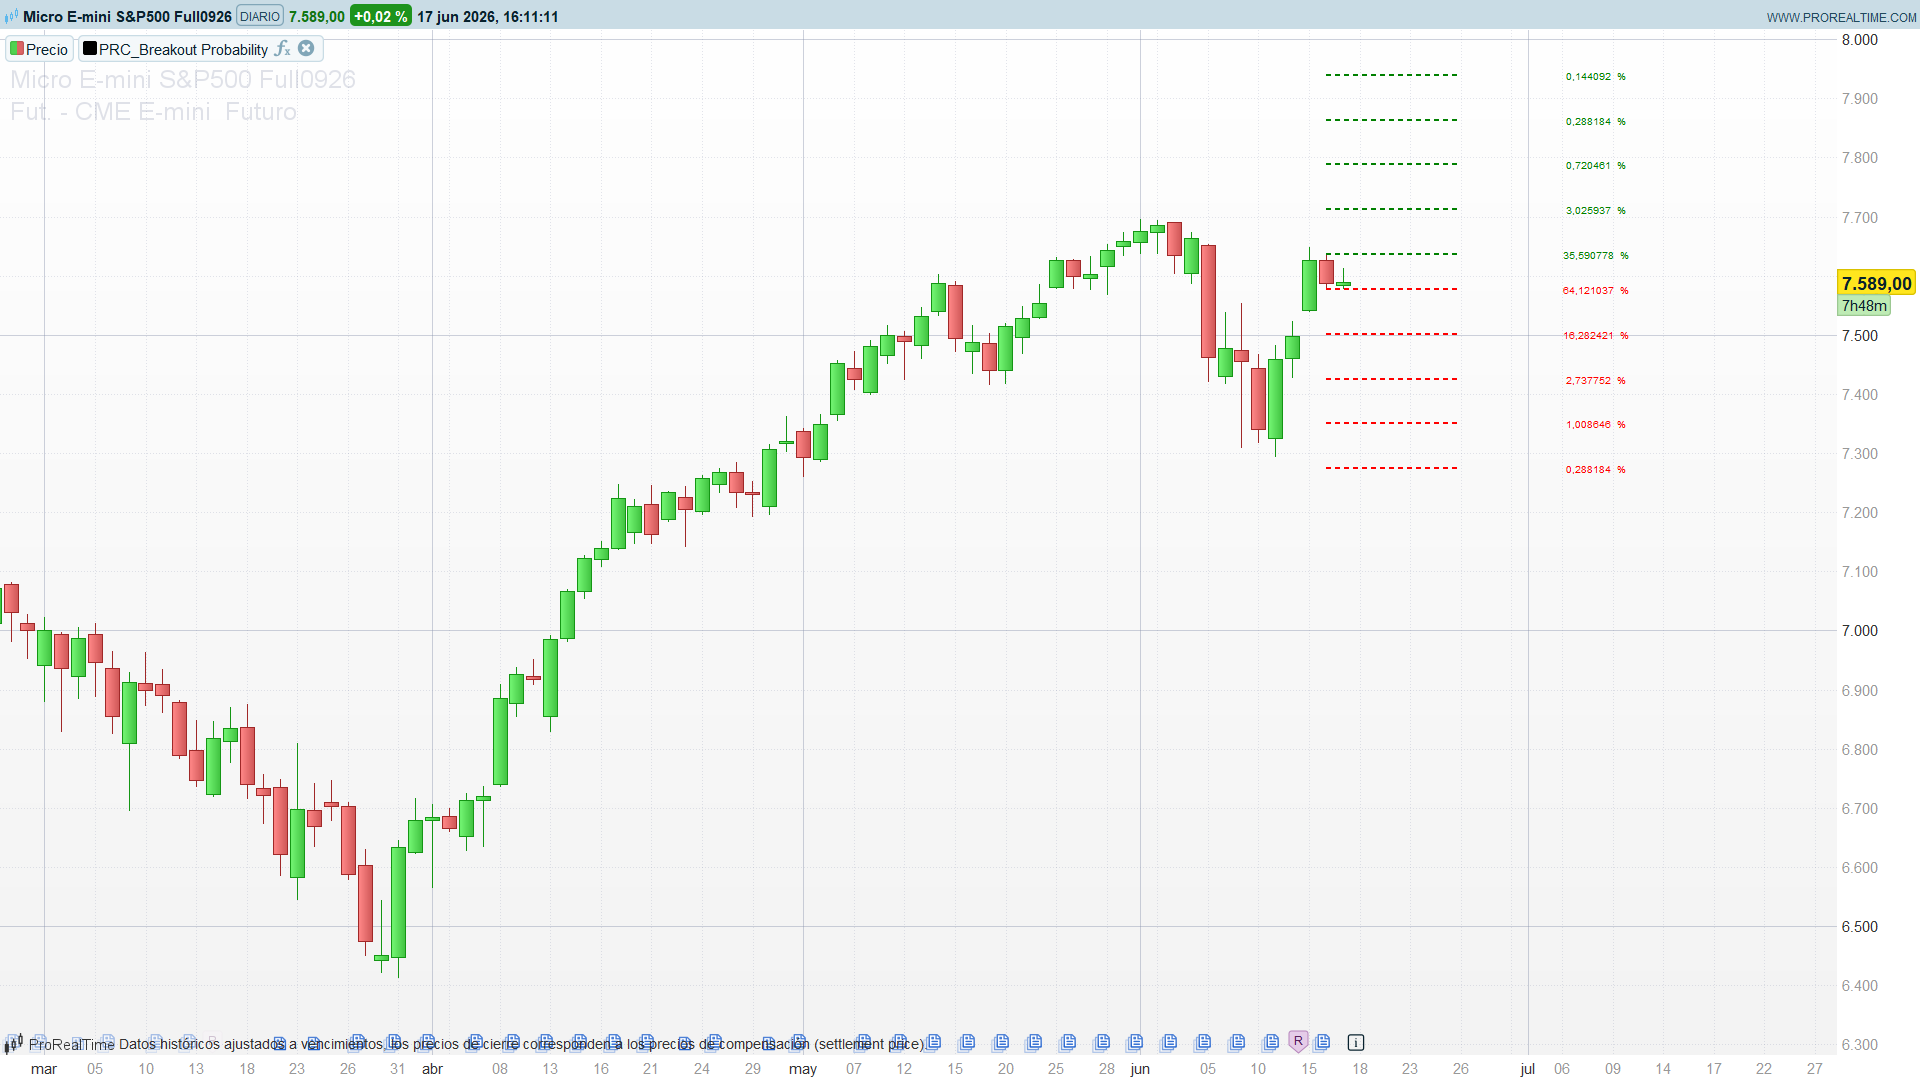
On the last bar, the indicator draws the ladder anchored to the previous bar’s extremes and labels each line with the probability that matches the current previous-candle colour:
hiLevel = high[1] + step * i      (green line, upside odds)
loLevel = low[1]  - step * i      (red line,  downside odds)
hideZero = 1 suppresses any rung whose probability is still zero (typically the far rungs early in the history, before enough samples have accumulated).
How to Read the Indicator
- Green lines above price are the projected upside extensions, red lines below the downside ones. The number on each is the historical frequency of reaching that level, conditioned on the colour of the last candle.
- Read the ladder as a decay curve, not as a target. The interesting question is how fast the percentage drops from rung to rung. A slow decay means this instrument routinely makes large bars; a fast decay means range extension is unusual.
- The closest rung with a meaningful probability is the realistic objective. A 65% level is a sensible take-profit reference; the 8% level at the top is a tail event, not a plan.
- Compare the up-ladder against the down-ladder. A clear asymmetry (upside odds consistently higher than downside at the same rung) is a directional bias baked into the recent behaviour after that candle colour.
- Treat it as descriptive statistics, not a forecast. The numbers are unconditional historical frequencies over the loaded data; they describe what has happened, and are only as reliable as the sample is large and the regime stable.
Practical Applications
- Realistic intraday targets. Instead of a fixed take-profit, use the rung whose probability sits in a comfortable band (say 50–70%) as a data-driven objective for the current bar.
- Stop and target placement. The downside ladder gives an empirical sense of how far an adverse extension typically runs after the current candle colour — useful context for where a tight stop is likely to be clipped by noise.
- Confidence-weighted sizing. When the near rungs show a strong up/down asymmetry, the dominant side has historically extended more often; size can lean accordingly.
- Volatility expectation per bar. The width of the ladder (driven by
percand by how far non-zero probabilities reach) is a compact read on the instrument’s typical single-bar range.
Indicator Configuration
perc= 1.0: percentage distance between rungs. Lower it for low-volatility instruments or low timeframes so the ladder spans a realistic single-bar range; raise it for volatile assets.nbr= 5: number of levels displayed, capped at 5.hideZero= 1: hide rungs whose probability is still 0 (set to 0 to always show all five).
Code
//----------------------------------------------
//PRC_Breakout Probability (Expo)
//version = 1
//17.06.26
//Iván González @ www.prorealcode.com
//Translated from "Breakout Probability (Expo)" (PineScript v5)
//Original author: Zeiierman
//Sharing ProRealTime knowledge
//----------------------------------------------
defparam drawonlastbaronly = true
//----------------------------------------------
// === Inputs ===
perc = 1.0      // percentage step between levels
nbr = 5         // number of lines to display (max 5)
hideZero = 1    // 1 = hide levels with 0% probability, 0 = show all
//----------------------------------------------
// === Persistent counters (accumulators, seeded once) ===
//----------------------------------------------
once totalGreenCandles = 0
once totalRedCandles = 0

once $total0[3] = 0
once $total1[3] = 0
once $total2[3] = 0
once $total3[3] = 0
once $total4[3] = 0

once $vals0[3] = 0.0
once $vals1[3] = 0.0
once $vals2[3] = 0.0
once $vals3[3] = 0.0
once $vals4[3] = 0.0
//----------------------------------------------
// === Counting logic (runs on every bar) ===
//----------------------------------------------
if barindex > 1 then
   green = close[1] > open[1]
   red = close[1] < open[1]

   if green then
      totalGreenCandles = totalGreenCandles + 1
   endif
   if red then
      totalRedCandles = totalRedCandles + 1
   endif

   step = close[1] * (perc / 100)

   // Level 0 (no step)
   x0 = 0
   hh0 = high >= high[1] + x0
   ll0 = low <= low[1] - x0
   if green and hh0 then
      $total0[0] = $total0[0] + 1
   endif
   if green and ll0 then
      $total0[1] = $total0[1] + 1
   endif
   if red and hh0 then
      $total0[2] = $total0[2] + 1
   endif
   if red and ll0 then
      $total0[3] = $total0[3] + 1
   endif

   // Level 1
   x1 = step
   hh1 = high >= high[1] + x1
   ll1 = low <= low[1] - x1
   if green and hh1 then
      $total1[0] = $total1[0] + 1
   endif
   if green and ll1 then
      $total1[1] = $total1[1] + 1
   endif
   if red and hh1 then
      $total1[2] = $total1[2] + 1
   endif
   if red and ll1 then
      $total1[3] = $total1[3] + 1
   endif

   // Level 2
   x2 = step * 2
   hh2 = high >= high[1] + x2
   ll2 = low <= low[1] - x2
   if green and hh2 then
      $total2[0] = $total2[0] + 1
   endif
   if green and ll2 then
      $total2[1] = $total2[1] + 1
   endif
   if red and hh2 then
      $total2[2] = $total2[2] + 1
   endif
   if red and ll2 then
      $total2[3] = $total2[3] + 1
   endif

   // Level 3
   x3 = step * 3
   hh3 = high >= high[1] + x3
   ll3 = low <= low[1] - x3
   if green and hh3 then
      $total3[0] = $total3[0] + 1
   endif
   if green and ll3 then
      $total3[1] = $total3[1] + 1
   endif
   if red and hh3 then
      $total3[2] = $total3[2] + 1
   endif
   if red and ll3 then
      $total3[3] = $total3[3] + 1
   endif

   // Level 4
   x4 = step * 4
   hh4 = high >= high[1] + x4
   ll4 = low <= low[1] - x4
   if green and hh4 then
      $total4[0] = $total4[0] + 1
   endif
   if green and ll4 then
      $total4[1] = $total4[1] + 1
   endif
   if red and hh4 then
      $total4[2] = $total4[2] + 1
   endif
   if red and ll4 then
      $total4[3] = $total4[3] + 1
   endif

   // Convert counts to probabilities (0..1) on each bar
   if totalGreenCandles > 0 then
      $vals0[0] = $total0[0] / totalGreenCandles
      $vals0[1] = $total0[1] / totalGreenCandles
      $vals1[0] = $total1[0] / totalGreenCandles
      $vals1[1] = $total1[1] / totalGreenCandles
      $vals2[0] = $total2[0] / totalGreenCandles
      $vals2[1] = $total2[1] / totalGreenCandles
      $vals3[0] = $total3[0] / totalGreenCandles
      $vals3[1] = $total3[1] / totalGreenCandles
      $vals4[0] = $total4[0] / totalGreenCandles
      $vals4[1] = $total4[1] / totalGreenCandles
   endif
   if totalRedCandles > 0 then
      $vals0[2] = $total0[2] / totalRedCandles
      $vals0[3] = $total0[3] / totalRedCandles
      $vals1[2] = $total1[2] / totalRedCandles
      $vals1[3] = $total1[3] / totalRedCandles
      $vals2[2] = $total2[2] / totalRedCandles
      $vals2[3] = $total2[3] / totalRedCandles
      $vals3[2] = $total3[2] / totalRedCandles
      $vals3[3] = $total3[3] / totalRedCandles
      $vals4[2] = $total4[2] / totalRedCandles
      $vals4[3] = $total4[3] / totalRedCandles
   endif
endif
//----------------------------------------------
// === Drawing (last bar only) ===
//----------------------------------------------
if islastbarupdate then
   for i = 0 to nbr - 1
      myProbUp = 0
      myProbDown = 0

      if green then
         if i = 0 then
            myProbUp = $vals0[0]
            myProbDown = $vals0[1]
         elsif i = 1 then
            myProbUp = $vals1[0]
            myProbDown = $vals1[1]
         elsif i = 2 then
            myProbUp = $vals2[0]
            myProbDown = $vals2[1]
         elsif i = 3 then
            myProbUp = $vals3[0]
            myProbDown = $vals3[1]
         elsif i = 4 then
            myProbUp = $vals4[0]
            myProbDown = $vals4[1]
         endif
      else
         if i = 0 then
            myProbUp = $vals0[2]
            myProbDown = $vals0[3]
         elsif i = 1 then
            myProbUp = $vals1[2]
            myProbDown = $vals1[3]
         elsif i = 2 then
            myProbUp = $vals2[2]
            myProbDown = $vals2[3]
         elsif i = 3 then
            myProbUp = $vals3[2]
            myProbDown = $vals3[3]
         elsif i = 4 then
            myProbUp = $vals4[2]
            myProbDown = $vals4[3]
         endif
      endif

      showLevel = (hideZero = 0) or (hideZero = 1 and myProbUp > 0 and myProbDown > 0)

      if showLevel then
         hiLevel = high[1] + (step * i)
         loLevel = low[1] - (step * i)
         drawsegment(barindex[1], hiLevel, barindex+7, hiLevel) coloured(0, 180, 80) style(dottedline, 2)
         drawsegment(barindex[1], loLevel, barindex+7, loLevel) coloured(230, 45, 45) style(dottedline, 2)
         // probability shown as a percentage, rounded to 2 decimals
         probUp = round(myProbUp * 10000) / 100
         probDown = round(myProbDown * 10000) / 100
         drawtext("#probUp# %", barindex + 15, hiLevel, Dialog, Standard, 10) anchor(topleft, index, value) coloured(0, 180, 80)
         drawtext("#probDown# %", barindex + 15, loLevel, Dialog, Standard, 10) anchor(topleft, index, value) coloured(230, 45, 45)
      endif
   next
endif
//----------------------------------------------
RETURN
