







Twin Range Filter
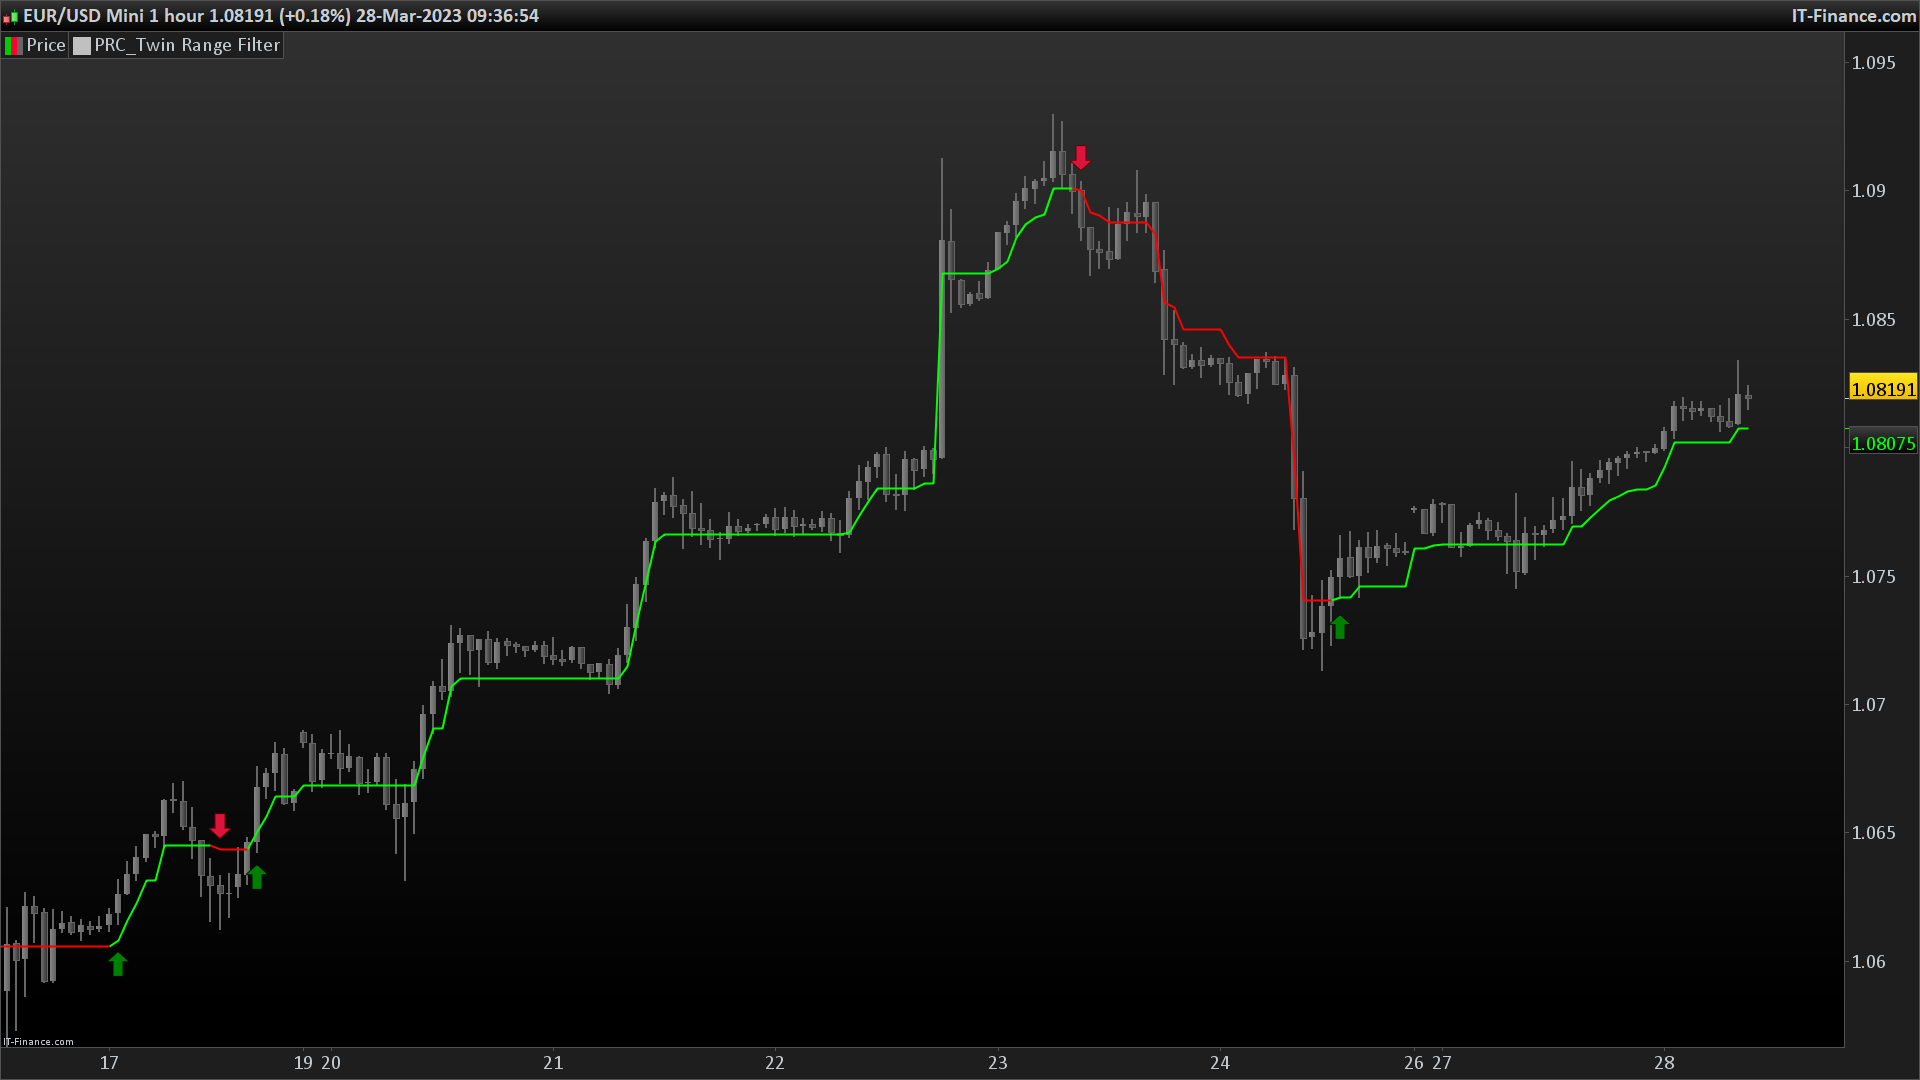
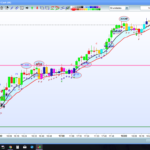
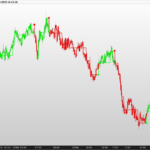
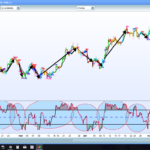
An experiment to combine two range filters and plot the average of both to smooth out the signals.
This works significantly better than the typical ATR set-up, but there’s still too much noise here to set and forget with bots. Use it as the basis of your own system with additional filtering on top.
(original description from author: colinmck)
//PRC_Twing Range Filter | indicator
//28.03.2023
//Nicolas @ www.prorealcode.com
//Sharing ProRealTime knowledge
//author: colinmck

// --- settings
per1 = 27 //"Fast period"
mult1 = 1.6 //"Fast range"
per2 = 55 //"Slow period"
mult2 = 2 //"Slow range"
// --- end of settings

source = customclose

once wper1 = per1 * 2 - 1
avrng1 = average[per1,1](abs(source - source[1]))
smrng1 = average[wper1,1](avrng1) * mult1
once wper2 = per2 * 2 - 1
avrng2 = average[per2,1](abs(source - source[1]))
smrng2 = average[wper2,1](avrng2) * mult2
smrng = (smrng1 + smrng2) / 2

r = smrng
if source>rngfilt[1] then
if (source-r)<rngfilt[1] then
rngfilt=rngfilt[1]
else
rngfilt=source-r
endif
elsif (source+r)>rngfilt[1] then
rngfilt=rngfilt[1]
else
rngfilt=source+r
endif

if rngfilt > rngfilt[1] then
upward=upward+1
downward=0
endif
if rngfilt < rngfilt[1] then
upward=0
downward=downward+1
endif

longCond = (source > rngfilt and source > source[1] and upward > 0) or (source > rngfilt and source < source[1] and upward > 0)
shortCond = (source < rngfilt and source < source[1] and downward > 0) or (source < rngfilt and source > source[1] and downward > 0)

if longcond then
colorr=0
colorg=255
elsif shortcond then
colorr=255
colorg=0
endif

if colorr=0 and colorr[1]=255 then
drawarrowup(barindex,min(low,rngfilt)-averagetruerange[14]/2) coloured("green")
endif
if colorr=255 and colorr[1]=0 then
drawarrowdown(barindex,max(high,rngfilt)+averagetruerange[14]/2) coloured("crimson")
endif

return rngfilt coloured(colorr,colorg,0) style(line,2)
Comments
You must be logged in to post a comment.


Bonjour Nicolas, en effet ca marche, je me suis trompé, j'ai bien tout le tracé. C'est parce que j'avais mis une date de début, autant pour moi ! Bonne Soirée.
Bonjour Nicolas, concernant cet indicateur j'ai voulu l'utiliser mais il commence à tracer les lignes vertes et rouges sur le graphique très tard, pourquoi ? Par exemple en backtest je met 50k pour avoir plus de bougies d'études mais il comment à tracer bien après ! Une variable à réajuster peut-être ? En te remerciant pour ta réponse et ton aide. Bonne journée.
Bonjour, qui pourrait me dire ou trouver la variable rngfilt car on ne la voit pas dans le programme ? Est-ce un appel à un autre programme ? Merci à vous.


Merci beaucoup Nicolas, Il a l'air vraiment interessant. Je vais le tester ;-)
Utilitaire vraiment top, d'autant qu'ajouter des filtres de seuil peux aider a limiter le nombre d'entrées sorties visuelles. ça marche sur tous les indices testés...Par contre (comme je suis toujours débutant pour la partie codage) je cherche a voir si il est possible d'attribuer une valeur au déclenchement de la flèche (up ou down) pour en déduire un signal achat ou vente. Je cherche le moyen de convertir la création de flèche en signal ( lignes 57 à 61 du code) ...Merci pour le coup de main ( et merci Nicolas pour le partage)