Trend Line Methods
Introduction
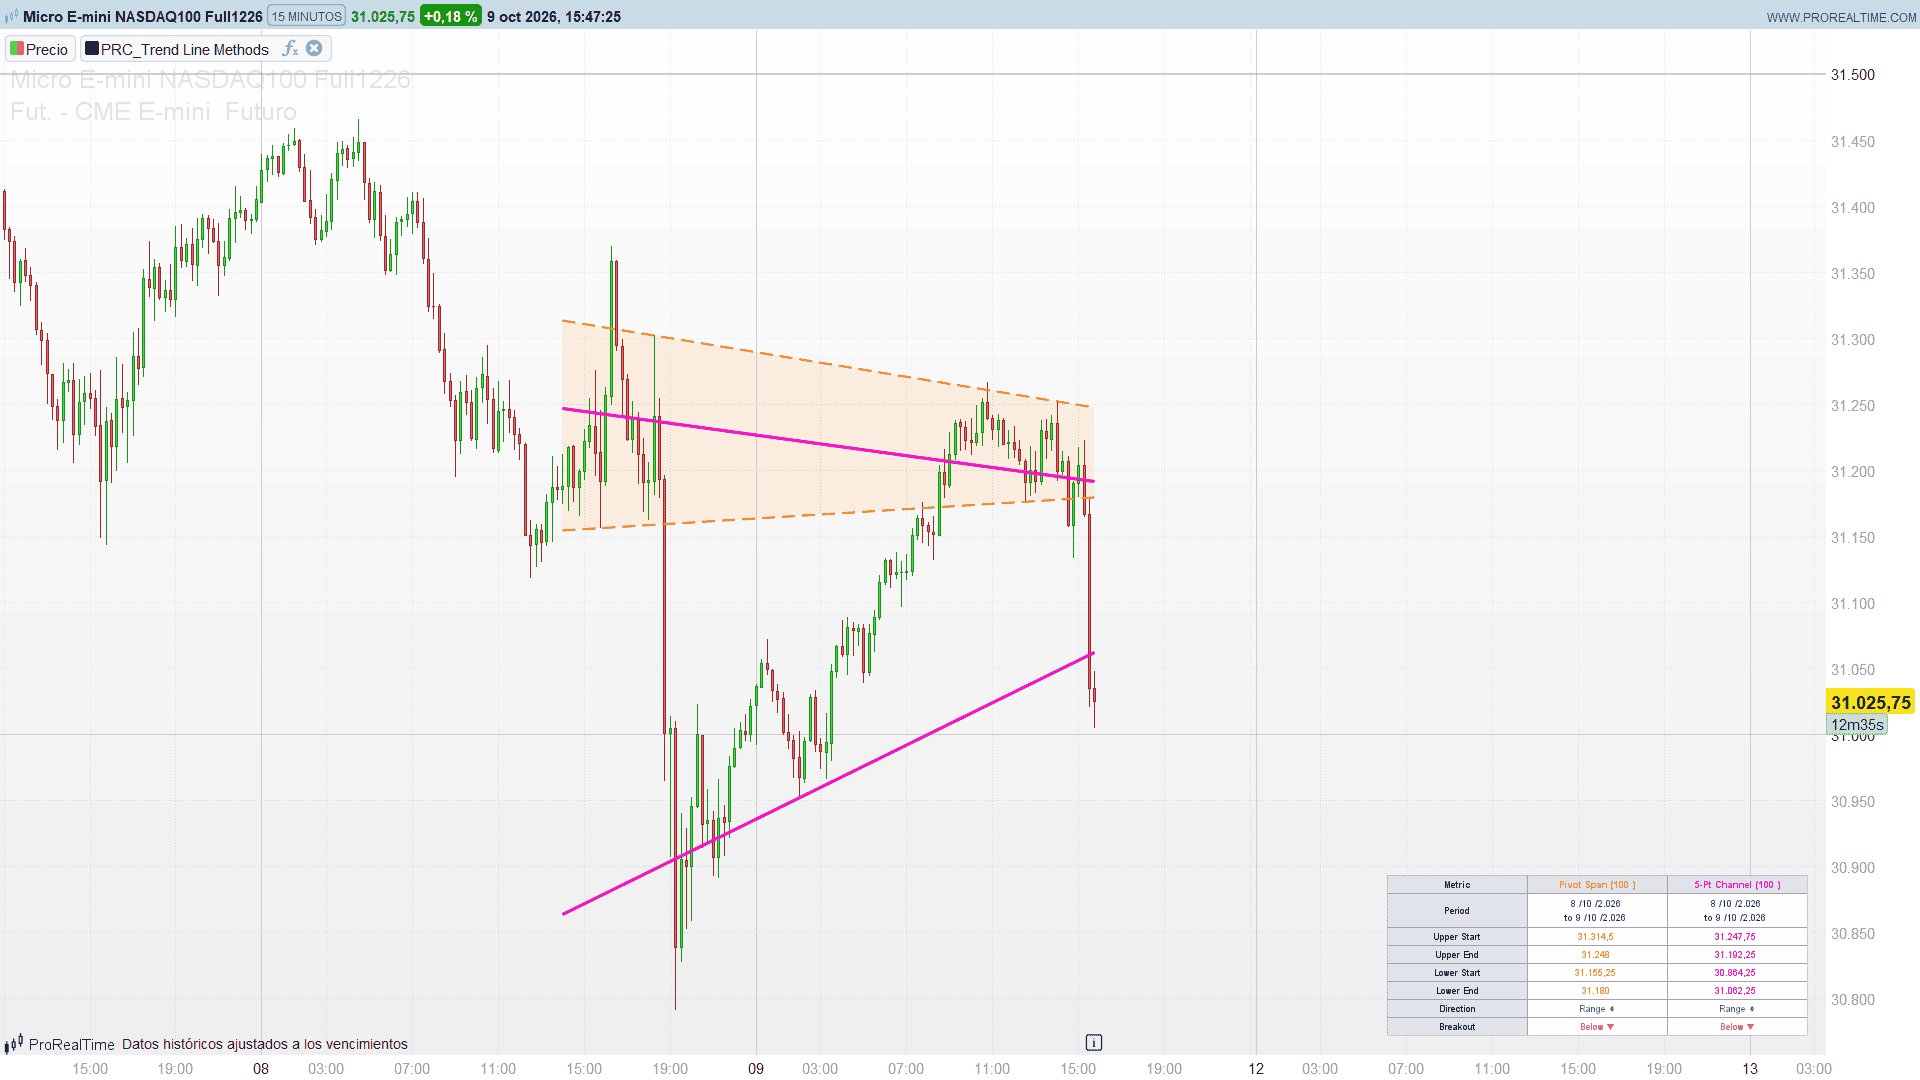
Drawing trend lines by hand is subjective: two traders looking at the same chart rarely pick the same anchor points. Trend Line Methods (TLM) draws them automatically with two different and fully objective rules, so you can compare a pivot-based view of the trend with a statistical one on the same chart.
The first method joins the oldest and the newest of the last few pivot highs, and does the same with the pivot lows. The second one splits the recent window into five segments and fits a least squares line through the five highest highs and another through the five lowest lows. A small dashboard summarises both channels: the period they cover, their start and end prices, their direction and whether the current close has broken out of them.
Theory Behind the Indicator
Method 1: Pivot Span Trendline
A pivot high is a bar whose high is strictly above the highs of the pivL bars on its left and the pivR bars on its right; a pivot low is the mirror image with lows. The indicator keeps the last pivCount pivot highs and pivot lows (5 by default). The upper line goes through the oldest and the most recent of the stored pivot highs, the lower line through the oldest and the most recent pivot lows. Both lines are extended across the last lenPS bars and the area between them is shaded.
Because the line uses the oldest stored pivot as its far anchor, the number of pivots acts as a smoothing control: with more pivots the line spans a longer stretch of the market structure and reacts less to the latest swing.
Method 2: 5-Point Straight Channel
The last len5P bars are split into five segments of equal length (the last one takes any remainder). In each segment the indicator takes the highest high and the lowest low, which gives five anchor points at the top and five at the bottom. It then fits an ordinary least squares line through the five highs and another through the five lows. The result is a straight channel that represents the whole window instead of depending on two individual swings.
Direction and breakout
For each channel the midline is the average of the upper and lower lines. Its change from the first to the last bar of the channel, in percent of the starting value, classifies the channel:
- above +threshold: Bullish,
- below -threshold: Bearish,
- in between: Range.
The breakout status compares the current close with the upper and lower lines at the last bar: Above, Below or Inside.
Key Features at a Glance
- Two independent trendline methods, each one can be switched on or off.
- Pivot span channel built from the oldest and newest of the last N pivots, with a shaded area.
- Five-point least squares channel built from segment extremes.
- Solid, dashed or dotted line styles for each method.
- Dashboard with period, start and end prices, direction and breakout status of both channels.
- Everything is recalculated on the last bar, so the lines always reflect the latest data.
How to Read the Indicator
- Compare the two channels. When both point in the same direction, the trend is clear from both the swing structure and the overall distribution of extremes. When they disagree, the market is often in transition.
- Pivot span channel. It follows the market structure: rising highs and rising lows give a rising channel. A new pivot can change its slope noticeably, so it reacts faster to a change in structure.
- 5-point channel. It is steadier because it averages five points. A close outside it is a more significant event than a close outside the pivot span channel.
- Dashboard. Direction tells you the slope of the channel midline over its period; Breakout tells you where the current close sits. “Bullish” with “Above” is a strong upside breakout of a rising channel; “Range” with “Inside” is consolidation.
Practical Applications
- Trend filter. Trade only in the direction reported by the 5-point channel, and use the pivot span channel to time entries near its lower or upper line.
- Breakout watch. A change of the breakout status from Inside to Above or Below on both channels is a stronger signal than a break of only one of them.
- Support and resistance projection. The lines are extended to the last bar, so their end prices in the dashboard give you the current level of each trendline.
Indicator Configuration
Pivot Span Trendline:
- enablePS (default: 1): 1 shows the pivot span lines and their fill.
- pivL (default: 5): bars on the left of a pivot.
- pivR (default: 5): bars on the right of a pivot (confirmation delay).
- pivCount (default: 5): number of pivots tracked; the line joins the oldest and the newest.
- lenPS (default: 100): number of bars over which the lines are drawn.
- psStyle (default: 1): 0 = solid, 1 = dashed, 2 = dotted.
- psHiR/G/B, psLoR/G/B: colours of the upper and lower lines.
- psFillR/G/B, psFillA: colour and opacity of the fill between the lines.
5-Point Straight Channel:
- enable5P (default: 1): 1 shows the 5-point channel.
- len5P (default: 100): channel length in bars.
- c5Style (default: 0): 0 = solid, 1 = dashed, 2 = dotted.
- c5HiR/G/B, c5LoR/G/B: colours of the upper and lower channel lines.
Dashboard:
- dashOn (default: 1): 1 shows the dashboard.
- dashThreshold (default: 0.5): threshold in percent for the direction classification.
- dashX (default: -160): horizontal position of the right column, in pixels from the right edge.
- dashY (default: 20): bottom of the panel, in pixels from the bottom edge.
- dashCol (default: 140): column width in pixels.
Code
//---------------------------------------------------------------
// PRC_Trend Line Methods
// version = 0
// 09.10.2026
// Iván González @ www.prorealcode.com
// Author: ata_sabanci
// Sharing ProRealTime knowledge
//--------------------------------------------------------------------//
defparam drawonlastbaronly = true
//--------------------------------------------------------------------//
// Method 1: Pivot Span Trendline
//--------------------------------------------------------------------//
enablePS = 1          // 1 = show the pivot span trendlines
pivL = 5              // pivot left bars
pivR = 5              // pivot right bars
pivCount = 5          // number of pivots tracked (the line joins the oldest and the newest)
lenPS = 100           // lookback length: the lines are drawn over the last lenPS bars
psStyle = 1           // line style: 0 = solid, 1 = dashed, 2 = dotted (thickness 2)
psHiR = 255           // high trend line colour
psHiG = 123
psHiB = 0
psLoR = 255           // low trend line colour
psLoG = 123
psLoB = 0
psFillR = 255         // fill between the lines (90% transparent)
psFillG = 123
psFillB = 0
psFillA = 26
//--------------------------------------------------------------------//
// Method 2: 5-Point Straight Channel
//--------------------------------------------------------------------//
enable5P = 1          // 1 = show the 5-point channel
len5P = 100           // channel length in bars
c5Style = 0           // line style: 0 = solid, 1 = dashed, 2 = dotted (thickness 3)
c5HiR = 255           // upper channel line colour
c5HiG = 0
c5HiB = 208
c5LoR = 255           // lower channel line colour
c5LoG = 0
c5LoB = 208
//--------------------------------------------------------------------//
// Dashboard
//--------------------------------------------------------------------//
dashOn = 1            // 1 = show the channel analytics dashboard
dashThreshold = 0.5   // direction threshold (%) on the midline change
dashX = -160          // x of the right column centre, pixels from the right edge
dashY = 20            // bottom of the panel, pixels from the bottom edge
dashCol = 140         // column width in pixels
//--------------------------------------------------------------------//
// Rolling extremes used by the pivot scan
//--------------------------------------------------------------------//
hhL = highest[pivL](high)
llL = lowest[pivL](low)
hhR = highest[pivR](high)
llR = lowest[pivR](low)
//--------------------------------------------------------------------//
// Everything is computed and drawn on the last bar
//--------------------------------------------------------------------//
IF islastbarupdate THEN
   bIdx = barindex
   //==================== METHOD 1: PIVOT SPAN ====================
   m1HasHi = 0
   m1HasLo = 0
   IF enablePS = 1 THEN
      // Pivots are searched backwards from the newest confirmed one (pivR bars ago).
      // A pivot high is strictly above the pivL bars on its left and the pivR bars
      // on its right. The newest found is the near point; the pivCount-th is the far one.
      nHi = 0
      nLo = 0
      oMax = bIdx - pivL
      IF oMax >= pivR THEN
         FOR o = pivR TO oMax DO
            IF pivCount > nHi THEN
               IF high[o] > hhL[o + 1] AND high[o] > hhR[o - pivR] THEN
                  nHi = nHi + 1
                  IF nHi = 1 THEN
                     nearHiX = bIdx - o
                     nearHiY = high[o]
                  ENDIF
                  farHiX = bIdx - o
                  farHiY = high[o]
               ENDIF
            ENDIF
            IF pivCount > nLo THEN
               IF llL[o + 1] > low[o] AND llR[o - pivR] > low[o] THEN
                  nLo = nLo + 1
                  IF nLo = 1 THEN
                     nearLoX = bIdx - o
                     nearLoY = low[o]
                  ENDIF
                  farLoX = bIdx - o
                  farLoY = low[o]
               ENDIF
            ENDIF
            IF nHi >= pivCount AND nLo >= pivCount THEN
               BREAK
            ENDIF
         NEXT
      ENDIF
      x1PS = bIdx - (lenPS - 1)
      x2PS = bIdx
      IF nHi >= 2 THEN
         m1HasHi = 1
         hiSlp = 0
         IF nearHiX <> farHiX THEN
            hiSlp = (nearHiY - farHiY) / (nearHiX - farHiX)
         ENDIF
         hiIcp = farHiY - hiSlp * farHiX
         m1Y1Hi = hiIcp + hiSlp * x1PS
         m1Y2Hi = hiIcp + hiSlp * x2PS
         IF psStyle = 0 THEN
            DRAWSEGMENT(x1PS, m1Y1Hi, x2PS, m1Y2Hi) COLOURED(psHiR, psHiG, psHiB, 255) STYLE(line, 2)
         ELSIF psStyle = 2 THEN
            DRAWSEGMENT(x1PS, m1Y1Hi, x2PS, m1Y2Hi) COLOURED(psHiR, psHiG, psHiB, 255) STYLE(dottedline, 2)
         ELSE
            DRAWSEGMENT(x1PS, m1Y1Hi, x2PS, m1Y2Hi) COLOURED(psHiR, psHiG, psHiB, 255) STYLE(dottedline2, 2)
         ENDIF
      ENDIF
      IF nLo >= 2 THEN
         m1HasLo = 1
         loSlp = 0
         IF nearLoX <> farLoX THEN
            loSlp = (nearLoY - farLoY) / (nearLoX - farLoX)
         ENDIF
         loIcp = farLoY - loSlp * farLoX
         m1Y1Lo = loIcp + loSlp * x1PS
         m1Y2Lo = loIcp + loSlp * x2PS
         IF psStyle = 0 THEN
            DRAWSEGMENT(x1PS, m1Y1Lo, x2PS, m1Y2Lo) COLOURED(psLoR, psLoG, psLoB, 255) STYLE(line, 2)
         ELSIF psStyle = 2 THEN
            DRAWSEGMENT(x1PS, m1Y1Lo, x2PS, m1Y2Lo) COLOURED(psLoR, psLoG, psLoB, 255) STYLE(dottedline, 2)
         ELSE
            DRAWSEGMENT(x1PS, m1Y1Lo, x2PS, m1Y2Lo) COLOURED(psLoR, psLoG, psLoB, 255) STYLE(dottedline2, 2)
         ENDIF
      ENDIF
      // fill between the two lines: the quadrilateral split into two triangles
      IF m1HasHi = 1 AND m1HasLo = 1 THEN
         DRAWTRIANGLE(x1PS, m1Y1Hi, x2PS, m1Y2Hi, x2PS, m1Y2Lo) COLOURED(psFillR, psFillG, psFillB, 0) FILLCOLOR(psFillR, psFillG, psFillB, psFillA)
         DRAWTRIANGLE(x1PS, m1Y1Hi, x2PS, m1Y2Lo, x1PS, m1Y1Lo) COLOURED(psFillR, psFillG, psFillB, 0) FILLCOLOR(psFillR, psFillG, psFillB, psFillA)
      ENDIF
   ENDIF
   //==================== METHOD 2: 5-POINT CHANNEL ====================
   m2HasHi = 0
   m2HasLo = 0
   IF enable5P = 1 AND bIdx >= len5P THEN
      sxH = 0
      syH = 0
      sxyH = 0
      sx2H = 0
      nH5 = 0
      sxL = 0
      syL = 0
      sxyL = 0
      sx2L = 0
      nL5 = 0
      segBase = max(1, floor(len5P / 5))
      FOR k = 0 TO 4 DO
         segStart = k * segBase
         remain = len5P - segStart
         IF 0 >= remain THEN
            BREAK
         ENDIF
         IF 4 > k THEN
            segLen = min(segBase, remain)
         ELSE
            segLen = remain
         ENDIF
         // highest high and lowest low of the segment (first occurrence from the newest bar)
         maxHi = high[segStart]
         agoHi = segStart
         minLo = low[segStart]
         agoLo = segStart
         FOR i = 1 TO segLen - 1 DO
            sh = segStart + i
            IF high[sh] > maxHi THEN
               maxHi = high[sh]
               agoHi = sh
            ENDIF
            IF minLo > low[sh] THEN
               minLo = low[sh]
               agoLo = sh
            ENDIF
         NEXT
         xH = bIdx - agoHi
         sxH = sxH + xH
         syH = syH + maxHi
         sxyH = sxyH + xH * maxHi
         sx2H = sx2H + xH * xH
         nH5 = nH5 + 1
         xL = bIdx - agoLo
         sxL = sxL + xL
         syL = syL + minLo
         sxyL = sxyL + xL * minLo
         sx2L = sx2L + xL * xL
         nL5 = nL5 + 1
      NEXT
      x15 = bIdx - len5P + 1
      x25 = bIdx
      // least squares line through the five highs
      IF nH5 >= 2 THEN
         m2HasHi = 1
         denH = nH5 * sx2H - sxH * sxH
         slpH5 = 0
         IF denH <> 0 THEN
            slpH5 = (nH5 * sxyH - sxH * syH) / denH
         ENDIF
         icpH5 = (syH - slpH5 * sxH) / nH5
         m2Y1Hi = slpH5 * x15 + icpH5
         m2Y2Hi = slpH5 * x25 + icpH5
         IF c5Style = 0 THEN
            DRAWSEGMENT(x15, m2Y1Hi, x25, m2Y2Hi) COLOURED(c5HiR, c5HiG, c5HiB, 255) STYLE(line, 3)
         ELSIF c5Style = 2 THEN
            DRAWSEGMENT(x15, m2Y1Hi, x25, m2Y2Hi) COLOURED(c5HiR, c5HiG, c5HiB, 255) STYLE(dottedline, 3)
         ELSE
            DRAWSEGMENT(x15, m2Y1Hi, x25, m2Y2Hi) COLOURED(c5HiR, c5HiG, c5HiB, 255) STYLE(dottedline2, 3)
         ENDIF
      ENDIF
      // least squares line through the five lows
      IF nL5 >= 2 THEN
         m2HasLo = 1
         denL = nL5 * sx2L - sxL * sxL
         slpL5 = 0
         IF denL <> 0 THEN
            slpL5 = (nL5 * sxyL - sxL * syL) / denL
         ENDIF
         icpL5 = (syL - slpL5 * sxL) / nL5
         m2Y1Lo = slpL5 * x15 + icpL5
         m2Y2Lo = slpL5 * x25 + icpL5
         IF c5Style = 0 THEN
            DRAWSEGMENT(x15, m2Y1Lo, x25, m2Y2Lo) COLOURED(c5LoR, c5LoG, c5LoB, 255) STYLE(line, 3)
         ELSIF c5Style = 2 THEN
            DRAWSEGMENT(x15, m2Y1Lo, x25, m2Y2Lo) COLOURED(c5LoR, c5LoG, c5LoB, 255) STYLE(dottedline, 3)
         ELSE
            DRAWSEGMENT(x15, m2Y1Lo, x25, m2Y2Lo) COLOURED(c5LoR, c5LoG, c5LoB, 255) STYLE(dottedline2, 3)
         ENDIF
      ENDIF
   ENDIF
   //==================== DASHBOARD ====================
   IF dashOn = 1 THEN
      m1On = 0
      IF m1HasHi = 1 AND m1HasLo = 1 THEN
         m1On = 1
      ENDIF
      m2On = 0
      IF m2HasHi = 1 AND m2HasLo = 1 THEN
         m2On = 1
      ENDIF
      // row edges (pixels from the bottom edge): header, period (two text lines), six data rows
      yTop = dashY + 160
      $rT[0] = yTop
      $rB[0] = yTop - 18
      $rT[1] = yTop - 18
      $rB[1] = yTop - 52
      FOR r = 2 TO 7 DO
         $rT[r] = yTop - 52 - (r - 2) * 18
         $rB[r] = $rT[r] - 18
      NEXT
      c2X = dashX
      c1X = dashX - dashCol
      c0X = dashX - 2 * dashCol
      hw = dashCol / 2
      // cells: header row and label column on the header colour, data cells on the cell colour
      FOR r = 0 TO 7 DO
         DRAWRECTANGLE(c0X - hw, $rT[r], c0X + hw, $rB[r]) ANCHOR(BOTTOMRIGHT, XSHIFT, YSHIFT) COLOURED(54, 58, 69, 64) FILLCOLOR(225, 228, 235, 255)
         IF r = 0 THEN
            DRAWRECTANGLE(c1X - hw, $rT[r], c1X + hw, $rB[r]) ANCHOR(BOTTOMRIGHT, XSHIFT, YSHIFT) COLOURED(54, 58, 69, 64) FILLCOLOR(225, 228, 235, 255)
            DRAWRECTANGLE(c2X - hw, $rT[r], c2X + hw, $rB[r]) ANCHOR(BOTTOMRIGHT, XSHIFT, YSHIFT) COLOURED(54, 58, 69, 64) FILLCOLOR(225, 228, 235, 255)
         ELSE
            DRAWRECTANGLE(c1X - hw, $rT[r], c1X + hw, $rB[r]) ANCHOR(BOTTOMRIGHT, XSHIFT, YSHIFT) COLOURED(54, 58, 69, 64) FILLCOLOR(255, 255, 255, 230)
            DRAWRECTANGLE(c2X - hw, $rT[r], c2X + hw, $rB[r]) ANCHOR(BOTTOMRIGHT, XSHIFT, YSHIFT) COLOURED(54, 58, 69, 64) FILLCOLOR(255, 255, 255, 230)
         ENDIF
      NEXT
      yR0 = yTop - 9
      yR1a = yTop - 28
      yR1b = yTop - 42
      yR2 = yTop - 61
      yR3 = yR2 - 18
      yR4 = yR3 - 18
      yR5 = yR4 - 18
      yR6 = yR5 - 18
      yR7 = yR6 - 18
      // ---- row 0: headers ----
      lenPSTxt = lenPS
      len5PTxt = len5P
      DRAWTEXT("Metric", c0X, yR0, SansSerif, Bold, 9) ANCHOR(BOTTOMRIGHT, XSHIFT, YSHIFT) COLOURED(19, 23, 34, 255)
      DRAWTEXT("Pivot Span (#lenPSTxt#)", c1X, yR0, SansSerif, Bold, 9) ANCHOR(BOTTOMRIGHT, XSHIFT, YSHIFT) COLOURED(psHiR, psHiG, psHiB, 255)
      DRAWTEXT("5-Pt Channel (#len5PTxt#)", c2X, yR0, SansSerif, Bold, 9) ANCHOR(BOTTOMRIGHT, XSHIFT, YSHIFT) COLOURED(c5HiR, c5HiG, c5HiB, 255)
      // ---- labels ----
      DRAWTEXT("Period", c0X, (yR1a + yR1b) / 2, SansSerif, Standard, 9) ANCHOR(BOTTOMRIGHT, XSHIFT, YSHIFT) COLOURED(19, 23, 34, 255)
      DRAWTEXT("Upper Start", c0X, yR2, SansSerif, Standard, 9) ANCHOR(BOTTOMRIGHT, XSHIFT, YSHIFT) COLOURED(19, 23, 34, 255)
      DRAWTEXT("Upper End", c0X, yR3, SansSerif, Standard, 9) ANCHOR(BOTTOMRIGHT, XSHIFT, YSHIFT) COLOURED(19, 23, 34, 255)
      DRAWTEXT("Lower Start", c0X, yR4, SansSerif, Standard, 9) ANCHOR(BOTTOMRIGHT, XSHIFT, YSHIFT) COLOURED(19, 23, 34, 255)
      DRAWTEXT("Lower End", c0X, yR5, SansSerif, Standard, 9) ANCHOR(BOTTOMRIGHT, XSHIFT, YSHIFT) COLOURED(19, 23, 34, 255)
      DRAWTEXT("Direction", c0X, yR6, SansSerif, Standard, 9) ANCHOR(BOTTOMRIGHT, XSHIFT, YSHIFT) COLOURED(19, 23, 34, 255)
      DRAWTEXT("Breakout", c0X, yR7, SansSerif, Standard, 9) ANCHOR(BOTTOMRIGHT, XSHIFT, YSHIFT) COLOURED(19, 23, 34, 255)
      // ---- column 1: pivot span ----
      IF m1On = 1 AND bIdx >= lenPS - 1 THEN
         dS = date[lenPS - 1]
         dE = date
         dS1 = dS - floor(dS / 100) * 100
         mS1 = floor(dS / 100) - floor(dS / 10000) * 100
         yS1 = floor(dS / 10000)
         dE1 = dE - floor(dE / 100) * 100
         mE1 = floor(dE / 100) - floor(dE / 10000) * 100
         yE1 = floor(dE / 10000)
         DRAWTEXT("#dS1#/#mS1#/#yS1#", c1X, yR1a, SansSerif, Standard, 9) ANCHOR(BOTTOMRIGHT, XSHIFT, YSHIFT) COLOURED(60, 63, 72, 255)
         DRAWTEXT("to #dE1#/#mE1#/#yE1#", c1X, yR1b, SansSerif, Standard, 9) ANCHOR(BOTTOMRIGHT, XSHIFT, YSHIFT) COLOURED(60, 63, 72, 255)
      ELSE
         DRAWTEXT("N/A", c1X, (yR1a + yR1b) / 2, SansSerif, Standard, 9) ANCHOR(BOTTOMRIGHT, XSHIFT, YSHIFT) COLOURED(60, 63, 72, 255)
      ENDIF
      IF m1On = 1 THEN
         pUS1 = round(m1Y1Hi / ticksize) * ticksize
         pUE1 = round(m1Y2Hi / ticksize) * ticksize
         pLS1 = round(m1Y1Lo / ticksize) * ticksize
         pLE1 = round(m1Y2Lo / ticksize) * ticksize
         DRAWTEXT("#pUS1#", c1X, yR2, SansSerif, Standard, 9) ANCHOR(BOTTOMRIGHT, XSHIFT, YSHIFT) COLOURED(psHiR, psHiG, psHiB, 255)
         DRAWTEXT("#pUE1#", c1X, yR3, SansSerif, Standard, 9) ANCHOR(BOTTOMRIGHT, XSHIFT, YSHIFT) COLOURED(psHiR, psHiG, psHiB, 255)
         DRAWTEXT("#pLS1#", c1X, yR4, SansSerif, Standard, 9) ANCHOR(BOTTOMRIGHT, XSHIFT, YSHIFT) COLOURED(psHiR, psHiG, psHiB, 255)
         DRAWTEXT("#pLE1#", c1X, yR5, SansSerif, Standard, 9) ANCHOR(BOTTOMRIGHT, XSHIFT, YSHIFT) COLOURED(psHiR, psHiG, psHiB, 255)
         midS1 = (m1Y1Hi + m1Y1Lo) / 2
         midE1 = (m1Y2Hi + m1Y2Lo) / 2
         pct1 = 0
         IF midS1 <> 0 THEN
            pct1 = (midE1 - midS1) / abs(midS1) * 100
         ENDIF
         IF pct1 > dashThreshold THEN
            DRAWTEXT("Bullish ▲", c1X, yR6, SansSerif, Standard, 9) ANCHOR(BOTTOMRIGHT, XSHIFT, YSHIFT) COLOURED(38, 166, 154, 255)
         ELSIF 0 - dashThreshold > pct1 THEN
            DRAWTEXT("Bearish ▼", c1X, yR6, SansSerif, Standard, 9) ANCHOR(BOTTOMRIGHT, XSHIFT, YSHIFT) COLOURED(239, 83, 80, 255)
         ELSE
            DRAWTEXT("Range ♦", c1X, yR6, SansSerif, Standard, 9) ANCHOR(BOTTOMRIGHT, XSHIFT, YSHIFT) COLOURED(120, 123, 134, 255)
         ENDIF
         IF close > m1Y2Hi THEN
            DRAWTEXT("Above ▲", c1X, yR7, SansSerif, Standard, 9) ANCHOR(BOTTOMRIGHT, XSHIFT, YSHIFT) COLOURED(38, 166, 154, 255)
         ELSIF m1Y2Lo > close THEN
            DRAWTEXT("Below ▼", c1X, yR7, SansSerif, Standard, 9) ANCHOR(BOTTOMRIGHT, XSHIFT, YSHIFT) COLOURED(239, 83, 80, 255)
         ELSE
            DRAWTEXT("Inside ♦", c1X, yR7, SansSerif, Standard, 9) ANCHOR(BOTTOMRIGHT, XSHIFT, YSHIFT) COLOURED(120, 123, 134, 255)
         ENDIF
      ELSE
         DRAWTEXT("N/A", c1X, yR2, SansSerif, Standard, 9) ANCHOR(BOTTOMRIGHT, XSHIFT, YSHIFT) COLOURED(120, 123, 134, 255)
         DRAWTEXT("N/A", c1X, yR3, SansSerif, Standard, 9) ANCHOR(BOTTOMRIGHT, XSHIFT, YSHIFT) COLOURED(120, 123, 134, 255)
         DRAWTEXT("N/A", c1X, yR4, SansSerif, Standard, 9) ANCHOR(BOTTOMRIGHT, XSHIFT, YSHIFT) COLOURED(120, 123, 134, 255)
         DRAWTEXT("N/A", c1X, yR5, SansSerif, Standard, 9) ANCHOR(BOTTOMRIGHT, XSHIFT, YSHIFT) COLOURED(120, 123, 134, 255)
         DRAWTEXT("N/A", c1X, yR6, SansSerif, Standard, 9) ANCHOR(BOTTOMRIGHT, XSHIFT, YSHIFT) COLOURED(120, 123, 134, 255)
         DRAWTEXT("N/A", c1X, yR7, SansSerif, Standard, 9) ANCHOR(BOTTOMRIGHT, XSHIFT, YSHIFT) COLOURED(120, 123, 134, 255)
      ENDIF
      // ---- column 2: 5-point channel ----
      IF m2On = 1 THEN
         dS = date[len5P - 1]
         dE = date
         dS2 = dS - floor(dS / 100) * 100
         mS2 = floor(dS / 100) - floor(dS / 10000) * 100
         yS2 = floor(dS / 10000)
         dE2 = dE - floor(dE / 100) * 100
         mE2 = floor(dE / 100) - floor(dE / 10000) * 100
         yE2 = floor(dE / 10000)
         DRAWTEXT("#dS2#/#mS2#/#yS2#", c2X, yR1a, SansSerif, Standard, 9) ANCHOR(BOTTOMRIGHT, XSHIFT, YSHIFT) COLOURED(60, 63, 72, 255)
         DRAWTEXT("to #dE2#/#mE2#/#yE2#", c2X, yR1b, SansSerif, Standard, 9) ANCHOR(BOTTOMRIGHT, XSHIFT, YSHIFT) COLOURED(60, 63, 72, 255)
         pUS2 = round(m2Y1Hi / ticksize) * ticksize
         pUE2 = round(m2Y2Hi / ticksize) * ticksize
         pLS2 = round(m2Y1Lo / ticksize) * ticksize
         pLE2 = round(m2Y2Lo / ticksize) * ticksize
         DRAWTEXT("#pUS2#", c2X, yR2, SansSerif, Standard, 9) ANCHOR(BOTTOMRIGHT, XSHIFT, YSHIFT) COLOURED(c5HiR, c5HiG, c5HiB, 255)
         DRAWTEXT("#pUE2#", c2X, yR3, SansSerif, Standard, 9) ANCHOR(BOTTOMRIGHT, XSHIFT, YSHIFT) COLOURED(c5HiR, c5HiG, c5HiB, 255)
         DRAWTEXT("#pLS2#", c2X, yR4, SansSerif, Standard, 9) ANCHOR(BOTTOMRIGHT, XSHIFT, YSHIFT) COLOURED(c5HiR, c5HiG, c5HiB, 255)
         DRAWTEXT("#pLE2#", c2X, yR5, SansSerif, Standard, 9) ANCHOR(BOTTOMRIGHT, XSHIFT, YSHIFT) COLOURED(c5HiR, c5HiG, c5HiB, 255)
         midS2 = (m2Y1Hi + m2Y1Lo) / 2
         midE2 = (m2Y2Hi + m2Y2Lo) / 2
         pct2 = 0
         IF midS2 <> 0 THEN
            pct2 = (midE2 - midS2) / abs(midS2) * 100
         ENDIF
         IF pct2 > dashThreshold THEN
            DRAWTEXT("Bullish ▲", c2X, yR6, SansSerif, Standard, 9) ANCHOR(BOTTOMRIGHT, XSHIFT, YSHIFT) COLOURED(38, 166, 154, 255)
         ELSIF 0 - dashThreshold > pct2 THEN
            DRAWTEXT("Bearish ▼", c2X, yR6, SansSerif, Standard, 9) ANCHOR(BOTTOMRIGHT, XSHIFT, YSHIFT) COLOURED(239, 83, 80, 255)
         ELSE
            DRAWTEXT("Range ♦", c2X, yR6, SansSerif, Standard, 9) ANCHOR(BOTTOMRIGHT, XSHIFT, YSHIFT) COLOURED(120, 123, 134, 255)
         ENDIF
         IF close > m2Y2Hi THEN
            DRAWTEXT("Above ▲", c2X, yR7, SansSerif, Standard, 9) ANCHOR(BOTTOMRIGHT, XSHIFT, YSHIFT) COLOURED(38, 166, 154, 255)
         ELSIF m2Y2Lo > close THEN
            DRAWTEXT("Below ▼", c2X, yR7, SansSerif, Standard, 9) ANCHOR(BOTTOMRIGHT, XSHIFT, YSHIFT) COLOURED(239, 83, 80, 255)
         ELSE
            DRAWTEXT("Inside ♦", c2X, yR7, SansSerif, Standard, 9) ANCHOR(BOTTOMRIGHT, XSHIFT, YSHIFT) COLOURED(120, 123, 134, 255)
         ENDIF
      ELSE
         DRAWTEXT("N/A", c2X, (yR1a + yR1b) / 2, SansSerif, Standard, 9) ANCHOR(BOTTOMRIGHT, XSHIFT, YSHIFT) COLOURED(60, 63, 72, 255)
         DRAWTEXT("N/A", c2X, yR2, SansSerif, Standard, 9) ANCHOR(BOTTOMRIGHT, XSHIFT, YSHIFT) COLOURED(120, 123, 134, 255)
         DRAWTEXT("N/A", c2X, yR3, SansSerif, Standard, 9) ANCHOR(BOTTOMRIGHT, XSHIFT, YSHIFT) COLOURED(120, 123, 134, 255)
         DRAWTEXT("N/A", c2X, yR4, SansSerif, Standard, 9) ANCHOR(BOTTOMRIGHT, XSHIFT, YSHIFT) COLOURED(120, 123, 134, 255)
         DRAWTEXT("N/A", c2X, yR5, SansSerif, Standard, 9) ANCHOR(BOTTOMRIGHT, XSHIFT, YSHIFT) COLOURED(120, 123, 134, 255)
         DRAWTEXT("N/A", c2X, yR6, SansSerif, Standard, 9) ANCHOR(BOTTOMRIGHT, XSHIFT, YSHIFT) COLOURED(120, 123, 134, 255)
         DRAWTEXT("N/A", c2X, yR7, SansSerif, Standard, 9) ANCHOR(BOTTOMRIGHT, XSHIFT, YSHIFT) COLOURED(120, 123, 134, 255)
      ENDIF
   ENDIF
ENDIF
RETURN