Smooth Theil-Sen
Introduction
Every linear regression channel you have ever plotted shares one weakness: it is fitted by ordinary least squares (OLS), and least squares is exquisitely sensitive to outliers. A single flash spike, a gap, or one anomalous close is enough to tilt the whole line and drag the channel off the real body of the move — precisely at the moments when you most need a stable read of the trend.
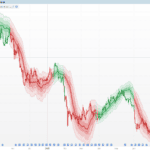
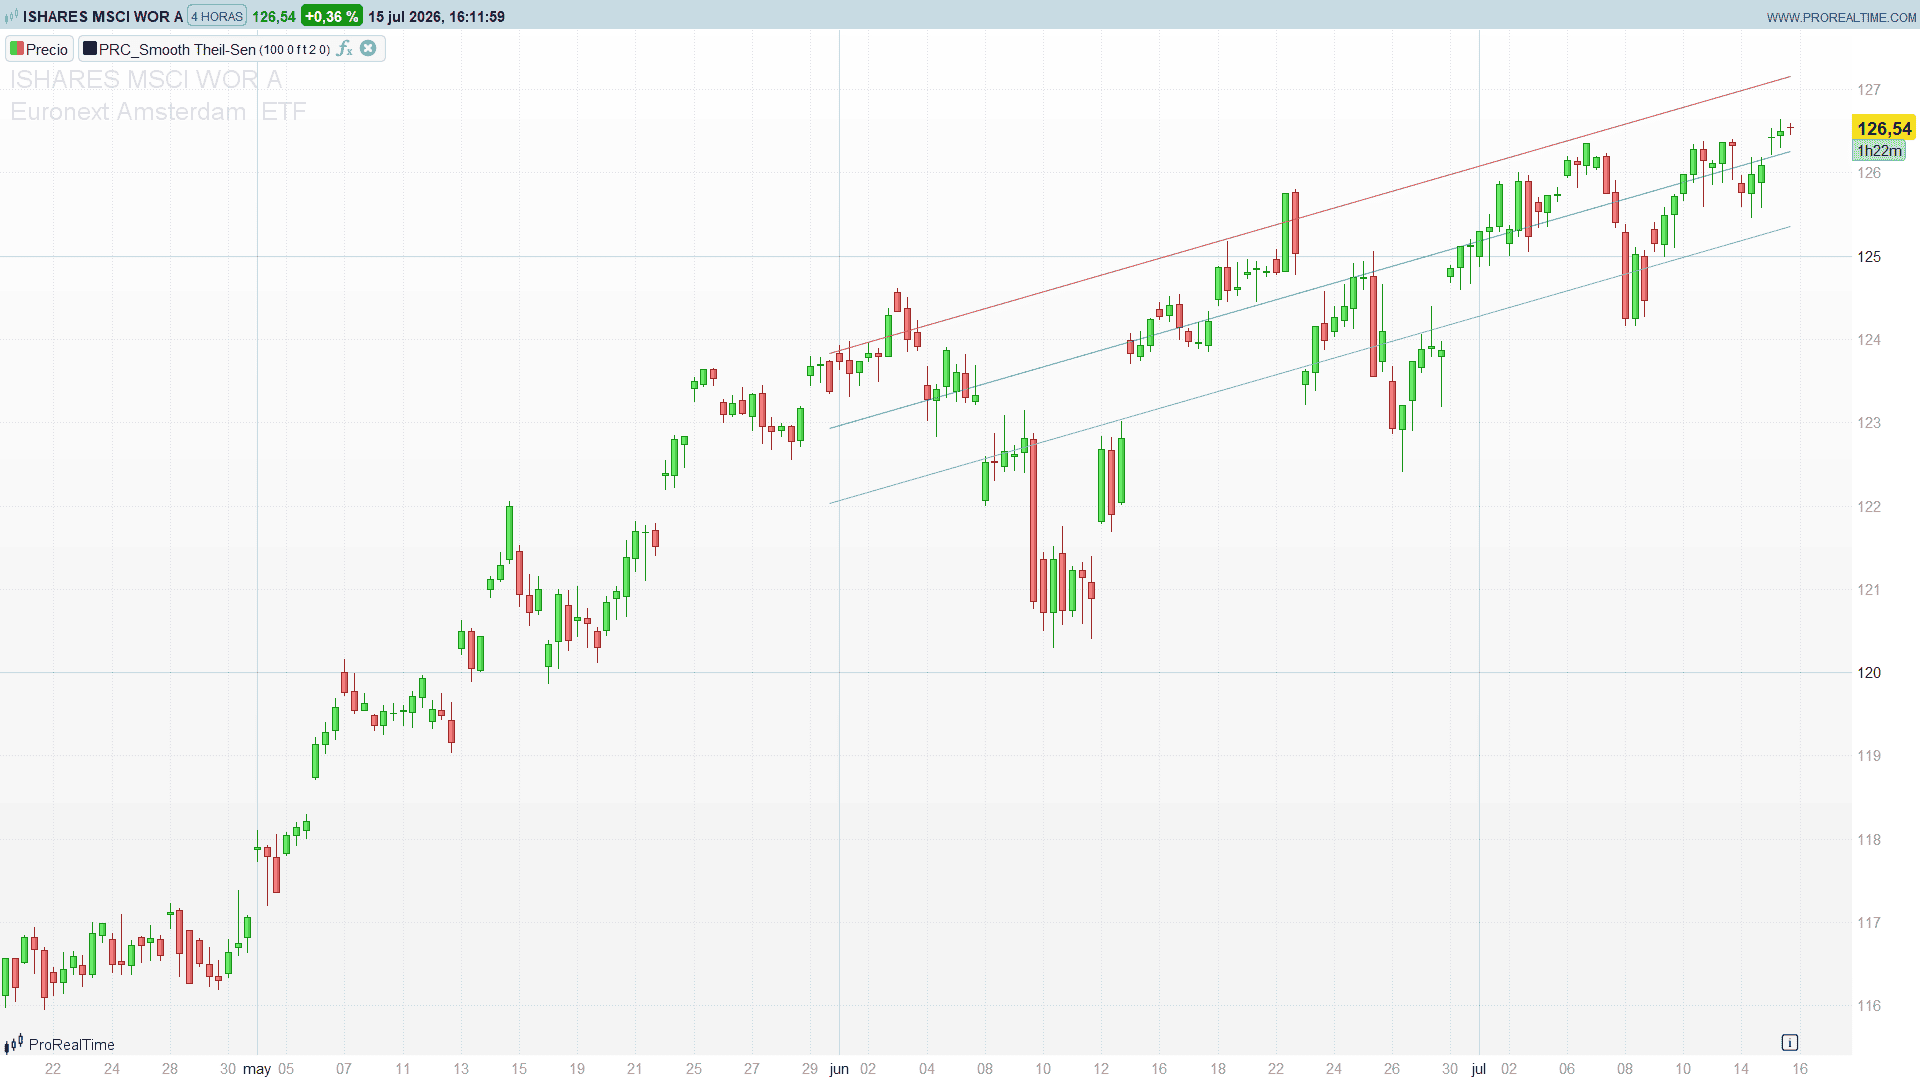
The Theil-Sen estimator solves this at the root. Instead of minimising squared errors, it defines the slope as the median of the slopes of every pair of points in the window. Because it is built on a median, it tolerates a large fraction of contaminated data before it breaks — its breakdown point is about 29.3%, meaning almost a third of the points in the window can be arbitrary garbage and the fitted line barely moves. This ProBuilder port draws that robust line as a channel, with deviation bands above and below, projected across the chart on the last bar.
Theory Behind the Indicator
1. The robust slope
Take the last Length values of the source. For every pair of points (p, q) in that window, compute the elementary slope:
slope(p, q) = ( src[q] - src[p] ) / ( q - p )
With a window of 25 bars that is C(25,2) = 300 pairwise slopes. The Theil-Sen slope beta1 is simply the median of all of them. One outlier corrupts only the pairs that touch it — a minority — so the median steps straight over them. OLS, by contrast, squares every residual and lets the worst point dominate the fit.
2. The robust intercept
With the slope fixed, the intercept is estimated the same robust way. For each bar p in the window compute the residual src[p] - beta1 * p, then take beta0 = median of the residuals. Slope and intercept are therefore both median-based, giving a fully robust fit of the form value(p) = beta0 + beta1 * p, where p is the number of bars back from the current one.
3. Deviation bands: MAD or RMSD
The channel half-width is a dispersion measure of the residuals, scaled by a multiplier:
- MAD (Median Absolute Deviation) — the median of
|residual|. Robust, consistent with the estimator’s philosophy, and the default. - RMSD (Root Mean Square Deviation) — the classic
sqrt(mean(residual²)). Sensitive to large deviations; use it when you want extreme moves to widen the band.
With Mult = 2, the bands sit two dispersion units either side of the line, delimiting where price has statistically spent most of its time relative to the robust trend.
4. Extracting the median without a sort
The one genuine engineering challenge is the slope median. With a large window the number of pairwise slopes explodes — Length = 100 produces 4950 of them — and sorting that many values on ProBuilder (an O(n²) bubble sort) balloons into millions of iterations, enough for ProRealTime to abort with a “infinite loop detected” error. The port sidesteps the sort entirely: it finds the median by bisection. It brackets the slope range with its min and max, then repeatedly tests a midpoint, counting how many of the pairwise slopes fall below it, and narrows the bracket toward the value with exactly half the slopes underneath. That is a handful of linear passes instead of a quadratic sort — the same robust median, at a tiny fraction of the cost. The whole fit then runs once, inside islastbarupdate, and is rendered with drawsegment.
How to Read the Indicator
- The central line is the robust trend. It is coloured by its own direction — teal when the fit is rising, red when it is falling — read from the sign of the slope in chronological time.
- The two outer lines are the deviation bands. The upper band (red) acts as dynamic resistance, the lower band (green) as dynamic support, both parallel to the central line.
- The channel can be projected forward with
Extend, giving a forward cone of where the robust trend and its bands point.
Practical Applications
- A trend read that ignores spikes. On instruments prone to gaps, wicks and news spikes, the Theil-Sen line stays glued to the body of the move where an OLS line would chase the outlier. Use its slope as a clean directional bias.
- Mean reversion at the bands. Price tagging the upper or lower band is a statistically stretched excursion from the robust trend — a candidate fade back toward the centre line.
- Dynamic support and resistance. The parallel bands offer objective, volatility-scaled levels that update with the fit rather than being drawn by hand.
- A robustness benchmark. Overlay it against the native
LinearRegression[Length](OLS): where the two lines diverge, outliers are actively distorting the least-squares fit — useful information in itself.
Indicator Configuration
Length(default 25): the regression window. Larger is smoother and slower; smaller is more reactive.Offset(default 0): shifts the fitting window backward in bars, to study historical fits.UseMean(default 0):0= median (true robust Theil-Sen);1= mean of the pairwise slopes (fast, but it throws away the robustness that is the whole point).DevType(default 1):1= MAD (robust);0= RMSD (RMS error).Mult(default 2.0): band multiplier applied to the chosen dispersion measure.Extend(default 0): forward projection of the channel, in bars.BisectSteps(default 16): bisection iterations for the slope median. 16 places the line within a sub-tick of the exact median; only lower it if an extremeLengthever triggers the loop guard.
The trend colours are plain RGB constants inside the code; edit them to recolour the tool.
Code
//--------------------------------------------
// PRC_Smooth Theil-Sen (by The_Peaceful_Lizard)
// version = 1
// 15.07.2026
// Iván González @ www.prorealcode.com
// Sharing ProRealTime knowledge
//--------------------------------------------
// Robust Theil-Sen regression channel (overlay):
//   beta1 = median of the pairwise slopes (via bisection)
//   beta0 = median of the residuals
// Computed and drawn ONLY on the last bar (drawsegment).
//--------------------------------------------
defparam drawonlastbaronly = true

//=== INPUTS ===
Length = 100       // regression window (>=2)
Offset = 0        // backward shift, in bars (>=0)
UseMean = 0       // 0 = median (robust Theil-Sen), 1 = mean (fast, not robust)
DevType = 1       // 1 = MAD (robust), 0 = RMSD
Mult = 2.0        // deviation band multiplier
Extend = 0        // forward extrapolation, in bars (>=0)
BisectSteps = 16  // bisection iterations for the slope median.
// Lower it if a very high Length triggers "infinite loop"

src = close

IF islastbarupdate AND barindex >= Length - 1 + Offset THEN

   //--- 1) Robust slope beta1 ----------------------------
   // Median of the C(Length,2) pairwise slopes, via on-the-fly
   // bisection (no sorting, no large array) -> O(BisectSteps*np)
   IF UseMean THEN
      sumv = 0
      npair = 0
      FOR p = 0 TO Length - 2 DO
         FOR q = p + 1 TO Length - 1 DO
            sumv = sumv + (src[q + Offset] - src[p + Offset]) / (q - p)
            npair = npair + 1
         NEXT
      NEXT
      beta1 = sumv / npair
   ELSE
      // min/max of the slopes + total pair count
      npair = 0
      smin = 0
      smax = 0
      FOR p = 0 TO Length - 2 DO
         FOR q = p + 1 TO Length - 1 DO
            sv = (src[q + Offset] - src[p + Offset]) / (q - p)
            IF npair = 0 THEN
               smin = sv
               smax = sv
            ELSIF sv < smin THEN
               smin = sv
            ELSIF sv > smax THEN
               smax = sv
            ENDIF
            npair = npair + 1
         NEXT
      NEXT
      // bisection: find the value with npair/2 slopes below it
      mytarget = npair / 2
      lo = smin
      hi = smax
      FOR it = 1 TO BisectSteps DO
         midv = (lo + hi) / 2
         cnt = 0
         FOR p = 0 TO Length - 2 DO
            FOR q = p + 1 TO Length - 1 DO
               IF (src[q + Offset] - src[p + Offset]) / (q - p) < midv THEN
                  cnt = cnt + 1
               ENDIF
            NEXT
         NEXT
         IF cnt < mytarget THEN
            lo = midv
         ELSE
            hi = midv
         ENDIF
      NEXT
      beta1 = (lo + hi) / 2
   ENDIF

   //--- 2) Robust intercept beta0 (median of residuals) ---
   FOR p = 0 TO Length - 1 DO
      $rs[p] = src[p + Offset] - beta1 * p
   NEXT
   IF UseMean THEN
      sumr = 0
      FOR i = 0 TO Length - 1 DO
         sumr = sumr + $rs[i]
      NEXT
      beta0 = sumr / Length
   ELSE
      FOR a = 0 TO Length - 2 DO
         FOR b = 0 TO Length - 2 - a DO
            IF $rs[b] > $rs[b + 1] THEN
               tmpr = $rs[b]
               $rs[b] = $rs[b + 1]
               $rs[b + 1] = tmpr
            ENDIF
         NEXT
      NEXT
      midr = floor(Length / 2)
      IF Length = 2 * midr THEN
         beta0 = ($rs[midr - 1] + $rs[midr]) / 2
      ELSE
         beta0 = $rs[midr]
      ENDIF
   ENDIF

   //--- 3) Deviation (MAD or RMSD) -----------------------
   IF DevType THEN
      FOR p = 0 TO Length - 1 DO
         pred = beta0 + beta1 * p
         $er[p] = abs(src[p + Offset] - pred)
      NEXT
      FOR a = 0 TO Length - 2 DO
         FOR b = 0 TO Length - 2 - a DO
            IF $er[b] > $er[b + 1] THEN
               tmpe = $er[b]
               $er[b] = $er[b + 1]
               $er[b + 1] = tmpe
            ENDIF
         NEXT
      NEXT
      mide = floor(Length / 2)
      IF Length = 2 * mide THEN
         dev = ($er[mide - 1] + $er[mide]) / 2
      ELSE
         dev = $er[mide]
      ENDIF
      dev = dev * Mult
   ELSE
      sumsq = 0
      FOR p = 0 TO Length - 1 DO
         pred = beta0 + beta1 * p
         errv = src[p + Offset] - pred
         sumsq = sumsq + errv * errv
      NEXT
      dev = sqrt(sumsq / Length) * Mult
   ENDIF

   //--- 4) Channel coordinates ---------------------------
   xEnd = max(0, barindex - (Length - 1) - Offset)
   yEnd = beta0 + beta1 * (Length - 1)
   xNow = barindex + Extend
   yNow = beta0 - beta1 * (Offset + Extend)

   //--- 5) Trend color (beta1<=0 => bullish) -------------
   IF beta1 <= 0 THEN
      rc = 82
      gc = 150
      bc = 134
   ELSE
      rc = 190
      gc = 49
      bc = 73
   ENDIF

   //--- 6) Draw channel + bands --------------------------
   DRAWSEGMENT(xEnd, yEnd, xNow, yNow) COLOURED(rc, gc, bc)
   DRAWSEGMENT(xEnd, yEnd + dev, xNow, yNow + dev) COLOURED(211, 83, 104)
   DRAWSEGMENT(xEnd, yEnd - dev, xNow, yNow - dev) COLOURED(128, 185, 172)
ENDIF

RETURN