Super Ichimoku — Follow Volatility Regimes
Introduction
The Ichimoku Kinko Hyo builds every one of its lines the same way: take the highest high and the lowest low over a fixed window, and average them. Tenkan uses 9 bars, Kijun uses 26, Senkou Span B uses 52. It is a clean idea, and it has one structural weakness — the window has no opinion about what the market is doing. A 26-bar midpoint means the same thing in a dead range and in a vertical trend, and every one of those lines drifts a little on every single bar simply because the window slid forward by one.
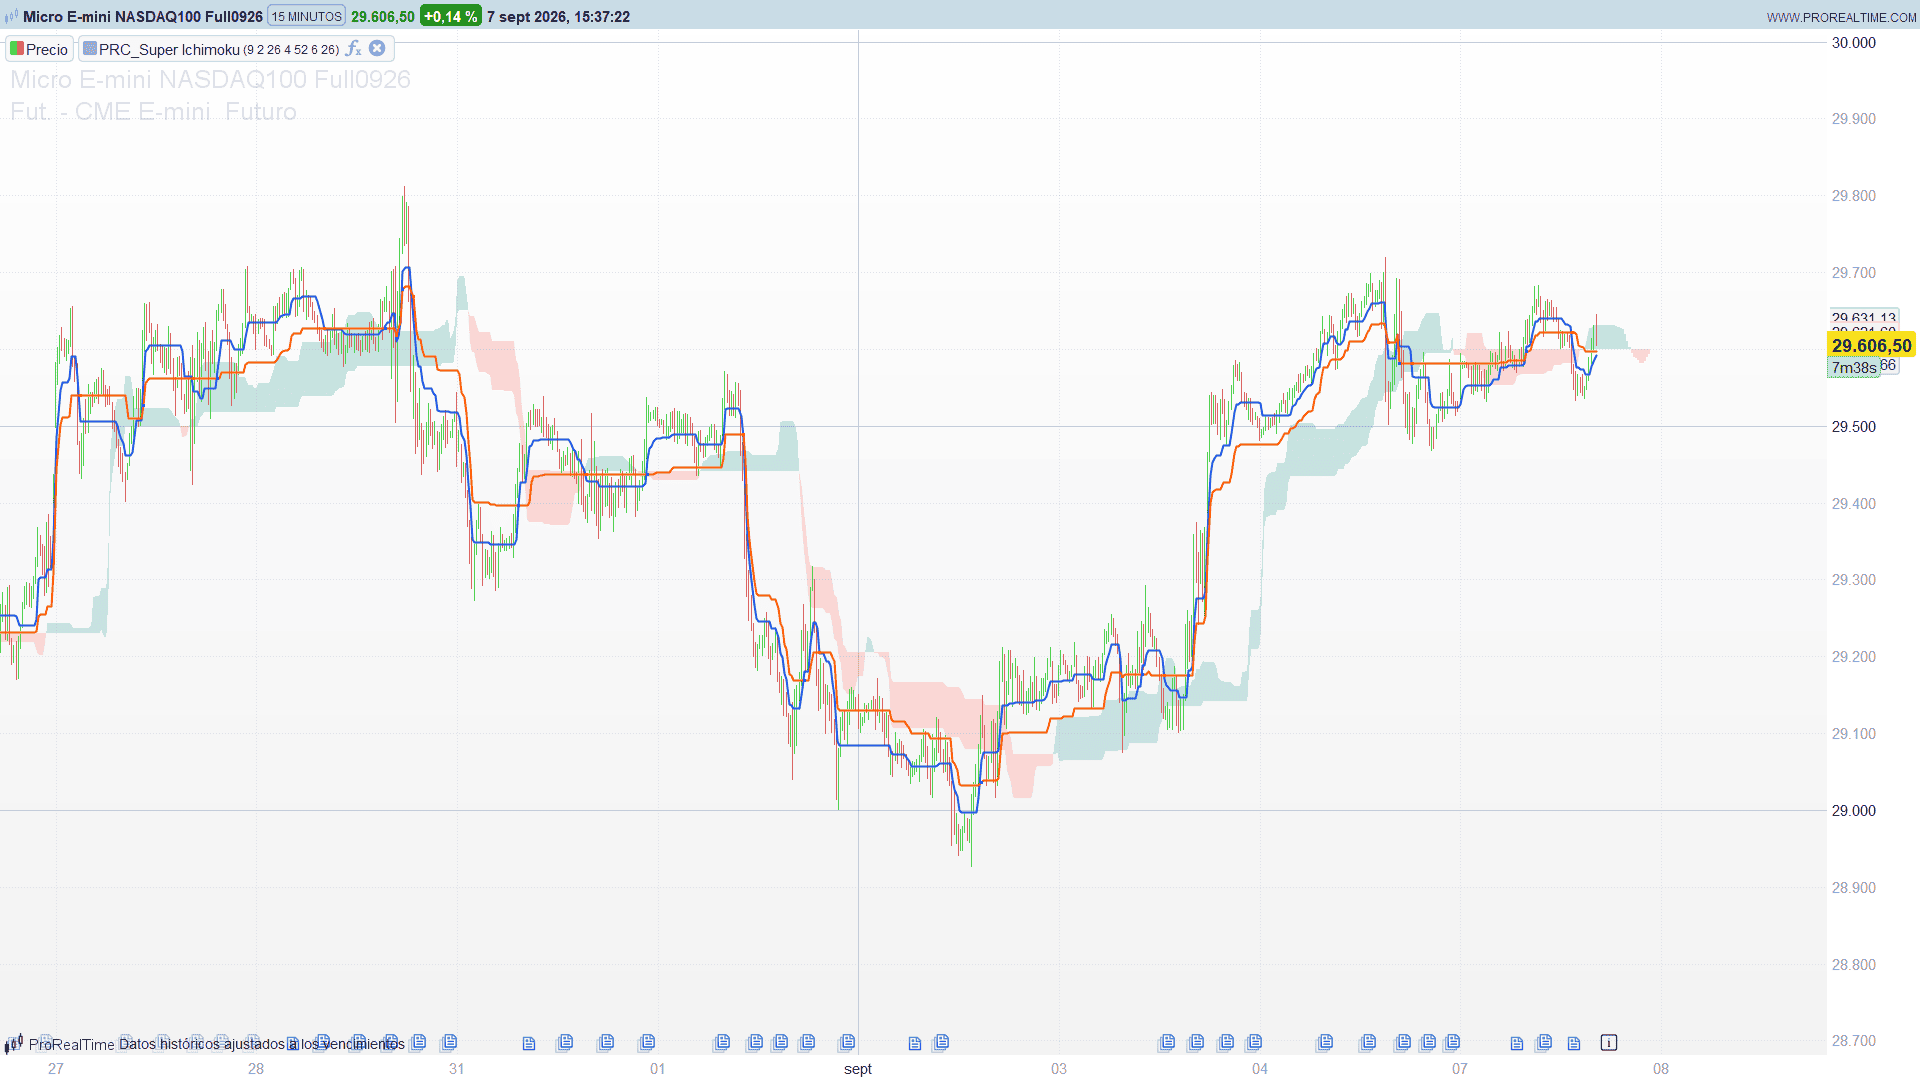
SuperIchi, designed by LuxAlgo, keeps the Ichimoku layout — three lines, a cloud, a displacement — and replaces the window with a volatility regime. Each line is the midpoint between two things: the most extreme price reached since the current regime began, and the trailing stop that defines that regime. When the regime holds, the line barely moves. When the regime flips, the line jumps.
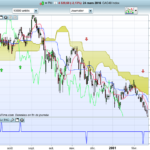
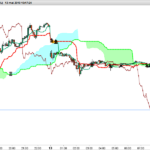
The visual difference on a chart is immediate: the classic Ichimoku cloud undulates continuously, while the SuperIchi cloud is made of long flat stretches punctuated by steps.
Theory Behind the Indicator
One engine, three instances
All three lines come from the same engine, called with a different ATR length and a different multiplier:
- Tenkan-Sen: 9 bars, multiplier 2
- Kijun-Sen: 26 bars, multiplier 4
- Senkou Span B: 52 bars, multiplier 6
Those three multipliers are what actually separate the lines. Give them all the same multiplier and the three collapse onto each other regardless of their lengths — the multiplier, not the length, is what sets how far a line lags behind price.
Senkou Span A remains the average of Tenkan and Kijun, exactly as in the classic Ichimoku.
Step 1 — a trailing stop pair
The engine starts as a standard trailing ATR channel around the bar midpoint:
up = (high + low) / 2 + ATR(length) * mult
dn = (high + low) / 2 – ATR(length) * mult
These two candidates are then made sticky, so they ratchet in one direction only while price stays on their side:
upper = close[1] < upper[1] ? min(up, upper[1]) : up
lower = close[1] > lower[1] ? max(dn, lower[1]) : dn
The upper band can only come down while price stays underneath it; the lower band can only go up while price stays above it. This is the classic SuperTrend ratchet, and it produces a resistance that tightens during a downtrend and a support that tightens during an uptrend.
A regime state os flips to 1 when close breaks above upper, back to 0 when close breaks below lower, and otherwise holds its previous value. The active stop spt is whichever band belongs to the current regime: the lower band in an uptrend, the upper band in a downtrend.
Step 2 — the part that is not a SuperTrend
Here is where SuperIchi departs from every other ATR trend follower. Instead of plotting spt, the engine tracks two extra series:
- mx — the highest close reached during the current bullish regime
- mn — the lowest close reached during the current bearish regime
and each of them collapses onto the stop when its regime is not the active one:
mx = (crossing OR os = 1) ? max(close, mx[1]) : spt
mn = (crossing OR os = 0) ? min(close, mn[1]) : spt
Read that in plain terms. In an uptrend, mx is the running high-water mark of the move and mn is the trailing support underneath it. In a downtrend, mn is the running low-water mark and mx is the trailing resistance above it. In both cases you end up with one line above price and one line below it, and the output is simply their midpoint:
line = (mx + mn) / 2
That is the whole indicator. It is an Ichimoku midpoint, but the “highest” and “lowest” it averages are not taken from a fixed window — they are taken from the current volatility regime, which can last four bars or four hundred.
The crossing term is a two-directional cross of close through the active stop, and it exists so that on the exact bar of a regime change both extremes update from their previous value rather than snapping to the new stop immediately.
Step 3 — the cloud and its displacement
Senkou Span A and Senkou Span B are drawn 25 bars ahead of the current bar, which is where the familiar Ichimoku cloud shape comes from. The cloud is filled teal when Span A is above Span B and red when it is below.
A forward-shifted plot has a useful property: the value that lands on the current bar’s X coordinate is the value that was calculated 25 bars ago. So for the whole visible history the cloud is a plain series lag:
sA = senkouA[dispPlot]
sB = senkouB[dispPlot]
Only the last 25 bars of the cloud stick out past the current bar into coordinates where no candle exists yet. That leading section cannot be a series — there is nothing for it to attach to — so it is drawn instead. The code below draws it as a run of one-bar-wide rectangles, each coloured by which span is on top for that specific bar.
The ProRealTime Code
DEFPARAM DRAWONLASTBARONLY = TRUE
//--------------------------------------------
// PRC_SuperIchi (SuperIchi [LUX] by LuxAlgo)
// version = 0
// 04.09.2026
// Ivan Gonzalez @ www.prorealcode.com
// Sharing ProRealTime knowledge
//--------------------------------------------
// Ichimoku-style set of lines built on an ATR trailing-stop
// engine instead of the classic Donchian midpoints.
// Each line is the midpoint between the extreme reached by
// price and the trailing stop of its own regime.
//--------------------------------------------


//=== INPUTS (declare as Variables in the editor) ===
tenkanLen  = 9        // Tenkan ATR length
tenkanMult = 2.0      // Tenkan ATR multiplier
kijunLen   = 26       // Kijun ATR length
kijunMult  = 4.0      // Kijun ATR multiplier
spanBLen   = 52       // Senkou Span B ATR length
spanBMult  = 6.0      // Senkou Span B ATR multiplier
disp       = 26       // Displacement


//=== ADAPTIVE MIDLINE ENGINE - TENKAN ===
atrT = averagetruerange[tenkanLen](close) * tenkanMult
upT  = (high + low) / 2 + atrT
dnT  = (high + low) / 2 - atrT


IF barindex <= tenkanLen THEN
   upperT = upT
   lowerT = dnT
   osT    = 0
   sptT   = close
   mxT    = close
   mnT    = close
ELSE
   IF close[1] < upperT[1] THEN
      upperT = min(upT, upperT[1])
   ELSE
      upperT = upT
   ENDIF
   IF close[1] > lowerT[1] THEN
      lowerT = max(dnT, lowerT[1])
   ELSE
      lowerT = dnT
   ENDIF

   IF close > upperT THEN
      osT = 1
   ELSIF close < lowerT THEN
      osT = 0
   ELSE
      osT = osT[1]
   ENDIF

   IF osT = 1 THEN
      sptT = lowerT
   ELSE
      sptT = upperT
   ENDIF

   crT = 0
   IF close[1] < sptT[1] AND close > sptT THEN
      crT = 1
   ENDIF
   IF close[1] > sptT[1] AND close < sptT THEN
      crT = 1
   ENDIF

   IF crT = 1 OR osT = 1 THEN
      mxT = max(close, mxT[1])
   ELSE
      mxT = sptT
   ENDIF
   IF crT = 1 OR osT = 0 THEN
      mnT = min(close, mnT[1])
   ELSE
      mnT = sptT
   ENDIF
ENDIF


//=== ADAPTIVE MIDLINE ENGINE - KIJUN ===
atrK = averagetruerange[kijunLen](close) * kijunMult
upK  = (high + low) / 2 + atrK
dnK  = (high + low) / 2 - atrK


IF barindex <= kijunLen THEN
   upperK = upK
   lowerK = dnK
   osK    = 0
   sptK   = close
   mxK    = close
   mnK    = close
ELSE
   IF close[1] < upperK[1] THEN
      upperK = min(upK, upperK[1])
   ELSE
      upperK = upK
   ENDIF
   IF close[1] > lowerK[1] THEN
      lowerK = max(dnK, lowerK[1])
   ELSE
      lowerK = dnK
   ENDIF

   IF close > upperK THEN
      osK = 1
   ELSIF close < lowerK THEN
      osK = 0
   ELSE
      osK = osK[1]
   ENDIF

   IF osK = 1 THEN
      sptK = lowerK
   ELSE
      sptK = upperK
   ENDIF

   crK = 0
   IF close[1] < sptK[1] AND close > sptK THEN
      crK = 1
   ENDIF
   IF close[1] > sptK[1] AND close < sptK THEN
      crK = 1
   ENDIF

   IF crK = 1 OR osK = 1 THEN
      mxK = max(close, mxK[1])
   ELSE
      mxK = sptK
   ENDIF
   IF crK = 1 OR osK = 0 THEN
      mnK = min(close, mnK[1])
   ELSE
      mnK = sptK
   ENDIF
ENDIF


//=== ADAPTIVE MIDLINE ENGINE - SENKOU SPAN B ===
atrS = averagetruerange[spanBLen](close) * spanBMult
upS  = (high + low) / 2 + atrS
dnS  = (high + low) / 2 - atrS


IF barindex <= spanBLen THEN
   upperS = upS
   lowerS = dnS
   osS    = 0
   sptS   = close
   mxS    = close
   mnS    = close
ELSE
   IF close[1] < upperS[1] THEN
      upperS = min(upS, upperS[1])
   ELSE
      upperS = upS
   ENDIF
   IF close[1] > lowerS[1] THEN
      lowerS = max(dnS, lowerS[1])
   ELSE
      lowerS = dnS
   ENDIF

   IF close > upperS THEN
      osS = 1
   ELSIF close < lowerS THEN
      osS = 0
   ELSE
      osS = osS[1]
   ENDIF

   IF osS = 1 THEN
      sptS = lowerS
   ELSE
      sptS = upperS
   ENDIF

   crS = 0
   IF close[1] < sptS[1] AND close > sptS THEN
      crS = 1
   ENDIF
   IF close[1] > sptS[1] AND close < sptS THEN
      crS = 1
   ENDIF

   IF crS = 1 OR osS = 1 THEN
      mxS = max(close, mxS[1])
   ELSE
      mxS = sptS
   ENDIF
   IF crS = 1 OR osS = 0 THEN
      mnS = min(close, mnS[1])
   ELSE
      mnS = sptS
   ENDIF
ENDIF


//=== OUTPUT LINES (masked during the longest warm-up) ===
IF barindex <= spanBLen THEN
   tenkan  = undefined
   kijun   = undefined
   senkouA = undefined
   senkouB = undefined
ELSE
   tenkan  = (mxT + mnT) / 2
   kijun   = (mxK + mnK) / 2
   senkouB = (mxS + mnS) / 2
   senkouA = (kijun + tenkan) / 2
ENDIF


//=== CLOUD, SHIFTED FORWARD BY disp-1 BARS ===
// A forward plot at +N is read on the chart as the value
// computed N bars ago, so the past half of the cloud is a
// plain series lag. The future half has no bars yet: drawn below.
dispPlot = disp - 1
sA = senkouA[dispPlot]
sB = senkouB[dispPlot]


IF sA > sB THEN
   aUp = 51
   aDn = 0
ELSE
   aUp = 0
   aDn = 51
ENDIF


COLORBETWEEN(sA, sB, 0, 137, 123, aUp)
COLORBETWEEN(sA, sB, 255, 82, 82, aDn)


//=== PROJECTED CLOUD (bars that do not exist yet) ===
IF islastbarupdate AND barindex > spanBLen + disp THEN
   FOR j = 1 TO dispPlot DO
      xa = barindex + j - 1
      xb = barindex + j
      ya = senkouA[dispPlot - j + 1]
      yb = senkouA[dispPlot - j]
      za = senkouB[dispPlot - j + 1]
      zb = senkouB[dispPlot - j]
      ym = (ya + yb) / 2
      zm = (za + zb) / 2
      IF ym > zm THEN
         rr = 0
         gg = 137
         bb = 123
      ELSE
         rr = 255
         gg = 82
         bb = 82
      ENDIF
      DRAWRECTANGLE(xa, min(ym, zm), xb, max(ym, zm)) COLOURED(rr, gg, bb, 0) FILLCOLOR(rr, gg, bb, 51)
   NEXT
ENDIF


//=== TENKAN / KIJUN CROSSES ===
dotUp  = undefined
dotDn  = undefined
aDotUp = 0
aDotDn = 0
IF tenkan > kijun AND tenkan[1] <= kijun[1] THEN
   dotUp  = kijun
   aDotUp = 255
ENDIF
IF tenkan < kijun AND tenkan[1] >= kijun[1] THEN
   dotDn  = kijun
   aDotDn = 255
ENDIF


RETURN tenkan COLOURED(33, 87, 243, 255) STYLE(line, 2) AS "Tenkan-Sen", kijun COLOURED(255, 93, 0, 255) STYLE(line, 2) AS "Kijun-Sen", dotUp COLOURED(33, 87, 243, aDotUp) STYLE(point, 3) AS "Crossover", dotDn COLOURED(255, 93, 0, aDotDn) STYLE(point, 3) AS "Crossunder", sA COLOURED(0, 137, 123, 0) STYLE(line, 1) AS "Senkou Span A", sB COLOURED(255, 82, 82, 0) STYLE(line, 1) AS "Senkou Span B"
Reading the Indicator
The Tenkan/Kijun cross is marked with a coloured dot on the Kijun line: blue when Tenkan crosses above Kijun, orange when it crosses below. Because both lines are flat while their regimes hold, these crosses are far less frequent than on a classic Ichimoku — the fast line has to actually break its own 2x ATR regime before it can move enough to cross the slow one.
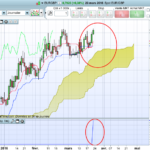
The cloud works the way it always does: price above the cloud is the bullish context, price below it the bearish one, and the twist bars — where Span A and Span B swap — mark the projected change of context 25 bars ahead of time. Since Span B uses a 6x ATR multiplier, its flips are rare, and the cloud spends long periods as a flat band.
The flat stretches are the point. A classic Kijun drifts on every bar, so “price crossed the Kijun” is partly an artefact of the line moving. Here the line only moves when the regime moves, so a cross is a statement about price alone.
Settings
The three lengths and three multipliers are exposed as variables. The multipliers matter far more than the lengths: raising a multiplier widens the regime band, which makes flips rarer and the line flatter and further from price. Dropping all three to a similar value makes the three lines converge and the cloud collapse to a thin ribbon.
Displacement shifts the cloud forward. It is set to 26 by convention; the drawing uses 25, matching the Ichimoku standard where the displaced plot starts one bar early.