





Stochastic Master: The Slow Stochastic Drawn as Prices on the Chart
Introduction
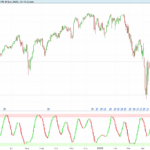
The stochastic tells you a number, and the question you actually have is a price: where does the market have to close tomorrow for %K to be overbought?
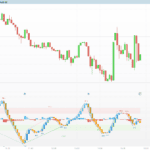
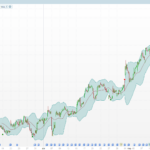
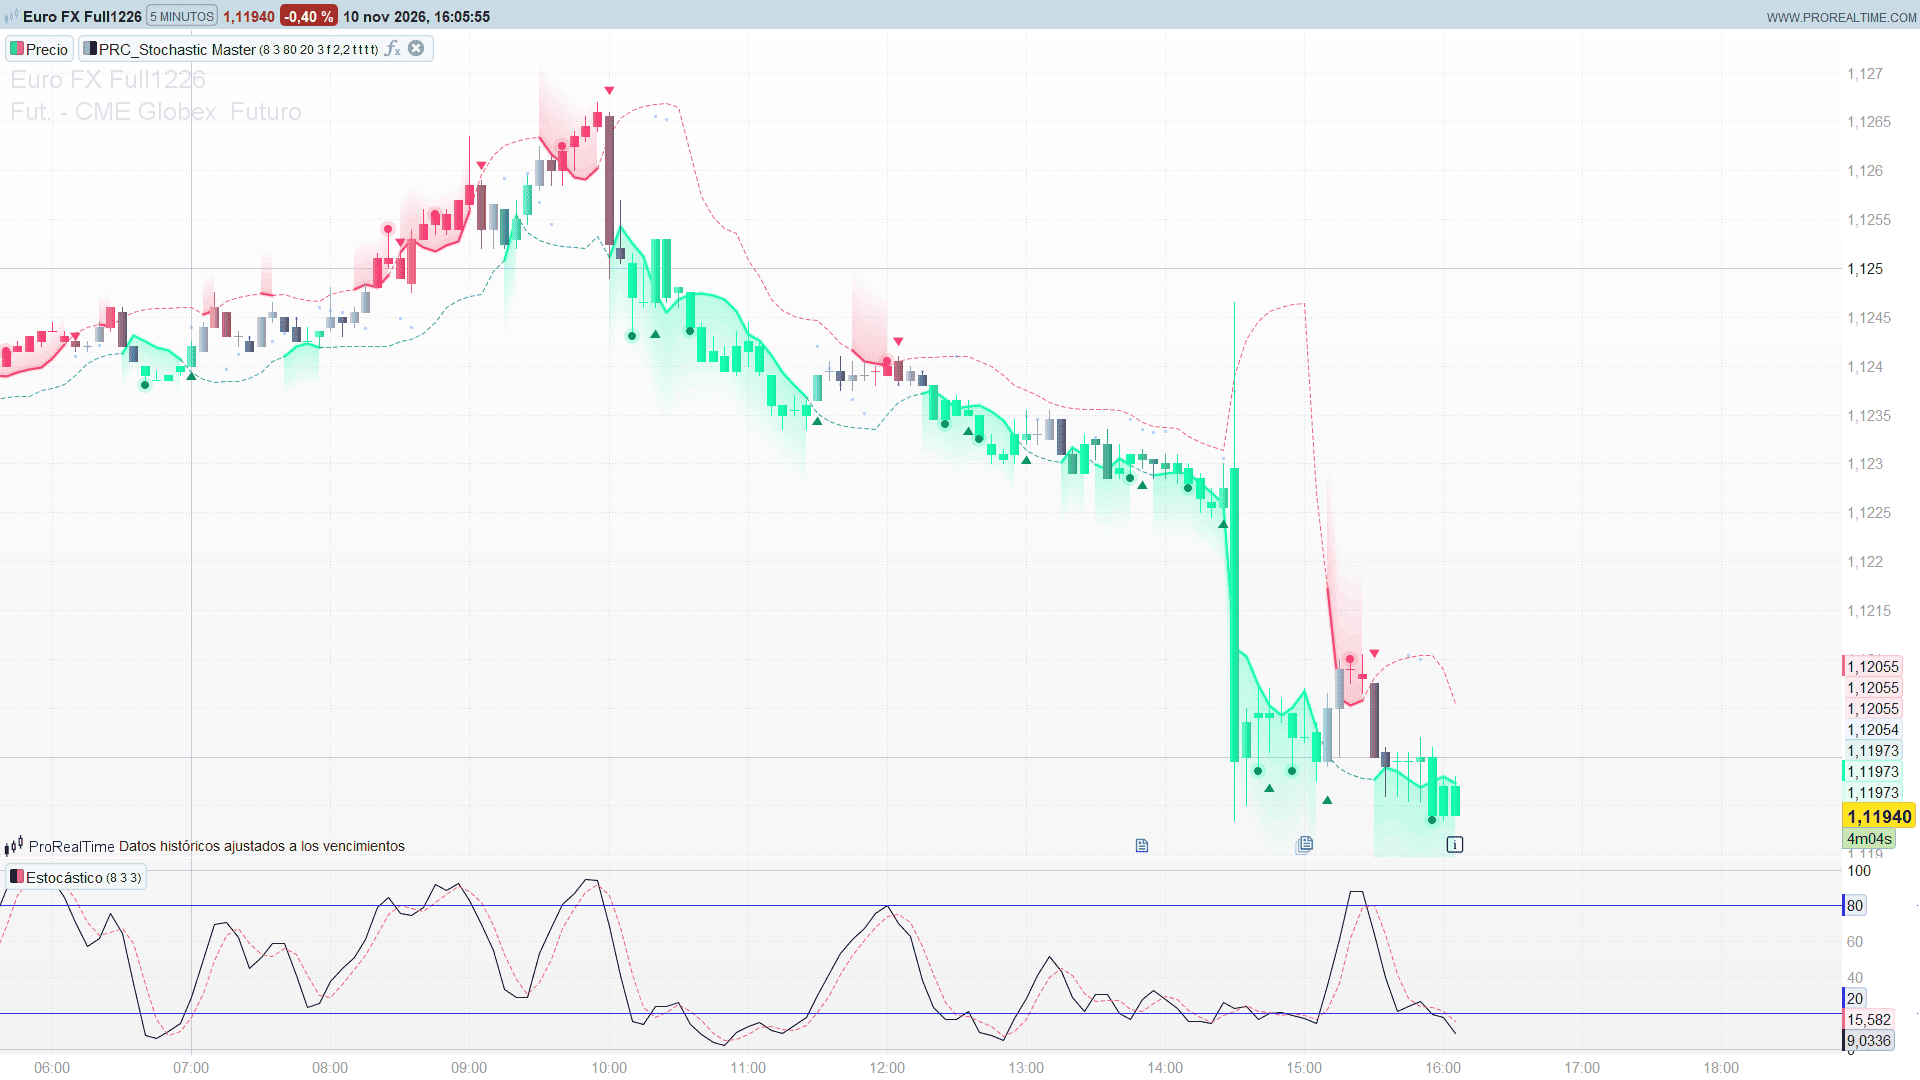
Stochastic Master answers it on the price chart. The slow stochastic can be solved backwards: knowing the last fast readings and the channel of the last bars, there is exactly one close that would put the slow %K at 80 on the next bar, and one that would put it at 20. Those prices are the edges of an overbought zone above price and an oversold zone below it. It follows the idea of RSI Master, which does the same with the RSI, and keeps its look.
There is one thing the stochastic does that the RSI does not: it cannot jump. The slow %K is an average of the last fast readings, so the next bar can only move it part of the way. When 80 is out of reach tomorrow, whatever the close, the overbought zone is not drawn and its edge turns into a dotted line resting on the high of the channel. Both lines are always on the chart: a solid line with its zone means that level is one bar away, a dotted one means it is not.
Theory Behind the Indicator
The stochastic, turned into a price. The fast %K is where the close sits in the channel of the last 14 bars: 100 × (close − lowest low) / (highest high − lowest low). The slow %K is the 3-bar average of the fast one. Tomorrow’s slow %K is the average of the two fast readings already known and tomorrow’s, so to reach a level L tomorrow’s fast %K has to be 3 × L minus the sum of those two. A fast reading is a fixed fraction of the channel tomorrow’s bar will see, the last 13 bars, so the edge is lowest low + needed / 100 × (highest high − lowest low). The edges for 80, 20 and 50 are smoothed with a 3-bar EMA.
Out of reach. If the fast reading needed is above 100 or below 0, no close gets the slow %K to that level on the next bar. The zone is hidden and the edge is drawn as a thin dotted line on the high of the channel (the low, for oversold): not even a close there would get %K to the level. With the default settings the overbought edge is within reach on roughly a third of the bars: when %K is already climbing, or already inside the zone. An edge that comes back into reach starts again from its exact value.
One assumption. The edges assume tomorrow’s bar does not set a new high or low for the channel. A bar that spikes above the channel and then closes back needs a slightly higher close to reach overbought.
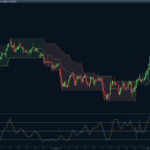
The zones, the candles, the dots and the arrows. The overbought zone glows from its edge upwards and fades out 2.2 ATR above it; the oversold zone does the same downwards. Candles stay a soft grey through the middle of the range and warm toward the overbought colour from %K 59 to 80, cool toward the oversold colour from 41 to 20. The colour shows the level of %K, not the direction of the bar. A dot marks the first close into a zone, an arrow the exit, the classic stochastic signal. Both are drawn once the bar has closed.
Key Features at a Glance
- Overbought and oversold edges computed as prices, straight from the stochastic formula
- Both edges always on the chart: solid with its zone when the level is one bar away, dotted on the channel when it is not
- Glowing zones with adjustable depth and brightness
- Candles that warm and cool with %K
- Entry dots and exit arrows, drawn on closed bars
- Five themes: Neon, Classic, Aurora, Ice and Custom
How to Read the Indicator
- Two lines, always: the upper one is the overbought edge, the lower one the oversold edge.
- A dotted line: that level cannot be reached on the next bar, whatever the close. The line rests on the high of the channel (the low, for oversold): not even a close there would do it. The move needs at least two bars.
- The line turns solid and its zone appears: the level is now one bar away, and the line is the close that does it. The distance from price to the line is the room left.
- Inside a zone: %K is above 80 (or below 20), and the line has moved to the other side of price. In oversold the mint line sits above price. It is not a resistance: it is the close that takes %K back out of oversold tomorrow, the arrow before it is drawn. In overbought the line sits below price and works the same way. With the default levels, a line that turns dotted while price is inside its zone means %K leaves the zone on the next bar, whatever the close.
- The line and the arrow do not always meet to the tick: the line is smoothed over 3 bars (smIn), and the line on a bar is the threshold for the close of the next one. With smIn = 1 the line is the exact close.
- The candles: their colour is the level of %K, not the direction of the bar. Grey from 41 to 59, lighter for up bars and darker for down bars, warming toward the overbought colour up to 80 and cooling toward the oversold colour down to 20. A bar that falls hard with %K already low is painted in the oversold colour: it tells you where %K is, not which way the bar went. A muted pink candle is a down bar with %K still high.
- Dots and arrows: a dot is the first close into a zone; an arrow is the close back out of it.
Practical Applications
- Timing an exit from overbought: while price sits inside the overbought band, the edge is the close that ends the reading. A close below it is the arrow before it is drawn.
- Patience in a trend: while the overbought line is dotted, a long entry is not about to be overbought on the next bar, whatever happens.
- Targets: the far edge is a live target for a trade taken near the opposite zone.
Indicator Configuration
Stochastic
- lenIn (default 14, 2 to 100): %K length.
- kSmIn (default 3, 1 to 10): %K smoothing. 1 is the fast stochastic: its edges are always within reach, and they are simply the 80 % and 20 % lines of the channel.
- obIn (default 80) and osIn (default 20): overbought and oversold levels.
- smIn (default 3, 1 to 10): smoothing of the zone edges, in bars.
Look
- themeIn (default 1): 1 = Neon, 2 = Classic, 3 = Aurora, 4 = Ice, 5 = Custom with the colours cuOs and cuOb.
- bright (default 3, 1 to 5): brightness of the zones and halos.
- depthIn (default 2.2, 0.5 to 6): how far the zone glow reaches past its edge, in ATRs.
- showCandles (default 1), showMid (default 0), showDots (default 1), showTurns (default 1): stochastic candles, midline (%K 50), entry dots and exit arrows.
The Code
//-----------------------------------------------------------------------
//PRC_Stochastic Master
//version = 0
//02.11.2026
//Iván González @ www.prorealcode.com
//Sharing ProRealTime knowledge
//-----------------------------------------------------------------------
// Apply ON THE PRICE CHART.
//
// The slow stochastic turned into price: the overbought and oversold edges
// are the closes that would put the slow %K exactly on those levels on the
// next bar, worked out from the stochastic formula. The overbought zone
// glows above its edge and the oversold zone below its edge; candles warm
// toward the overbought colour and cool toward the oversold colour as %K
// moves. Dots mark the first close into a zone, arrows the exits.
//
// The colour of a candle is the level of %K, not the direction of the bar:
// a bar falling hard with %K low is painted in the oversold colour.
//
// A slow %K cannot jump: it is the average of the last fast %K readings, so
// the next bar can only move it part of the way. When a level is out of
// reach on the next bar, whatever the close, its zone is not drawn and its
// edge turns into a dotted line resting on the high (overbought) or the low
// (oversold) of the channel: not even a close there gets %K to that level.
// A solid edge with its zone means that level is one bar away.
//
// The edges assume the next bar does not set a new high or low for the
// %K channel; a bar that does needs a little more.
//
// Dots and arrows are drawn on the bar where they happened once that bar
// has CLOSED (when the next one opens), so they never appear and vanish
// inside a bar.
//-----------------------------------------------------------------------

// ===================== INPUTS =====================
// --- Stochastic ---
lenIn = 14           // %K length (2 to 100)
kSmIn = 3            // %K smoothing (1 to 10): 1 = fast stochastic, 3 = slow
obIn = 80            // overbought level
osIn = 20            // oversold level
smIn = 3             // smoothing of the zone edges, in bars (1 to 10)
// --- Look ---
themeIn = 1          // 1 = Neon, 2 = Classic, 3 = Aurora, 4 = Ice, 5 = Custom (the two colours below)
cuOsR = 0            // custom oversold colour #00FFA3
cuOsG = 255
cuOsB = 163
cuObR = 255          // custom overbought colour #FF3D71
cuObG = 61
cuObB = 113
bright = 3           // brightness (1 to 5)
depthIn = 2.2        // how far the zone glow reaches past its edge, in ATRs (0.5 to 6)
showCandles = 1      // 1 = stochastic candles
showMid = 0          // 1 = midline (%K 50)
showDots = 1         // 1 = entry dots
showTurns = 1        // 1 = exit arrows

// ===================== COLOURS =====================
IF themeIn = 2 THEN
   osR = 0           // #00FF31
   osG = 255
   osB = 49
   obR = 255         // #FF0013
   obG = 0
   obB = 19
ELSIF themeIn = 3 THEN
   osR = 52          // #34D399
   osG = 211
   osB = 153
   obR = 244         // #F472B6
   obG = 114
   obB = 182
ELSIF themeIn = 4 THEN
   osR = 125         // #7DD3FC
   osG = 211
   osB = 252
   obR = 253         // #FDA4AF
   obG = 164
   obB = 175
ELSIF themeIn = 5 THEN
   osR = cuOsR
   osG = cuOsG
   osB = cuOsB
   obR = cuObR
   obG = cuObG
   obB = cuObB
ELSE
   osR = 0           // Neon: #00FFA3 oversold, #FF3D71 overbought
   osG = 255
   osB = 163
   obR = 255
   obG = 61
   obB = 113
ENDIF
brightN = max(1, min(5, round(bright)))
brightMul = 0.4 + 0.2 * brightN
// Arrows and dots sit straight on the chart: a zone colour too light to read on a white background
// (the mint, the Ice theme) is darkened just enough, to a contrast of 4 to 1 against white; a colour
// that already reads is kept
lumS = 0.2126 * pow(osR / 255, 2.2) + 0.7152 * pow(osG / 255, 2.2) + 0.0722 * pow(osB / 255, 2.2)
kS = 1
IF lumS > 0.2125 THEN
   kS = pow(0.2125 / lumS, 1 / 2.2)
ENDIF
osTR = round(osR * kS)
osTG = round(osG * kS)
osTB = round(osB * kS)
lumO = 0.2126 * pow(obR / 255, 2.2) + 0.7152 * pow(obG / 255, 2.2) + 0.0722 * pow(obB / 255, 2.2)
kO = 1
IF lumO > 0.2125 THEN
   kO = pow(0.2125 / lumO, 1 / 2.2)
ENDIF
obTR = round(obR * kO)
obTG = round(obG * kO)
obTB = round(obB * kO)

// ===================== STOCHASTIC, AND THE PRICES BEHIND IT =====================
lnK = max(2, min(100, round(lenIn)))
sK = max(1, min(10, round(kSmIn)))
smN = max(1, min(10, round(smIn)))
// ATR(14), the bar range until it exists, never below one tick
atr14 = averagetruerange[14](close)
IF barindex >= 13 THEN
   atrV = atr14
ELSE
   atrV = high - low
ENDIF
atrV = max(atrV, ticksize)
// Fast %K: where the close sits in the lnK-bar channel; a flat channel reads 50
fastK = 50
IF barindex >= lnK - 1 THEN
   hhK = highest[lnK](high)
   llK = lowest[lnK](low)
   IF hhK > llK THEN
      fastK = 100 * (close - llK) / (hhK - llK)
   ENDIF
ENDIF
// Slow %K: the average of the last sK fast readings
stoStart = lnK + sK - 2
stoOk = 0
stoV = 50
IF barindex >= stoStart THEN
   stoOk = 1
   stoV = average[sK](fastK)
ENDIF

// The close next bar that would put the slow %K exactly at a level. Tomorrow's slow %K is the average
// of the sK - 1 fast readings already known and tomorrow's one, so tomorrow's fast %K has to be
// sK * level minus their sum, and a fast reading is a fixed fraction of the channel tomorrow's bar
// will see, the last lnK - 1 bars. Needing more than 100 or less than 0 means the level is out of reach
// on the next bar: the edge is parked on the high or the low of the channel and drawn dotted
obRaw = close
osRaw = close
midRaw = close
obRch = 0
osRch = 0
midRch = 0
IF stoOk = 1 THEN
   IF sK >= 2 THEN
      prevSum = summation[sK - 1](fastK)
   ELSE
      prevSum = 0
   ENDIF
   hhP = highest[lnK - 1](high)
   llP = lowest[lnK - 1](low)
   needV = sK * obIn - prevSum
   IF needV >= 0 AND needV <= 100 THEN
      obRch = 1
   ENDIF
   obRaw = llP + min(max(needV, 0), 100) / 100 * (hhP - llP)
   needV = sK * osIn - prevSum
   IF needV >= 0 AND needV <= 100 THEN
      osRch = 1
   ENDIF
   osRaw = llP + min(max(needV, 0), 100) / 100 * (hhP - llP)
   needV = sK * 50 - prevSum
   IF needV >= 0 AND needV <= 100 THEN
      midRch = 1
   ENDIF
   midRaw = llP + min(max(needV, 0), 100) / 100 * (hhP - llP)
ENDIF
// EMA of each edge, seeded with the simple mean of its first smN values. An edge that comes back into
// reach starts again from its exact value, not from where it was parked
lvlStart = stoStart + smN - 1
aSm = 2 / (smN + 1)
lvlOk = 0
IF barindex = lvlStart THEN
   obE = summation[smN](obRaw) / smN
   osE = summation[smN](osRaw) / smN
   midE = summation[smN](midRaw) / smN
ELSIF barindex > lvlStart THEN
   IF obRch = 1 AND obRch[1] = 0 THEN
      obE = obRaw
   ELSE
      obE = obE + aSm * (obRaw - obE)
   ENDIF
   IF osRch = 1 AND osRch[1] = 0 THEN
      osE = osRaw
   ELSE
      osE = osE + aSm * (osRaw - osE)
   ENDIF
   IF midRch = 1 AND midRch[1] = 0 THEN
      midE = midRaw
   ELSE
      midE = midE + aSm * (midRaw - midE)
   ENDIF
ENDIF
IF barindex >= lvlStart THEN
   lvlOk = 1
ELSE
   obE = close
   osE = close
   midE = close
ENDIF

inOB = 0
inOS = 0
IF stoOk = 1 THEN
   IF stoV >= obIn THEN
      inOB = 1
   ENDIF
   IF stoV <= osIn THEN
      inOS = 1
   ENDIF
ENDIF
enterOB = 0
exitOB = 0
enterOS = 0
exitOS = 0
IF barindex > stoStart THEN
   IF inOB = 1 AND inOB[1] = 0 THEN
      enterOB = 1
   ENDIF
   IF inOB = 0 AND inOB[1] = 1 THEN
      exitOB = 1
   ENDIF
   IF inOS = 1 AND inOS[1] = 0 THEN
      enterOS = 1
   ENDIF
   IF inOS = 0 AND inOS[1] = 1 THEN
      exitOS = 1
   ENDIF
ENDIF

// ===================== DRAWING =====================
// --- The zones: full at the edge, fading away from price, in bands of constant opacity. A zone out
// of reach on the next bar is not drawn ---
obTop = obE + depthIn * atrV
osBot = osE - depthIn * atrV
zA = 0
IF lvlOk = 1 THEN
   zA = round(255 * min(max(0.26 * brightMul, 0), 1))
ENDIF
zAo = zA * obRch
zAs = zA * osRch
zStep = depthIn * atrV / 8
COLORBETWEEN(obE, obE + zStep, obR, obG, obB, round(zAo * 15 / 16))
COLORBETWEEN(obE + zStep, obE + 2 * zStep, obR, obG, obB, round(zAo * 13 / 16))
COLORBETWEEN(obE + 2 * zStep, obE + 3 * zStep, obR, obG, obB, round(zAo * 11 / 16))
COLORBETWEEN(obE + 3 * zStep, obE + 4 * zStep, obR, obG, obB, round(zAo * 9 / 16))
COLORBETWEEN(obE + 4 * zStep, obE + 5 * zStep, obR, obG, obB, round(zAo * 7 / 16))
COLORBETWEEN(obE + 5 * zStep, obE + 6 * zStep, obR, obG, obB, round(zAo * 5 / 16))
COLORBETWEEN(obE + 6 * zStep, obE + 7 * zStep, obR, obG, obB, round(zAo * 3 / 16))
COLORBETWEEN(obE + 7 * zStep, obTop, obR, obG, obB, round(zAo * 1 / 16))
COLORBETWEEN(osE, osE - zStep, osR, osG, osB, round(zAs * 15 / 16))
COLORBETWEEN(osE - zStep, osE - 2 * zStep, osR, osG, osB, round(zAs * 13 / 16))
COLORBETWEEN(osE - 2 * zStep, osE - 3 * zStep, osR, osG, osB, round(zAs * 11 / 16))
COLORBETWEEN(osE - 3 * zStep, osE - 4 * zStep, osR, osG, osB, round(zAs * 9 / 16))
COLORBETWEEN(osE - 4 * zStep, osE - 5 * zStep, osR, osG, osB, round(zAs * 7 / 16))
COLORBETWEEN(osE - 5 * zStep, osE - 6 * zStep, osR, osG, osB, round(zAs * 5 / 16))
COLORBETWEEN(osE - 6 * zStep, osE - 7 * zStep, osR, osG, osB, round(zAs * 3 / 16))
COLORBETWEEN(osE - 7 * zStep, osBot, osR, osG, osB, round(zAs * 1 / 16))

// --- The candles: a soft neutral through the middle of the range, warming to the overbought colour
// over the last stretch before the zone and cooling to the oversold colour on the way down, with up
// candles a shade brighter than down candles ---
IF showCandles = 1 AND stoOk = 1 THEN
   IF close >= open THEN
      nuR = 163       // #A3ABBD
      nuG = 171
      nuB = 189
   ELSE
      nuR = 95        // #5F6677
      nuG = 102
      nuB = 119
   ENDIF
   warmFrom = 50 + (obIn - 50) * 0.3
   coolFrom = 50 - (50 - osIn) * 0.3
   IF stoV >= 50 THEN
      tW = pow(min(max((stoV - warmFrom) / (obIn - warmFrom), 0), 1), 1.4)
      cdR = nuR + (obR - nuR) * tW
      cdG = nuG + (obG - nuG) * tW
      cdB = nuB + (obB - nuB) * tW
   ELSE
      tC = pow(min(max((coolFrom - stoV) / (coolFrom - osIn), 0), 1), 1.4)
      cdR = nuR + (osR - nuR) * tC
      cdG = nuG + (osG - nuG) * tC
      cdB = nuB + (osB - nuB) * tC
   ENDIF
   DRAWCANDLE(open, high, low, close) COLOURED(cdR, cdG, cdB) BORDERCOLOR(cdR, cdG, cdB)
ENDIF

// --- Exit arrows: when price flickers in and out of a zone over a few bars, only the first exit gets
// an arrow ---
ONCE lastArOB = 0 - 10
ONCE lastArOS = 0 - 10
arrowOB = 0
arrowOS = 0
IF exitOB = 1 AND barindex - lastArOB > 3 THEN
   arrowOB = 1
   lastArOB = barindex
ENDIF
IF exitOS = 1 AND barindex - lastArOS > 3 THEN
   arrowOS = 1
   lastArOS = barindex
ENDIF

// --- Events of the bar that has just CLOSED (offset 1), drawn on that bar ---
IF barindex > lvlStart THEN
   xE = barindex - 1
   // The first close into a zone: a soft halo and a solid dot
   IF showDots = 1 AND enterOB[1] = 1 THEN
      DRAWPOINT(xE, high[1], 4) COLOURED(obR, obG, obB, round(255 * min(0.18 * brightMul, 1)))
      DRAWPOINT(xE, high[1], 2) COLOURED(obTR, obTG, obTB, 255)
   ENDIF
   IF showDots = 1 AND enterOS[1] = 1 THEN
      DRAWPOINT(xE, low[1], 4) COLOURED(osR, osG, osB, round(255 * min(0.18 * brightMul, 1)))
      DRAWPOINT(xE, low[1], 2) COLOURED(osTR, osTG, osTB, 255)
   ENDIF
   // Where price leaves a zone: down out of overbought, up out of oversold
   IF showTurns = 1 AND arrowOB[1] = 1 THEN
      DRAWTEXT("▼", xE, high[1] + 0.5 * atrV[1], dialog, bold, 12) COLOURED(obTR, obTG, obTB, 255)
   ENDIF
   IF showTurns = 1 AND arrowOS[1] = 1 THEN
      DRAWTEXT("▲", xE, low[1] - 0.5 * atrV[1], dialog, bold, 12) COLOURED(osTR, osTG, osTB, 255)
   ENDIF
ENDIF

// --- Returned series: both edges are always on the chart. Within reach an edge is a solid line with
// a soft halo; out of reach it is a thin dotted line, in the darker tone of the arrows, resting on
// the channel. The midline is shown only while 50 is within reach. Before the stochastic exists they
// all sit on the close with alpha 0, so they do not squash the price scale ---
edA = 0
glA = 0
dtA = 0
IF lvlOk = 1 THEN
   edA = 255
   glA = round(255 * min(max(0.16 * brightMul, 0), 1))
   dtA = 200
ENDIF
mdA = 0
IF showMid = 1 AND lvlOk = 1 THEN
   mdA = 115 * midRch
ENDIF
edAo = edA * obRch
glAo = glA * obRch
dtAo = dtA * (1 - obRch)
edAs = edA * osRch
glAs = glA * osRch
dtAs = dtA * (1 - osRch)

RETURN obE COLOURED(obR, obG, obB, glAo) STYLE(line, 5) AS "Overbought glow", obE COLOURED(obR, obG, obB, edAo) STYLE(line, 2) AS "Overbought", obE COLOURED(obTR, obTG, obTB, dtAo) STYLE(dottedline, 1) AS "Overbought out of reach", osE COLOURED(osR, osG, osB, glAs) STYLE(line, 5) AS "Oversold glow", osE COLOURED(osR, osG, osB, edAs) STYLE(line, 2) AS "Oversold", osE COLOURED(osTR, osTG, osTB, dtAs) STYLE(dottedline, 1) AS "Oversold out of reach", midE COLOURED(123, 156, 255, mdA) STYLE(point, 1) AS "Midline"