

PRT Bands Stochastic Oscillator
The PRT Bands Stochastic Oscillator is a momentum indicator that applies stochastic normalization to ProRealTime’s native PRT Bands indicator. It transforms the short-term band component into a bounded 0-100 oscillator, making it easier to identify overbought and oversold conditions within the context of the PRT Bands framework.
This indicator answers a simple question: where is the short-term price action positioned relative to the upper and lower PRT Bands?
What Are PRT Bands?
PRT Bands is a proprietary indicator built into ProRealTime. It consists of three components:
- PRTBANDSUP is the upper band representing an upper price boundary based on ProRealTime’s internal calculation.
- PRTBANDSDOWN is the lower band representing a lower price boundary.
- PRTBANDSSHORTTERM is a short-term value that oscillates between the upper and lower bands, reflecting recent price momentum.
The exact formulas for PRT Bands are proprietary to ProRealTime, but the bands function similarly to other envelope-style indicators by defining dynamic support and resistance zones.
The Stochastic Concept
The classic Stochastic Oscillator, developed by George Lane in the 1950s, measures where the current close is relative to the high-low range over a given period. The formula is:
%K = 100 × (Close – Lowest Low) / (Highest High – Lowest Low)
This produces a value between 0 and 100, where readings above 80 suggest overbought conditions and readings below 20 suggest oversold conditions.
Reference: “Lane’s Stochastics” by George Lane, Technical Analysis of Stocks & Commodities magazine.
How This Indicator Works
The PRT Bands Stochastic Oscillator applies the same normalization concept but uses the PRT Bands components instead of raw price highs and lows.
The formula is:
Oscillator = 100 × (PRTBANDSSHORTTERM – PRTBANDSDOWN) / (PRTBANDSUP – PRTBANDSDOWN)
- When PRTBANDSSHORTTERM is at the lower band, the oscillator reads 0.
- When PRTBANDSSHORTTERM is at the upper band, the oscillator reads 100.
- When PRTBANDSSHORTTERM is exactly midway between the bands, the oscillator reads 50.
The result is clamped between 0 and 100 to handle any edge cases where the short-term value might temporarily exceed the bands.
Smoothing
A simple moving average is applied to the raw oscillator to reduce noise and improve readability. The smoothLen parameter controls this smoothing.
- Lower values (2-3) keep the indicator reactive for short-term trading.
- Higher values (5-8) produce smoother output better suited for swing trading.
Interpretation
The oscillator includes three reference levels for interpretation:
- The 80 level marks the overbought zone. When the oscillator is above 80, the short-term component is near the upper band, suggesting price may be extended to the upside.
- The 20 level marks the oversold zone. When the oscillator is below 20, the short-term component is near the lower band, suggesting price may be extended to the downside.
- The 50 level marks the midpoint. Crossovers above or below 50 can signal momentum shifts.
Trading Applications
- For mean reversion strategies, look for the oscillator to enter overbought territory (above 80) then turn down, or enter oversold territory (below 20) then turn up. These reversals can signal potential pullback opportunities.
- For trend following strategies, use the 50 level as a filter. Only take long trades when the oscillator is above 50 (short-term strength). Only take short trades when the oscillator is below 20 (short-term weakness).
- For divergence analysis, compare the oscillator peaks and troughs to price peaks and troughs. When price makes a higher high but the oscillator makes a lower high, this bearish divergence may signal weakening momentum. The opposite pattern creates bullish divergence.
Parameters
smoothLen controls the smoothing period applied to the raw oscillator. Range is 1 to 10, default is 3. Set to 1 for no smoothing.
Display
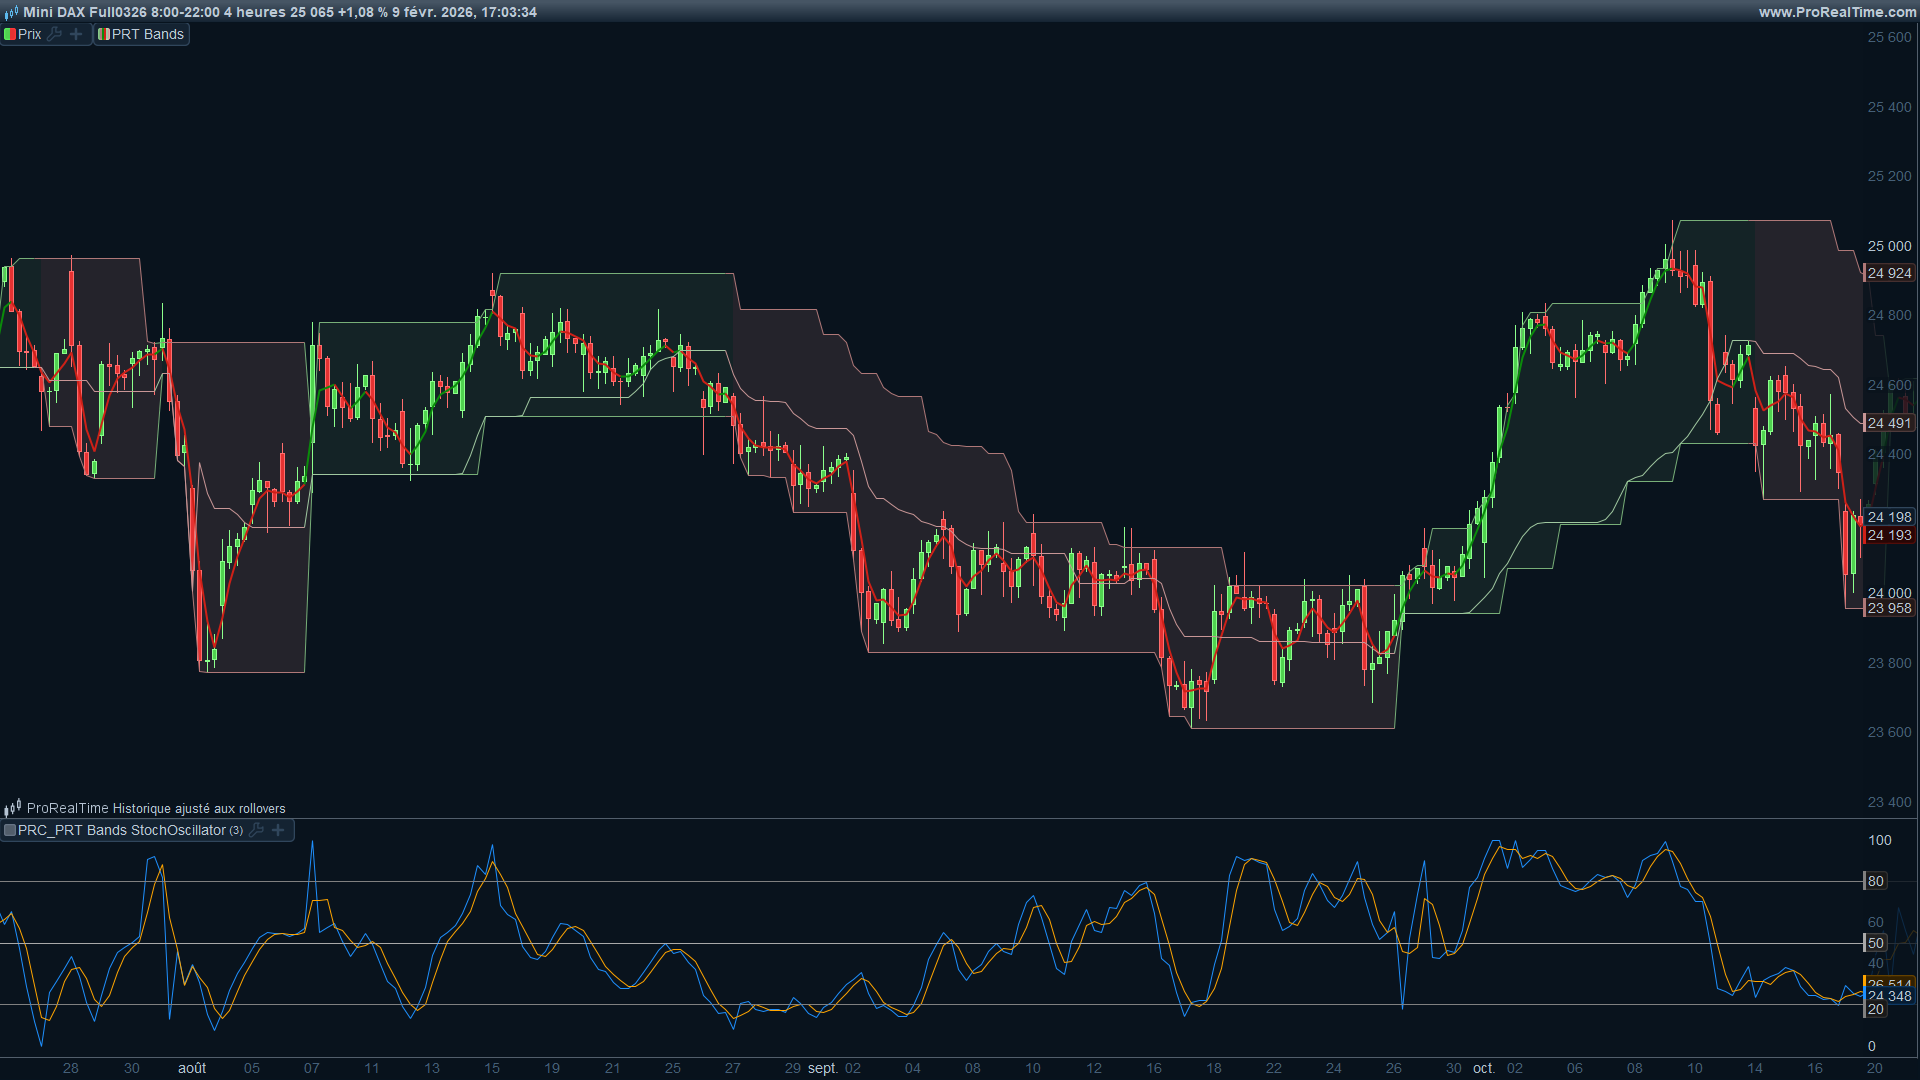
The indicator displays five elements:
- The raw oscillator is shown in dodger blue.
- The smoothed oscillator is shown in orange.
- The overbought level (80) is shown in gray.
- The oversold level (20) is shown in gray.
- The midline (50) is shown in dark gray.
Why Use This Instead of Standard Stochastic?
The standard Stochastic Oscillator uses raw price highs and lows which can be noisy, especially on lower timeframes. By using the PRT Bands as the normalization boundaries, this indicator inherits whatever smoothing and calculation logic ProRealTime has built into their proprietary bands.
The result is often a cleaner oscillator that still captures the essential momentum information.
Feedback Welcome
This is version 1.0. If you have suggestions for enhancements or find interesting applications for this indicator, please share in the comments below.
// PRT Bands Stochastic Oscillator
// https://www.prorealcode.com
// Sharing ProRealTime Knowledge
// Version: 1.0
// Author: Nicolas
// Platform: ProRealTime
// ====================================

/*
PRT Bands Stochastic Oscillator (Short-Term)
- Uses PRTBANDSUP / PRTBANDSDOWN as boundaries
- Uses PRTBANDSSHORTTERM as the value being normalized (stochastic-like)
- Outputs a 0..100 oscillator with basic zones
*/

// --- Inputs ---
smoothLen = 3 // small smoothing for short-term readability

// --- Required components ---
upBand   = PRTBANDSUP
lowBand  = PRTBANDSDOWN
shortVal = PRTBANDSSHORTTERM

irange = upBand - lowBand

// Stochastic-like normalization of shortVal between lowBand and upBand
osc = 100 * (shortVal - lowBand) / irange
osc = MAX(0, MIN(100, osc))

// smoothing (simple moving average)
oscSm = average[smoothLen](osc)

// --- Reference levels ---
obLevel = 80
osLevel = 20
midLevel = 50

// --- Plot ---
RETURN osc COLOURED("dodgerblue"), oscSm COLOURED("orange"), obLevel COLOURED("gray"), osLevel COLOURED("gray"), midLevel COLOURED("darkgray")