FluidTrades - SMC Lite
Introduction
Most Smart Money Concepts indicators try to draw everything at once: order blocks, fair value gaps, liquidity sweeps, internal and external structure, three timeframes of each. This one draws three things, and that restraint is the reason it is worth reading.
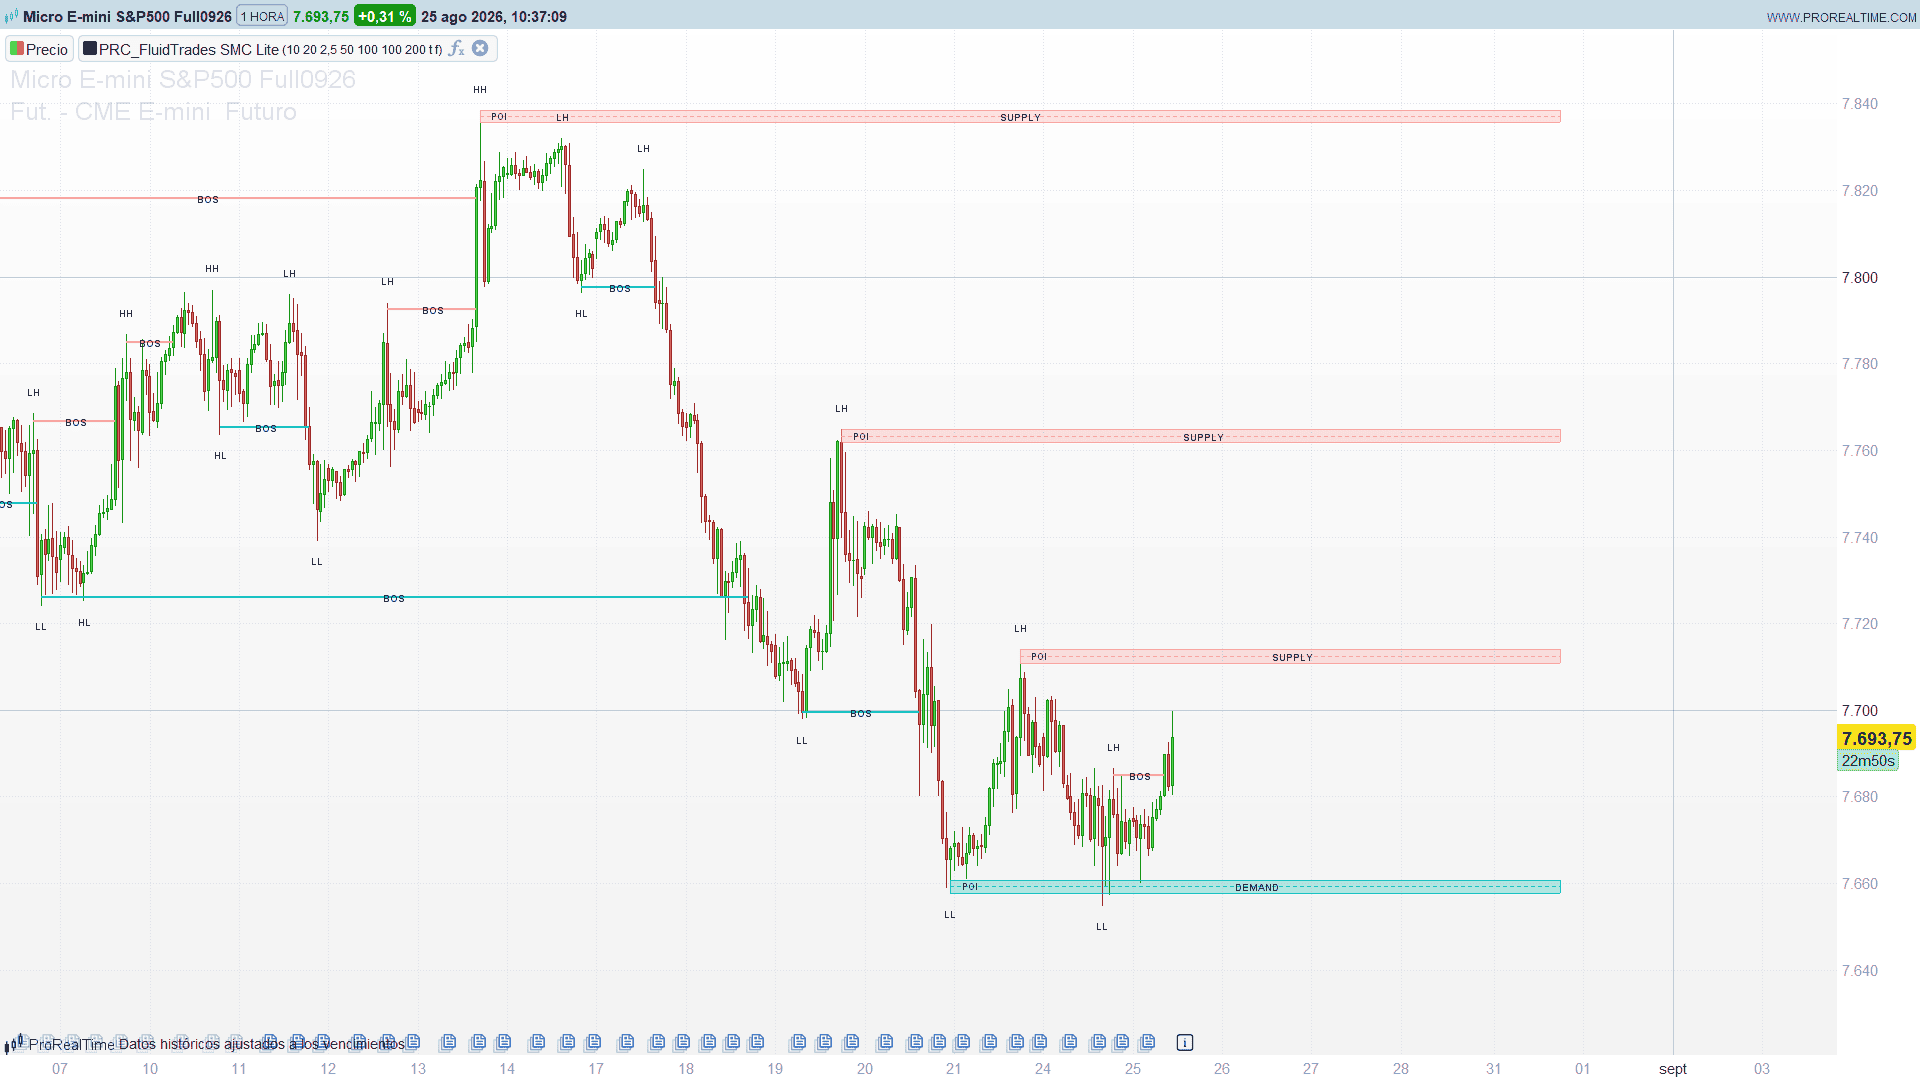
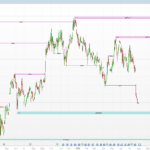
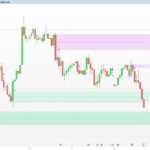
A swing high opens a supply zone. A swing low opens a demand zone. When a candle closes through a zone, the zone disappears and leaves a horizontal line labelled BOS — break of structure — where its midpoint used to be.
That is the whole indicator. Optional extras — a zigzag between pivots and HH / LH / HL / LL labels — ship switched off.
It is a price overlay and it works on any instrument and timeframe with enough history.
The Three Moving Parts
Pivots. A confirmed swing high needs ten bars on each side of it, so it appears ten bars after the fact. That delay is not a defect, it is the price of confirmation: a high is only a high once the market has failed to beat it for ten bars.
Zone geometry. The zone hangs off the pivot and is one quarter of an ATR(50) thick:
supply:  top = swing high,  bottom = top − ATR × boxWidth / 10
demand:  bottom = swing low, top = bottom + ATR × boxWidth / 10
POI    = (top + bottom) / 2
Thickness scales with volatility, so the same setting produces a proportionate zone on a quiet stock and on a nervous futures contract. The POI — point of interest — is the midpoint, the line most people actually use as the entry trigger.
The break. The test is on the close, not the wick:
supply is broken when close ≥ zone top
demand is broken when close ≤ zone bottom
A wick through the zone leaves it standing. Only a body closing beyond it kills the zone and prints the BOS.
The Overlap Filter, Which Is the Part Worth Stealing
A ten-bar pivot is a common event. Without some form of filtering, a ranging market would carpet the chart with overlapping zones within a couple of hundred bars. The way this indicator avoids that is the most transferable idea in it.
It does not filter by age, by distance in ticks, or by a maximum count. It compares the new POI against the POI of every zone still alive, and rejects the new one if it lands within two ATRs.
Density measured in volatility, not in price units. On a quiet instrument two ATRs is a small distance and zones may sit close together; on a violent one they are forced far apart. It is the same normalisation trick that makes a percentile threshold portable, applied to spacing instead of to a level, and you can bolt it onto any tool of yours that draws repeated levels.
Settings
swingLen (10). The main dial. It sets how many bars a pivot needs on each side, which controls both how many zones you get and how long you wait for them. Raise it to 20 and you get half as many zones, all of them anchored to swings you would have marked by hand; drop it to 5 and the chart fills with minor structure. Everything else in this indicator is downstream of this number.
histKeep (20). Slots per side. Live and broken zones share them, but only the live ones block the overlap filter, so this is really a cap on how many zones can be on screen at once.
boxWidth (2.5). Zone thickness as ATR × boxWidth / 10, so 2.5 means a quarter of an ATR. Thicker zones are easier to hit and harder to break; thinner ones give a tighter entry and break more often.
atrLen (50). Feeds both the thickness and the two-ATR radius of the overlap filter. A shorter ATR makes the whole thing more reactive to the current regime, and noticeably denser after a volatility collapse.
extRight (100). How far live zones extend to the right. TradingView extends them to the edge of the chart; ProBuilder needs a finite number.
maxBos (100) and maxPiv (200). How many break lines and how many pivots are kept for drawing. Pine keeps every BOS ever drawn up to 500 objects; a hundred covers several years of daily bars. Lower it to 30 or 40 if the chart feels slow on a dense intraday timeframe.
showLabels / showZigZag (0 / 0). The two decorations, off by default as in the original.
Colours are RGB triplets at the top. The text is dark grey (40, 40, 40) rather than the original’s white, because the white was only readable against a coloured box that no longer exists — on a pale fill it disappears. Raise the values if you run a dark theme.
Notes and Limitations
Warm-up. No zone before bar atrLen + 2 × swingLen + 3, which is 74 bars with the defaults.
One bar of lag on everything, the BOS included, as explained above.
Broken zones leave no historical trace. With drawonlastbaronly, only the zones alive on the last bar are drawn. The BOS lines are the record of what died; the zone rectangles themselves are not redrawn in the past.
A single BOS buffer. The original keeps five supply breaks and five demand breaks in separate arrays, but as explained above those numbers do not limit what stays on the chart. This version keeps a hundred in one array tagged by side, which approximates the real behaviour without letting the object count run away.
It is not a system. A zone is a place where price previously turned, nothing more. The indicator has no concept of trend, no filter on which side of the market you should be taking, and no notion of whether a zone has already been tested. Used as a signal generator on its own it will have you buying demand in a downtrend for as long as the downtrend lasts.
The ProBuilder Code
//----------------------------------------------------------------------//
//PRC_FluidTrades SMC Lite
//version = 0
//30.07.26
//Ivan Gonzalez @ www.prorealcode.com
//Sharing ProRealTime knowledge
//Indicador OVERLAY: marcar "en precio" en el editor
//----------------------------------------------------------------------//
defparam drawonlastbaronly = true
//-----Ajustes----------------------------------------------------------//
swingLen   = 10    //Swing High/Low Length (1..50)
histKeep   = 20    //History To Keep: zonas guardadas por lado (5..50)
boxWidth   = 2.5   //Supply/Demand Box Width (1..10, paso 0.5)
atrLen     = 50    //Periodo del ATR (altura de zona + filtro de solape)
extRight   = 100   //Barras de extension de las zonas hacia la derecha
maxBos     = 100   //BOS conservados (Pine los expulsa del array pero NO los borra)
maxPiv     = 200   //Pivotes conservados (etiquetas + zigzag)
showLabels = 0     //1 = etiquetas HH / LH / HL / LL
showZigZag = 0     //1 = zigzag entre pivotes
//-----Colores----------------------------------------------------------//
supR = 250         //Supply
supG = 150
supB = 150
demR = 0           //Demand
demG = 190
demB = 190
txtR = 40          //Texto SUPPLY / DEMAND / POI / BOS
txtG = 40
txtB = 40
zzR  = 0           //Zig Zag
zzG  = 0
zzB  = 0
//----------------------------------------------------------------------//
atrV   = averagetruerange[atrLen](close)
pivWin = 2 * swingLen + 1
pivOff = swingLen + 1
warmup = atrLen + pivWin + 2

hiWin = highest[pivWin](high)
loWin = lowest[pivWin](low)

//-----Semilla del estado global----------------------------------------//
IF barindex = 0 THEN
   $gS[0] = 0 - 1   //ultima barra procesada
   $gS[1] = 0       //zonas supply registradas
   $gS[2] = 0       //zonas demand registradas
   $gS[3] = 0       //BOS guardados
   $gS[4] = 0       //pivotes guardados
   $gS[5] = 0       //ultimo swing high (clasificacion HH/LH)
   $gS[6] = 0       //ultimo swing low  (clasificacion HL/LL)
ENDIF

//----------------------------------------------------------------------//
//MOTOR: una sola pasada por barra, siempre sobre la barra CERRADA
//----------------------------------------------------------------------//
IF barindex > warmup AND barindex > $gS[0] THEN
   $gS[0] = barindex
   nSup = $gS[1]
   nDem = $gS[2]
   nBos = $gS[3]
   nPiv = $gS[4]

   atrBuf = atrV[1] * boxWidth / 10   //altura de la zona
   atrThr = atrV[1] * 2               //radio del filtro de solape
   cls    = close[1]

   //-----1. pivote confirmado------------------------------------------//
   pvTy = 0
   pvY  = 0
   pvX  = 0
   IF high[pivOff] = hiWin[1] THEN
      pvTy = 1
      pvY  = high[pivOff]
      pvX  = barindex - pivOff
   ELSIF low[pivOff] = loWin[1] THEN
      pvTy = 0 - 1
      pvY  = low[pivOff]
      pvX  = barindex - pivOff
   ENDIF

   //-----2. registro del pivote + clasificacion HH/LH/HL/LL------------//
   IF pvTy <> 0 THEN
      IF nPiv >= maxPiv THEN
         FOR m = 1 TO nPiv - 1 DO
            $pX[m] = $pX[m+1]
            $pY[m] = $pY[m+1]
            $pT[m] = $pT[m+1]
            $pL[m] = $pL[m+1]
         NEXT
         nPiv = nPiv - 1
      ENDIF
      nPiv = nPiv + 1
      $pX[nPiv] = pvX
      $pY[nPiv] = pvY
      $pT[nPiv] = pvTy
      IF pvTy = 1 THEN
         IF pvY >= $gS[5] THEN
            $pL[nPiv] = 1
         ELSE
            $pL[nPiv] = 0
         ENDIF
         $gS[5] = pvY
      ELSE
         IF pvY >= $gS[6] THEN
            $pL[nPiv] = 1
         ELSE
            $pL[nPiv] = 0
         ENDIF
         $gS[6] = pvY
      ENDIF
   ENDIF

   //-----3. nuevo swing high -> zona SUPPLY----------------------------//
   IF pvTy = 1 THEN
      newTop = pvY
      newBot = newTop - atrBuf
      newMid = (newTop + newBot) / 2

      okDraw = 1
      FOR k = 1 TO nSup DO
         IF $sOn[k] = 1 AND newMid >= $sMid[k] - atrThr AND newMid <= $sMid[k] + atrThr THEN
            okDraw = 0
         ENDIF
      NEXT

      IF okDraw = 1 THEN
         IF nSup >= histKeep THEN
            FOR m = 1 TO nSup - 1 DO
               $sTop[m] = $sTop[m+1]
               $sBot[m] = $sBot[m+1]
               $sMid[m] = $sMid[m+1]
               $sX1[m]  = $sX1[m+1]
               $sOn[m]  = $sOn[m+1]
            NEXT
            nSup = nSup - 1
         ENDIF
         nSup = nSup + 1
         $sTop[nSup] = newTop
         $sBot[nSup] = newBot
         $sMid[nSup] = newMid
         $sX1[nSup]  = pvX
         $sOn[nSup]  = 1
      ENDIF
   ENDIF

   //-----4. nuevo swing low -> zona DEMAND-----------------------------//
   IF pvTy = 0 - 1 THEN
      newBot = pvY
      newTop = newBot + atrBuf
      newMid = (newTop + newBot) / 2

      okDraw = 1
      FOR k = 1 TO nDem DO
         IF $dOn[k] = 1 AND newMid >= $dMid[k] - atrThr AND newMid <= $dMid[k] + atrThr THEN
            okDraw = 0
         ENDIF
      NEXT

      IF okDraw = 1 THEN
         IF nDem >= histKeep THEN
            FOR m = 1 TO nDem - 1 DO
               $dTop[m] = $dTop[m+1]
               $dBot[m] = $dBot[m+1]
               $dMid[m] = $dMid[m+1]
               $dX1[m]  = $dX1[m+1]
               $dOn[m]  = $dOn[m+1]
            NEXT
            nDem = nDem - 1
         ENDIF
         nDem = nDem + 1
         $dTop[nDem] = newTop
         $dBot[nDem] = newBot
         $dMid[nDem] = newMid
         $dX1[nDem]  = pvX
         $dOn[nDem]  = 1
      ENDIF
   ENDIF

   //-----5. ruptura: la zona muere y deja un BOS en su POI--------------//
   FOR k = 1 TO nSup DO
      IF $sOn[k] = 1 AND cls >= $sTop[k] THEN
         $sOn[k] = 0
         IF nBos >= maxBos THEN
            FOR m = 1 TO nBos - 1 DO
               $boX1[m] = $boX1[m+1]
               $boX2[m] = $boX2[m+1]
               $boY[m]  = $boY[m+1]
               $boT[m]  = $boT[m+1]
            NEXT
            nBos = nBos - 1
         ENDIF
         nBos = nBos + 1
         $boX1[nBos] = $sX1[k]
         $boX2[nBos] = barindex - 1
         $boY[nBos]  = $sMid[k]
         $boT[nBos]  = 1
      ENDIF
   NEXT

   FOR k = 1 TO nDem DO
      IF $dOn[k] = 1 AND cls <= $dBot[k] THEN
         $dOn[k] = 0
         IF nBos >= maxBos THEN
            FOR m = 1 TO nBos - 1 DO
               $boX1[m] = $boX1[m+1]
               $boX2[m] = $boX2[m+1]
               $boY[m]  = $boY[m+1]
               $boT[m]  = $boT[m+1]
            NEXT
            nBos = nBos - 1
         ENDIF
         nBos = nBos + 1
         $boX1[nBos] = $dX1[k]
         $boX2[nBos] = barindex - 1
         $boY[nBos]  = $dMid[k]
         $boT[nBos]  = 0 - 1
      ENDIF
   NEXT

   $gS[1] = nSup
   $gS[2] = nDem
   $gS[3] = nBos
   $gS[4] = nPiv
ENDIF

//----------------------------------------------------------------------//
//DIBUJO
//----------------------------------------------------------------------//
IF islastbarupdate THEN
   xR   = barindex + extRight
   nSup = $gS[1]
   nDem = $gS[2]
   nBos = $gS[3]
   nPiv = $gS[4]

   //-----zonas SUPPLY vivas--------------------------------------------//
   FOR k = 1 TO nSup DO
      IF $sOn[k] = 1 THEN
         DRAWRECTANGLE($sX1[k], $sTop[k], xR, $sBot[k]) COLOURED(supR, supG, supB, 200) FILLCOLOR(supR, supG, supB, 70)
         DRAWSEGMENT($sX1[k], $sMid[k], xR, $sMid[k]) COLOURED(supR, supG, supB, 220) STYLE(dottedline, 1)
         DRAWTEXT("SUPPLY", ($sX1[k] + xR) / 2, $sMid[k], sansserif, bold, 10) COLOURED(txtR, txtG, txtB, 255)
         DRAWTEXT("POI", $sX1[k] + 5, $sMid[k], sansserif, standard, 9) COLOURED(txtR, txtG, txtB, 200)
      ENDIF
   NEXT

   //-----zonas DEMAND vivas--------------------------------------------//
   FOR k = 1 TO nDem DO
      IF $dOn[k] = 1 THEN
         DRAWRECTANGLE($dX1[k], $dTop[k], xR, $dBot[k]) COLOURED(demR, demG, demB, 200) FILLCOLOR(demR, demG, demB, 70)
         DRAWSEGMENT($dX1[k], $dMid[k], xR, $dMid[k]) COLOURED(demR, demG, demB, 220) STYLE(dottedline, 1)
         DRAWTEXT("DEMAND", ($dX1[k] + xR) / 2, $dMid[k], sansserif, bold, 10) COLOURED(txtR, txtG, txtB, 255)
         DRAWTEXT("POI", $dX1[k] + 5, $dMid[k], sansserif, standard, 9) COLOURED(txtR, txtG, txtB, 200)
      ENDIF
   NEXT

   //-----BOS-----------------------------------------------------------//
   FOR k = 1 TO nBos DO
      IF $boT[k] = 1 THEN
         DRAWSEGMENT($boX1[k], $boY[k], $boX2[k], $boY[k]) COLOURED(supR, supG, supB, 255) STYLE(line, 2)
      ELSE
         DRAWSEGMENT($boX1[k], $boY[k], $boX2[k], $boY[k]) COLOURED(demR, demG, demB, 255) STYLE(line, 2)
      ENDIF
      DRAWTEXT("BOS", ($boX1[k] + $boX2[k]) / 2, $boY[k], sansserif, bold, 10) COLOURED(txtR, txtG, txtB, 255)
   NEXT

   //-----zigzag entre pivotes------------------------------------------//
   IF showZigZag = 1 AND nPiv >= 2 THEN
      FOR k = 2 TO nPiv DO
         DRAWSEGMENT($pX[k-1], $pY[k-1], $pX[k], $pY[k]) COLOURED(zzR, zzG, zzB, 255) STYLE(line, 2)
      NEXT
   ENDIF

   //-----etiquetas de estructura---------------------------------------//
   IF showLabels = 1 THEN
      FOR k = 1 TO nPiv DO
         IF $pT[k] = 1 THEN
            IF $pL[k] = 1 THEN
               DRAWTEXT("HH", $pX[k], $pY[k] + atrV * 0.4, sansserif, bold, 9) COLOURED(txtR, txtG, txtB, 255)
            ELSE
               DRAWTEXT("LH", $pX[k], $pY[k] + atrV * 0.4, sansserif, bold, 9) COLOURED(txtR, txtG, txtB, 255)
            ENDIF
         ELSE
            IF $pL[k] = 1 THEN
               DRAWTEXT("HL", $pX[k], $pY[k] - atrV * 0.4, sansserif, bold, 9) COLOURED(txtR, txtG, txtB, 255)
            ELSE
               DRAWTEXT("LL", $pX[k], $pY[k] - atrV * 0.4, sansserif, bold, 9) COLOURED(txtR, txtG, txtB, 255)
            ENDIF
         ENDIF
      NEXT
   ENDIF
ENDIF

RETURN
![[SMC] Clean Liquidity Heatmap](https://www.prorealcode.com/wp-content/uploads/2026/03/TSLA-Diario-3-150x150.png)