







RSI and Linear Regression trading signals
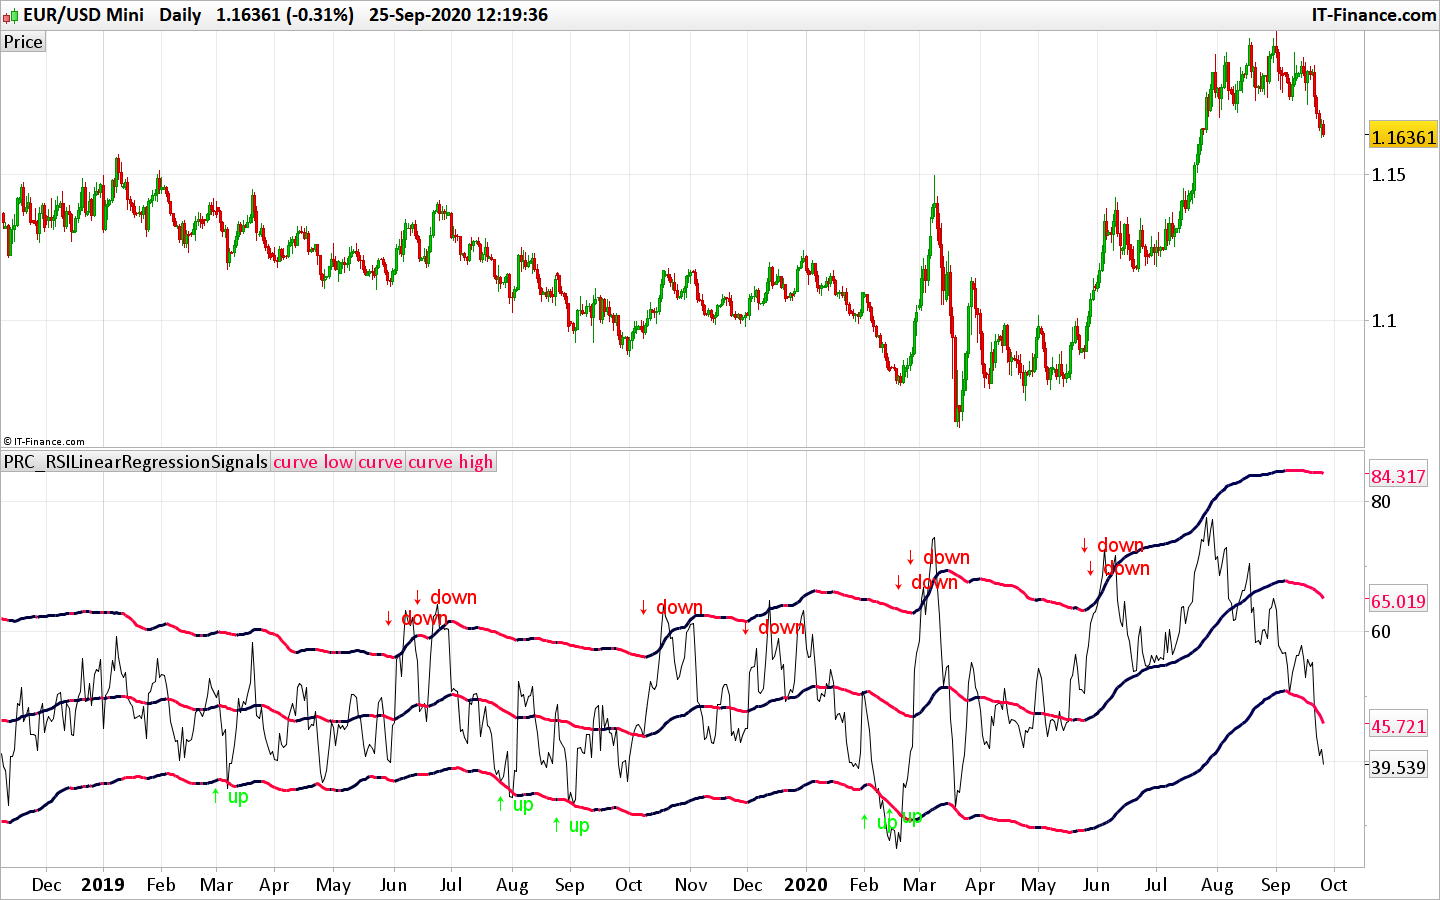
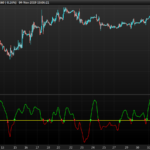
Trading signals based upon a linear regression channel applied to a classic RSI indicator.
If the RSI exceeds the upper band, the price should reverse to its mean and therefore a sell signals is announced.
If the RSI breaks the lower band, the price should reverse to its mean and a buy signals is plotted on the indicator.
You can adjust the RSI period of calculation (with variable ‘len’) and the linear regression channel period with “period”. The upper and lower band spread can be adjusted with the “deviations” setting (default is a 2 times multiplier from the mean).
//PRC_RSILinearRegressionSignals| indicator
//25.09.2020
//Nicolas @ www.prorealcode.com
//Sharing ProRealTime knowledge
//converted from tradingview
//https://www.prorealcode.com/topic/rsi-linear-regresion/

// --- settings
len = 21 //RSI Length
period     = 200 //Period
deviations = 2.0 //Deviation(s)
// --- end of settings

irsi = rsi[len](close)
periodMinusOne = period-1

Ex = 0.0
Ey = 0.0
Ex2 = 0.0
Exy = 0.0
for i=0 to periodMinusOne
closeI = (irsi[i])
Ex = Ex + i
Ey = Ey + closeI
Ex2 = Ex2 + (i * i)
Exy = Exy + (closeI * i)
ExEx = Ex * Ex
next
//slope
if Ex2=ExEx  then
slope = 0.0
else
slope= (period * Exy - Ex * Ey) / (period * Ex2 - ExEx)
endif
ilinearRegression = (Ey - slope * Ex) / period
intercept = ilinearRegression + barindex * slope
deviation = 0.0
for i=0 to periodMinusOne
deviation = deviation + square((irsi[i]) - (intercept - slope * (barindex[i])))
next
deviation = deviations * sqrt(deviation / periodMinusOne)
startingPointY = ilinearRegression + slope / periodMinusOne
//lineColor
if startingPointY > startingPointY[1] then
//color.blue
r=0
b=255
else
//color.red
r=255
b=0
endif
a = startingPointY-deviation
c1 = startingPointY
b = startingPointY+deviation

up=irsi crosses over a
down=irsi crosses under b
if up then
drawtext("↑ up",barindex,irsi-5,dialog,standard,20) coloured(0,255,0)
endif
if down then
drawtext("↓ down",barindex,irsi+5,dialog,standard,20) coloured(255,0,0)
endif

return irsi, a coloured(r,0,b) style(line,3)  as "curve low",c1 coloured(r,0,b) style(line,3) as "curve", b coloured(r,0,b) style(line,3)  as "curve high"
![Price Acceptance Reversal Planner [AGPro Series]](https://www.prorealcode.com/wp-content/uploads/2026/05/NASDAQ-5-minutes-150x150.png)
Comments
You must be logged in to post a comment.

Awesome work Nicolas! By any chance, do you have the Screener version for this "RSI and Linear Regression trading signals". I tried to convert the indicator to screener by replacing the drawing at the end i.e. "SCREENER[Signal](Signal AS "1=↑, 2=↓")", where I use the Signal =1 or 2 to replace the two condition of drawing in the codes ... but at the end I always get the error "Syntax error: This variable is not used in the {did not show any further info}". It would complete your indicator perfectly if you can add the screener here for us. Thank you and Best regards.



You are using variables "r" abd "b" for the color red and blue but unfortunately after setting r or b to 255, you reset b with b = startingPointY+deviation Do you rely on prorealcode knowing difference between integer b (255) and floating point b (deviation), or was this a mistake?



Hello , is it possible to use this in a MTF screener without getting this fault? This ProScreener market scan cannot be executed because there is an infinite loop within the program code. An infinite loop is a sequence of instructions which repeats itself endlessly when the code is executed. This may happen if: - the loop doesn't have a termination condition - the termination condition can never be met - the termination causes the loop to start over To run the scan, modify the code of your ProScreener.

Thanks Nicolas, I post my question, along with the codes I am trying to convert from your indicator, in the ProScreener Forum... So please review there. Thanks again.