

Retracement Pressure Index (RPI)
Most oscillators share the same fundamental limitation: their period is fixed. You pick 14, or 21, or whatever value backtesting suggested, and the indicator applies that window uniformly to every bar regardless of what the market is actually doing. A fast aggressive retracement and a slow grinding one will both be evaluated over the same number of bars, which makes no real sense.
The Retracement Pressure Index takes a different approach. Instead of using a fixed period, it first counts how many consecutive bars the price has been moving against the prevailing trend, and uses that count as its own calculation window. The period adapts to the retracement in progress rather than ignoring it.
The intended use is simple: you already know the trend direction by whatever method you prefer. What this indicator tells you is whether the current pullback inside that trend is reaching a level of tension where re-entering in the trend direction starts to make sense. It is a timing tool, not a signal generator.
Three components, one score
The RPI is a composite oscillator that blends three independent measurements into a single value between 0 and 100.
The first component is a dynamic stochastic. It locates the current close within the high/low range built over exactly the number of bars the retracement has lasted. In an uptrend, a score close to 100 means price has reached the lowest point of its own pullback range. This is the most direct measure of how stretched the retracement has become relative to itself.
The second component is retracement depth normalised by ATR. It measures how far price has travelled from the peak (in uptrend) or the trough (in downtrend) of the retracement window, expressed in ATR units. One ATR of distance delivers a full score. This component answers the question of whether the move away from the trend is meaningful in volatility terms, not just in bar count.
The third component is a bar count pressure. It grows linearly as the number of consecutive counter-trend bars increases, reaching its maximum at half the MaxBars parameter. Its role is modest (20% weight) but useful: it adds a mild urgency signal when a retracement has simply been going on for a long time, even if price has not moved dramatically.
The final score is a weighted sum: 40% dynamic stochastic, 40% depth, 20% bar pressure.
Reading the indicator
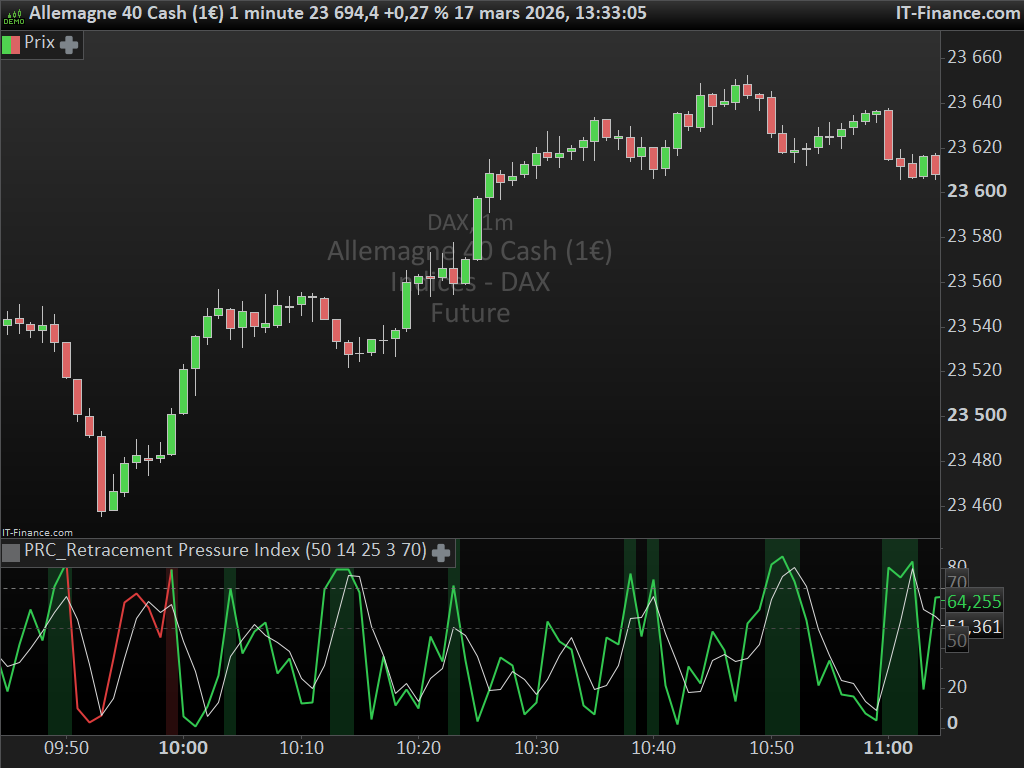
The line is green in an uptrend context and red in a downtrend context, based on the slope of the EMA. The background of the chart lights up softly when the RPI crosses the EntryLevel threshold (default 70), giving a quick visual cue without needing to watch the subgraph.
A reading above EntryLevel means all three components are simultaneously elevated: the pullback has reached the bottom of its own range, it is deep enough in ATR terms, and it has lasted a meaningful number of bars. When the RPI line also starts curling back down from that zone and crosses its signal line, that is the moment worth watching on your main chart.
A reading near zero simply means there is no meaningful retracement in progress — price is moving with the trend or has just started pulling back. No urgency to act.
Parameters
- EMAPeriod controls the trend reference. A longer period gives a smoother, slower trend definition. Use something consistent with how you identify your trend on the main chart.
- ATRPeriod is the volatility reference used to normalise depth. 14 is a reasonable default on most timeframes
- MaxBars is the cap on the dynamic window. If a retracement lasts longer than this, the window stops growing. It also controls the bar pressure component: pressure reaches 100 at MaxBars / 2. Setting this too low will make the indicator oversensitive to short wiggles; too high and it becomes sluggish.
- SignalPer smooths the signal line. 3 keeps it reactive.
- EntryLevel is the threshold above which the background highlight activates. 70 is a good starting point. Raising it to 80 makes the filter stricter and produces fewer but more selective signals.
Important notes
This indicator does not know where your support and resistance levels are. A high RPI score simply means the retracement mechanics are in place for a potential re-entry. Whether price will actually reverse at that level depends on structure, and no oscillator can tell you that. Use it as a filter on top of your existing setup, not as a standalone signal.
It is also worth remembering that the dynamic period adapts down to a minimum of 3 bars. On very short timeframes with choppy price action, consecutive counter-trend bars will accumulate quickly and the window will max out against MaxBars often. On higher timeframes with cleaner trends, the behaviour is generally more readable.
As with any indicator, backtesting against your specific instrument and timeframe before relying on it in live conditions is strongly recommended.
//PRC_Retracement Pressure Index (RPI)
//Nicolas @ www.prorealcode.com
//Sharing ProRealTime knowledge

// --- settings
EMAPeriod  = 50   // EMA period for trend reference
ATRPeriod  = 14   // ATR period for normalization
MaxBars    = 25   // max dynamic window in bars
SignalPer  = 3    // signal line smoothing
EntryLevel = 70   // entry zone threshold

// --- background trend
ema     = exponentialaverage[EMAPeriod]
atr     = averagetruerange[ATRPeriod]
trendUp = ema > ema[1]

// --- dynamic retracement counter
if trendUp then
if close < close[1] then
cnt = cnt[1] + 1
else
cnt = 0
endif
else
if close > close[1] then
cnt = cnt[1] + 1
else
cnt = 0
endif
endif

dynP = max(3, min(MaxBars, cnt + 2))

// --- dynamic high / low (manual loop)
dynHigh = high
dynLow  = low
j = 1
while j < dynP do
dynHigh = max(dynHigh, high[j])
dynLow  = min(dynLow,  low[j])
j = j + 1
wend

// --- component 1: dynamic stochastic (0-100)
// 100 = price at bottom of retracement range in uptrend
dRange = dynHigh - dynLow
if dRange > 0 then
if trendUp then
dynSto = (1 - (close - dynLow) / dRange) * 100
else
dynSto = ((close - dynLow) / dRange) * 100
endif
else
dynSto = 0
endif
dynSto = max(0, min(100, dynSto))

// retracement depth, ATR-normalised from dynamic peak (0-100)
if trendUp then
tension = (dynHigh - close) / (atr + 0.0001) * 100
else
tension = (close - dynLow) / (atr + 0.0001) * 100
endif
tension = max(0, min(100, tension))

// --- component 3: bars count pressure (0-100)
// grows linearly, reaches 100 when cnt = half of MaxBars
decel = min(100, cnt * 100 / max(1, MaxBars / 2))

// --- composite RPI: 40% tension + 40% stochastic + 20% bars pressure
RPI = tension * 0.40 + dynSto * 0.40 + decel * 0.20
RPI = max(0, min(100, RPI))

// --- signal line
sig = average[SignalPer](RPI)

// --- colors and background highlight
if trendUp then
r1 = 50
g1 = 200
b1 = 80
if RPI >= EntryLevel then
backgroundcolor(50, 220, 100, 45)
endif
else
r1 = 220
g1 = 60
b1 = 60
if RPI >= EntryLevel then
backgroundcolor(220, 60, 60, 45)
endif
endif

return RPI coloured(r1,g1,b1) style(line,2) as "RPI", sig coloured(220,220,220) style(line,1) as "Signal", EntryLevel coloured(120,120,120) style(dottedline,1) as "Entry zone", 50 coloured(70,70,70) style(dottedline,1) as "Mid"