Machine Learning Smart Money Concepts
1. Introduction
Most “smart money” indicators mark a Change of Character (CHoCH) – the moment price breaks the last swing against the prevailing structure – and leave it there. Every break looks the same, and you are left to guess which ones are worth trading.
This indicator, adapted to ProBuilder from the “Machine Learning Smart Money Concepts | GainzAlgo” pinescript, does something more interesting: it remembers every past CHoCH and how it resolved, and uses that memory to score each new one. When a fresh break appears, the tool describes it with three numbers (a volume-pressure feature, a displacement feature and a velocity feature), finds the K most similar breaks in its own history, and reports what happened to them – both as a probability of continuation and as a three-level target projection.
The learning is genuine, in the narrow sense that matters: the history is labelled with real outcomes. A fixed number of bars after each break, the indicator measures whether price actually ran further in the break’s favour than against it, and files that verdict away. So the database is not a static rulebook – it is a self-labelling record of how breaks on this instrument have tended to play out.
2. How It Works
Market structure and the CHoCH. Swing highs and lows are detected with a centred pivot (swingLen bars each side). A running trend state flips bullish when close breaks above the last swing high while the state was not already bullish, and bearish on the mirror below the last swing low. That flip is the CHoCH – the only event the engine cares about.
The three features. At each CHoCH the break is described by three normalised numbers:
- Volume delta – the average buying-vs-selling pressure over the run, from
(2·close − high − low) / rangeper bar. Positive means buyers dominated the candles. - Displacement – the size of the move (
|close − open[duration]|) measured in ATR units. How violent was the break. - Velocity – that same move divided by its duration in bars. How fast it got there.
The KNN lookup. The database holds past CHoCH events, each stored as those three features plus its resolved outcome. When a new break fires, the indicator computes the Euclidean distance in feature space to every past break of the same direction within the memory window (windowLen bars), and keeps the K nearest (default 5). No full sort is needed – it holds K slots and replaces the worst whenever a closer neighbour appears.
The probability. Among those K neighbours, the share whose outcome was favourable becomes the break’s score – “of the most similar past breaks, this many kept going”. A break is treated as a valid setup when its score clears minScore.
The targets. Each neighbour also carries its favourable run (how far price travelled in its direction). Sorted, those give three projections from the breakout close:
- TP1 = mean run ×
targetScalar(conservative) - TP2 = median run (standard)
- TP3 = 75th-percentile run (aggressive)
The self-labelling. This is the part that makes it “learn”. lookahead bars after every CHoCH (default 20), the indicator walks the bars that have since closed, measures the maximum favourable and maximum adverse excursion from the break’s close, and writes a new record: the three features as they were at the break, the favourable run, and a verdict of success (favourable > adverse) or failure. Because every value it stores comes from already-closed bars, the record is written once and never drifts.
3. Reading the Indicator
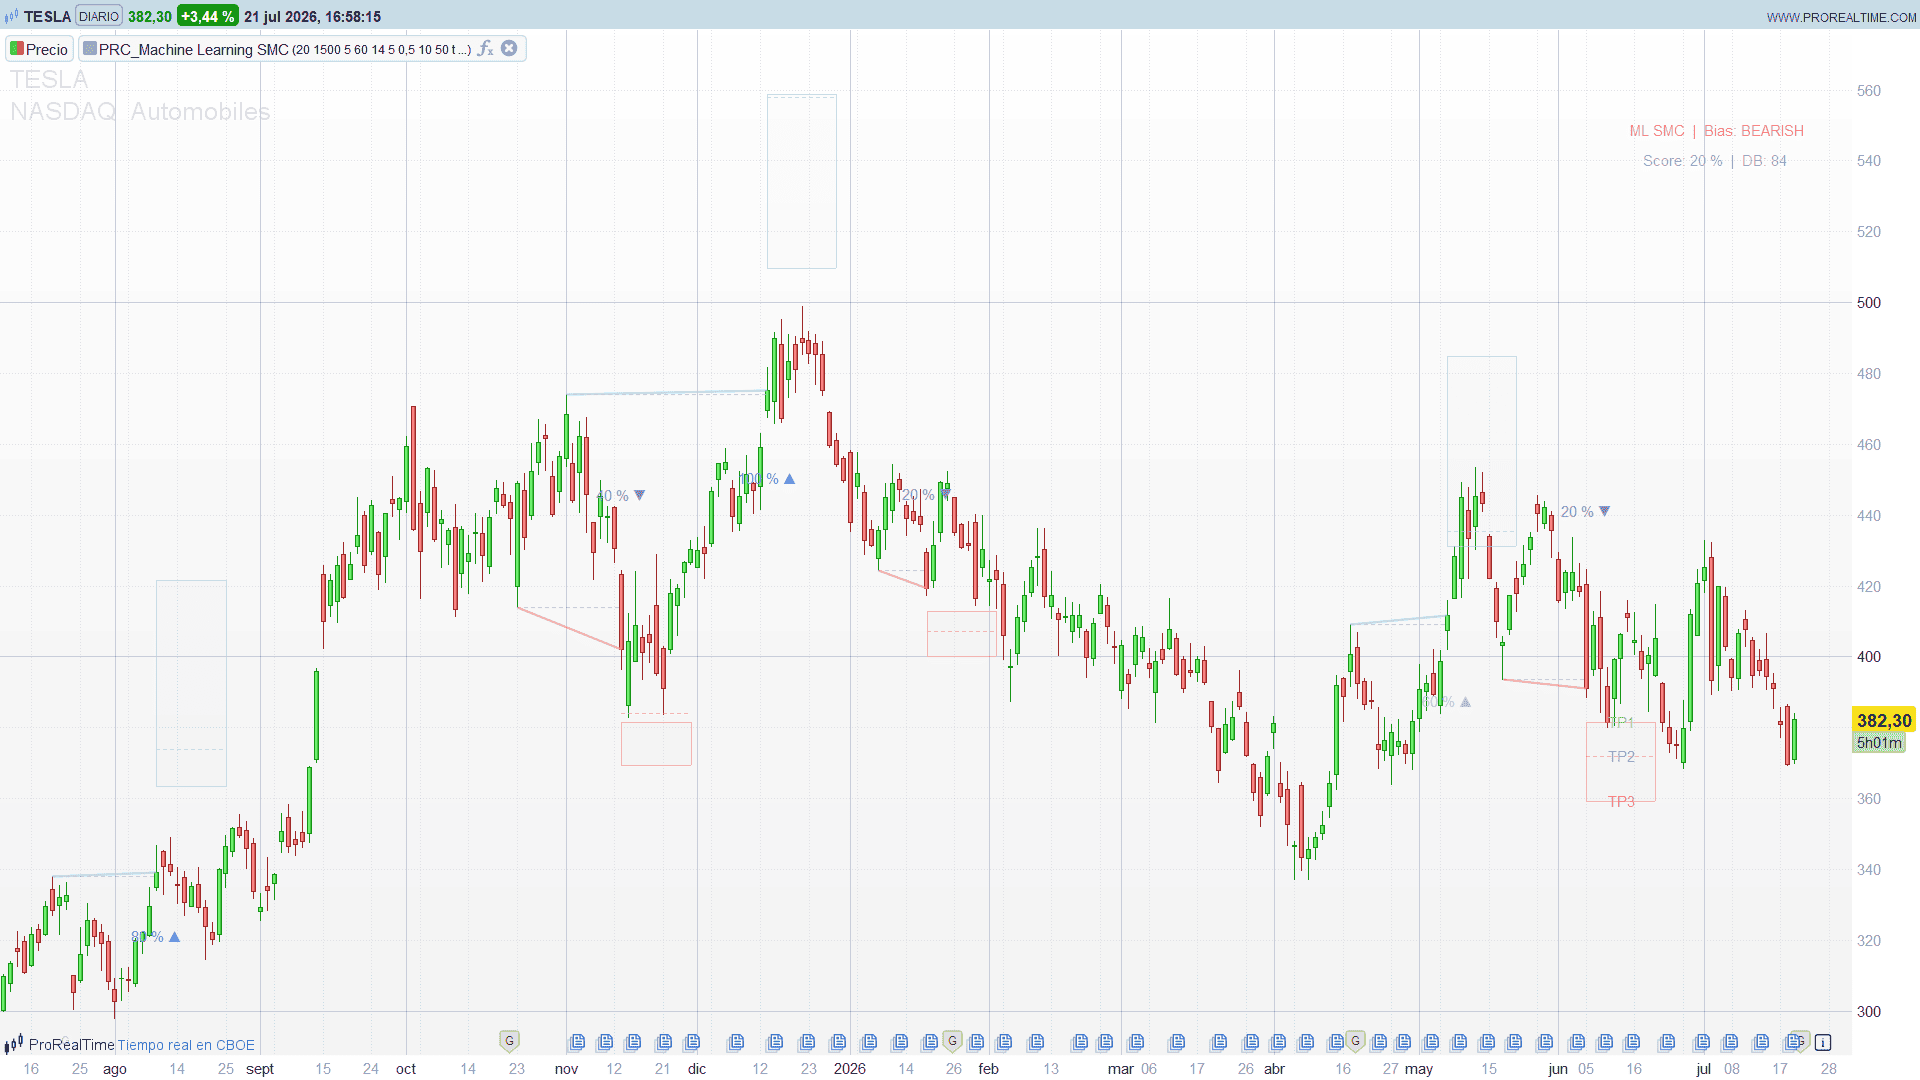
- Break line – at each CHoCH, a dotted horizontal line marks the swing level that was broken, and a solid diagonal connects that pivot to the entry point (the breakout close). This is the level that triggered the signal.
- Probability badge – a small
NN% ▲(bullish) orNN% ▼(bearish) at each break. Colour tiers the conviction: violet ≥ 80%, light violet ≥ 60%, muted grey below. - Target box – a shaded rectangle spanning TP1 to TP3, with a dotted TP2 line through it. Drawn for the current break and for past breaks (up to
maxSignals). TP1/TP2/TP3 labels are shown on the most recent box. - Corner panel – the current Bias (bullish / bearish / neutral), the last break’s Score, and DB (how many labelled cases the engine has accumulated).
4. Trading Applications
- A conviction filter for structure breaks. The score is the point of the tool: it lets you skip CHoCHs that resemble past breaks which failed, and pay attention to those that resemble past winners. Use it as a gate over your existing SMC rules.
- A ready-made scale-out map. TP1/TP2/TP3 are a natural template for partial exits – conservative, standard, aggressive – anchored to how far similar breaks actually ran on this instrument.
- Structure context at a glance. The bias state and the break lines frame whether a new signal aligns with or fights the larger structure.
- The database size matters. The
DBcounter tells you how much the engine has to work with. On a fresh chart or a short history the score is thin; give it enough bars to accumulate labelled cases before leaning on the numbers.
5. Parameters
- lookahead (20): bars used to resolve each break’s outcome. Also the delay before a break becomes a labelled training case.
- windowLen (1500): how far back the KNN looks for similar breaks.
- kNeighbors (5): how many nearest neighbours vote on probability and targets.
- minScore (60): the score a break must reach to be treated as a valid setup.
- atrLen (14): ATR period for the displacement feature and badge offsets.
- swingLen (5): pivot length for swing detection. Larger = bigger, rarer structure.
- targetScalar (0.5): shrinks TP1 relative to the mean run.
- targetExtBars (10): how far each target box extends to the right of its break.
- maxSignals (50): how many past breaks are redrawn (object-count cap).
- showSwingLines / showBrokenLevel / showTargets / showTpLabels / showPanel / showRibbon: visual toggles.
6. Machine Learning Smart Money Concepts Code
//----------------------------------------------
//PRC_Machine Learning Smart Money Concepts [GainzAlgo]
//version = 2
//21.07.2026
//Ivan Gonzalez @ www.prorealcode.com
//Sharing ProRealTime knowledge
//----------------------------------------------
defparam drawonlastbaronly = true
defparam calculateonlastbars = 5000

// === INPUTS ===
lookahead     = 20      // ventana de aprendizaje (barras)
windowLen     = 1500    // memoria historica del KNN (barras)
kNeighbors    = 5       // K vecinos mas cercanos (1..10)
minScore      = 60      // score minimo para considerar setup valido (%)
atrLen        = 14      // periodo ATR
swingLen      = 5       // longitud del pivote (2..20)
targetScalar  = 0.5     // escalar conservador para TP1
targetExtBars = 10      // extension de la zona objetivo (barras)
maxSignals    = 50      // cap de CHoCH historicos a redibujar (limite de objetos)
showSwingLines  = 1     // 1 = linea de conexion pivote -> ruptura
showBrokenLevel = 1     // 1 = nivel roto (horizontal)
showTargets   = 1       // 1 = cajas de targets (todas las historicas)
showTpLabels  = 1       // 1 = etiquetas TP1/TP2/TP3 en la ultima caja
showPanel     = 1       // 1 = panel resumen en esquina
showRibbon    = 0       // 1 = cinta de targets suavizada
ribbonLen     = 50      // suavizado de la cinta

// === COLORES (RGB) ===
bullR = 140
bullG = 200
bullB = 255
bearR = 255
bearG = 140
bearB = 160
hiR = 160
hiG = 130
hiB = 255
medR = 200
medG = 180
medB = 255
neuR = 140
neuG = 135
neuB = 165
lvlR = 160
lvlG = 155
lvlB = 185

// === ESTADO PERSISTENTE ===
once marketTrend = 0
once hasHigh = 0
once hasLow = 0
once lastSwingHigh = 0
once lastSwingLow = 0
once lastHighIndex = 0
once lastLowIndex = 0
once dbCount = 0
once nSig = 0
once lastScore = 50
// cinta
once activeBull = 0
once activeBear = 0

if barindex = 0 then
   activeBull = close
   activeBear = close
endif

// === ATR ===
currentAtr = averagetruerange[atrLen]

// === VOLUME DELTA ===
// (buyVol - sellVol) / vol  con buyVol=vol*(close-low)/range, sellVol=vol*(high-close)/range
candleRng = high - low
if candleRng <= 0 then
   candleRng = 0.000001
endif
currentVolDelta = 0
if volume > 0 then
   currentVolDelta = (2 * close - high - low) / candleRng
endif

// === DETECCION DE PIVOTES (swing high / low) ===
swingHighFound = 0
swingLowFound = 0
if barindex >= 2 * swingLen then
   if high[swingLen] = highest[2 * swingLen + 1](high) and high[swingLen] > high[swingLen + 1] and high[swingLen] >= high[swingLen - 1] then
      swingHighFound = 1
   endif
   if low[swingLen] = lowest[2 * swingLen + 1](low) and low[swingLen] < low[swingLen + 1] and low[swingLen] <= low[swingLen - 1] then
      swingLowFound = 1
   endif
endif

if swingHighFound = 1 then
   lastSwingHigh = high[swingLen]
   lastHighIndex = barindex - swingLen
   hasHigh = 1
endif
if swingLowFound = 1 then
   lastSwingLow = low[swingLen]
   lastLowIndex = barindex - swingLen
   hasLow = 1
endif

// === DETECCION DE CHoCH (maquina de estados) ===
isBullChoch = 0
isBearChoch = 0
if hasHigh = 1 and marketTrend <= 0 and close > lastSwingHigh then
   isBullChoch = 1
   marketTrend = 1
endif
if hasLow = 1 and marketTrend >= 0 and close < lastSwingLow then
   isBearChoch = 1
   marketTrend = 0 - 1
endif

// === EXTRACCION DE FEATURES (solo en la barra del CHoCH) ===
volDeltaFeat = 0
displaceFeat = 0
velocityFeat = 0
if isBullChoch = 1 or isBearChoch = 1 then
   if isBullChoch = 1 then
      calcStart = lastHighIndex
   else
      calcStart = lastLowIndex
   endif
   duration = barindex - calcStart
   if duration < 1 then
      duration = 1
   endif
   if duration > 4990 then
      duration = 4990
   endif
   if duration > barindex then
      duration = barindex
   endif
   safeLookback = duration
   if safeLookback > 50 then
      safeLookback = 50
   endif
   runningVolDelta = 0
   for i = 0 to safeLookback - 1 do
      runningVolDelta = runningVolDelta + currentVolDelta[i]
   next
   volDeltaFeat = runningVolDelta / safeLookback
   totalMove = abs(close - open[duration])
   if currentAtr > 0 then
      displaceFeat = totalMove / currentAtr
   else
      displaceFeat = 1.0
   endif
   velocityFeat = totalMove / duration
endif

// === KNN sobre la base de datos historica ===
probPct = 50
tp1 = 0
tp2 = 0
tp3 = 0
cntK = 0
if (isBullChoch = 1 or isBearChoch = 1) and dbCount > 0 then
   // inicializar K slots a "infinito"
   for k = 0 to kNeighbors - 1 do
      $knnDist[k] = 1000000000
      $knnRun[k] = 0
      $knnOut[k] = 0
   next
   // recorrer la DB: filtro por direccion + ventana; quedarnos con los K mas cercanos
   for i = 0 to dbCount - 1 do
      dirMatch = 0
      if isBullChoch = 1 and $dbBull[i] = 1 then
         dirMatch = 1
      endif
      if isBearChoch = 1 and $dbBull[i] = 0 then
         dirMatch = 1
      endif
      if dirMatch = 1 and (barindex - $dbBar[i]) <= windowLen then
         dVol = (volDeltaFeat - $dbVol[i]) * (volDeltaFeat - $dbVol[i])
         dDis = (displaceFeat - $dbDis[i]) * (displaceFeat - $dbDis[i])
         dVel = (velocityFeat - $dbVel[i]) * (velocityFeat - $dbVel[i])
         dist = sqrt(dVol + dDis + dVel)
         // localizar el peor (mayor distancia) de los K slots actuales
         maxD = $knnDist[0]
         maxI = 0
         for j = 1 to kNeighbors - 1 do
            if $knnDist[j] > maxD then
               maxD = $knnDist[j]
               maxI = j
            endif
         next
         if dist < maxD then
            $knnDist[maxI] = dist
            $knnRun[maxI] = $dbRun[i]
            $knnOut[maxI] = $dbOut[i]
         endif
      endif
   next
   // recopilar los vecinos realmente ocupados (dist < infinito)
   succ = 0
   cntK = 0
   for k = 0 to kNeighbors - 1 do
      if $knnDist[k] < 1000000000 then
         $knnRunSorted[cntK] = $knnRun[k]
         if $knnOut[k] > 0 then
            succ = succ + 1
         endif
         cntK = cntK + 1
      endif
   next
   if cntK > 0 then
      probPct = succ / cntK * 100
      // ordenar los runs (bubble sort ascendente)
      if cntK >= 2 then
         for a = 0 to cntK - 2 do
            for b = 0 to cntK - 2 - a do
               if $knnRunSorted[b] > $knnRunSorted[b + 1] then
                  tmp = $knnRunSorted[b]
                  $knnRunSorted[b] = $knnRunSorted[b + 1]
                  $knnRunSorted[b + 1] = tmp
               endif
            next
         next
      endif
      // media
      sumR = 0
      for k = 0 to cntK - 1 do
         sumR = sumR + $knnRunSorted[k]
      next
      meanRun = sumR / cntK
      // mediana
      medIdx = floor(cntK / 2)
      medRun = $knnRunSorted[medIdx]
      // percentil 75
      p75idx = round(cntK * 0.75) - 1
      if p75idx < 0 then
         p75idx = 0
      endif
      if p75idx > cntK - 1 then
         p75idx = cntK - 1
      endif
      aggrRun = $knnRunSorted[p75idx]
      // targets con direccion
      if isBullChoch = 1 then
         dirSign = 1
      else
         dirSign = 0 - 1
      endif
      tp1 = close + dirSign * meanRun * targetScalar
      tp2 = close + dirSign * medRun
      tp3 = close + dirSign * aggrRun
   endif
endif

// === REGISTRO DE LA SENAL (para redibujo historico) ===
if isBullChoch = 1 or isBearChoch = 1 then
   $sigBar[nSig] = barindex
   $sigProb[nSig] = probPct
   $sigClose[nSig] = close
   if isBullChoch = 1 then
      $sigDir[nSig] = 1
      $sigY[nSig] = low - currentAtr
      $sigPivX[nSig] = lastHighIndex
      $sigPivY[nSig] = lastSwingHigh
   else
      $sigDir[nSig] = 0
      $sigY[nSig] = high + currentAtr
      $sigPivX[nSig] = lastLowIndex
      $sigPivY[nSig] = lastSwingLow
   endif
   if tp1 <> 0 and tp3 <> 0 then
      $sigHasTP[nSig] = 1
      $sigTP1[nSig] = tp1
      $sigTP2[nSig] = tp2
      $sigTP3[nSig] = tp3
   else
      $sigHasTP[nSig] = 0
   endif
   nSig = nSig + 1
   lastScore = probPct
endif

// === ENTRENAMIENTO CON LOOKAHEAD ===
// A las 'lookahead' barras de un CHoCH, medimos el recorrido favorable/adverso real
// y lo guardamos como caso resuelto. Indices [lookahead] = barras cerradas -> push idempotente.
if isBullChoch[lookahead] = 1 or isBearChoch[lookahead] = 1 then
   if isBullChoch[lookahead] = 1 then
      wasBull = 1
   else
      wasBull = 0
   endif
   initialRef = close[lookahead]
   maxFav = 0
   maxAdv = 0
   for li = 1 to lookahead do
      hOff = high[lookahead - li]
      lOff = low[lookahead - li]
      if wasBull = 1 then
         if hOff - initialRef > maxFav then
            maxFav = hOff - initialRef
         endif
         if initialRef - lOff > maxAdv then
            maxAdv = initialRef - lOff
         endif
      else
         if initialRef - lOff > maxFav then
            maxFav = initialRef - lOff
         endif
         if hOff - initialRef > maxAdv then
            maxAdv = hOff - initialRef
         endif
      endif
   next
   $dbBar[dbCount] = barindex - lookahead
   $dbVol[dbCount] = volDeltaFeat[lookahead]
   $dbDis[dbCount] = displaceFeat[lookahead]
   $dbVel[dbCount] = velocityFeat[lookahead]
   $dbBull[dbCount] = wasBull
   if maxFav > maxAdv then
      $dbOut[dbCount] = 1
   else
      $dbOut[dbCount] = 0 - 1
   endif
   $dbRun[dbCount] = maxFav
   dbCount = dbCount + 1
endif

// === CINTA DE TARGETS (opcional) ===
if isBullChoch = 1 and tp3 <> 0 then
   activeBull = tp3
endif
if isBearChoch = 1 and tp3 <> 0 then
   activeBear = tp3
endif
smoothBull = average[ribbonLen](activeBull)
smoothBear = average[ribbonLen](activeBear)

// === DIBUJOS (solo en la ultima barra) ===
if islastbarupdate then
   startI = 0
   if nSig > maxSignals then
      startI = nSig - maxSignals
   endif
   for i = startI to nSig - 1 do
      // color de la senal segun direccion
      if $sigDir[i] = 1 then
         lnR = bullR
         lnG = bullG
         lnB = bullB
      else
         lnR = bearR
         lnG = bearG
         lnB = bearB
      endif

      // --- Nivel roto (horizontal) del pivote a la barra de ruptura ---
      if showBrokenLevel = 1 then
         drawsegment($sigPivX[i], $sigPivY[i], $sigBar[i], $sigPivY[i]) coloured(lvlR, lvlG, lvlB, 160) style(dottedline, 1)
      endif
      // --- Linea de rotura (diagonal): pivote -> punto de entrada ---
      if showSwingLines = 1 then
         drawsegment($sigPivX[i], $sigPivY[i], $sigBar[i], $sigClose[i]) coloured(lnR, lnG, lnB, 200) style(line, 2)
      endif

      // --- Badge de probabilidad ---
      pv = round($sigProb[i])
      if $sigProb[i] >= 80 then
         sR = hiR
         sG = hiG
         sB = hiB
      elsif $sigProb[i] >= 60 then
         sR = medR
         sG = medG
         sB = medB
      else
         sR = neuR
         sG = neuG
         sB = neuB
      endif
      if $sigDir[i] = 1 then
         drawtext("#pv#% ▲", $sigBar[i], $sigY[i]) coloured(sR, sG, sB)
      else
         drawtext("#pv#% ▼", $sigBar[i], $sigY[i]) coloured(sR, sG, sB)
      endif

      // --- Caja TP historica (X fija: de la barra del CHoCH a +targetExtBars) ---
      if showTargets = 1 and $sigHasTP[i] = 1 then
         boxRight = $sigBar[i] + targetExtBars
         if $sigDir[i] = 1 then
            boxTop = $sigTP3[i]
            boxBot = $sigTP1[i]
         else
            boxTop = $sigTP1[i]
            boxBot = $sigTP3[i]
         endif
         drawrectangle($sigBar[i], boxTop, boxRight, boxBot) coloured(lnR, lnG, lnB, 150) fillcolor(lnR, lnG, lnB, 10)
         drawsegment($sigBar[i], $sigTP2[i], boxRight, $sigTP2[i]) coloured(lnR, lnG, lnB, 150) style(dottedline, 1)
         if showTpLabels = 1 and i = nSig - 1 then
            labelX = $sigBar[i] + round(targetExtBars / 2)
            drawtext("TP1", labelX, $sigTP1[i]) coloured(120, 200, 160)
            drawtext("TP2", labelX, $sigTP2[i]) coloured(180, 160, 255)
            drawtext("TP3", labelX, $sigTP3[i]) coloured(220, 130, 180)
         endif
      endif
   next

   // --- Panel resumen (esquina superior derecha) ---
   if showPanel = 1 then
      if marketTrend > 0 then
         drawtext("ML SMC  |  Bias: BULLISH", -200, -100) anchor(topright, xshift, yshift) coloured(bullR, bullG, bullB)
      elsif marketTrend < 0 then
         drawtext("ML SMC  |  Bias: BEARISH", -200, -100) anchor(topright, xshift, yshift) coloured(bearR, bearG, bearB)
      else
         drawtext("ML SMC  |  Bias: NEUTRAL", -200, -100) anchor(topright, xshift, yshift) coloured(neuR, neuG, neuB)
      endif
      scoreShown = round(lastScore)
      drawtext("Score: #scoreShown#%  |  DB: #dbCount#", -200, -130) anchor(topright, xshift, yshift) coloured(180, 175, 200)
   endif

endif

// === RETURN (niveles de precio; NO booleanas en overlay) ===
if showRibbon = 1 then
   rbBull = smoothBull
   rbBear = smoothBear
else
   rbBull = undefined
   rbBear = undefined
endif

return rbBull coloured(bullR, bullG, bullB, 60) as "ML Bull Target", rbBear coloured(bearR, bearG, bearB, 60) as "ML Bear Target"
![Probabilistic ICT Order Blocks [3D]](https://www.prorealcode.com/wp-content/uploads/2026/08/EURUSDXXXX-1-hora-150x150.png)
![[SMC] Clean Liquidity Heatmap](https://www.prorealcode.com/wp-content/uploads/2026/03/TSLA-Diario-3-150x150.png)