







Optimized Trend Tracker OTT
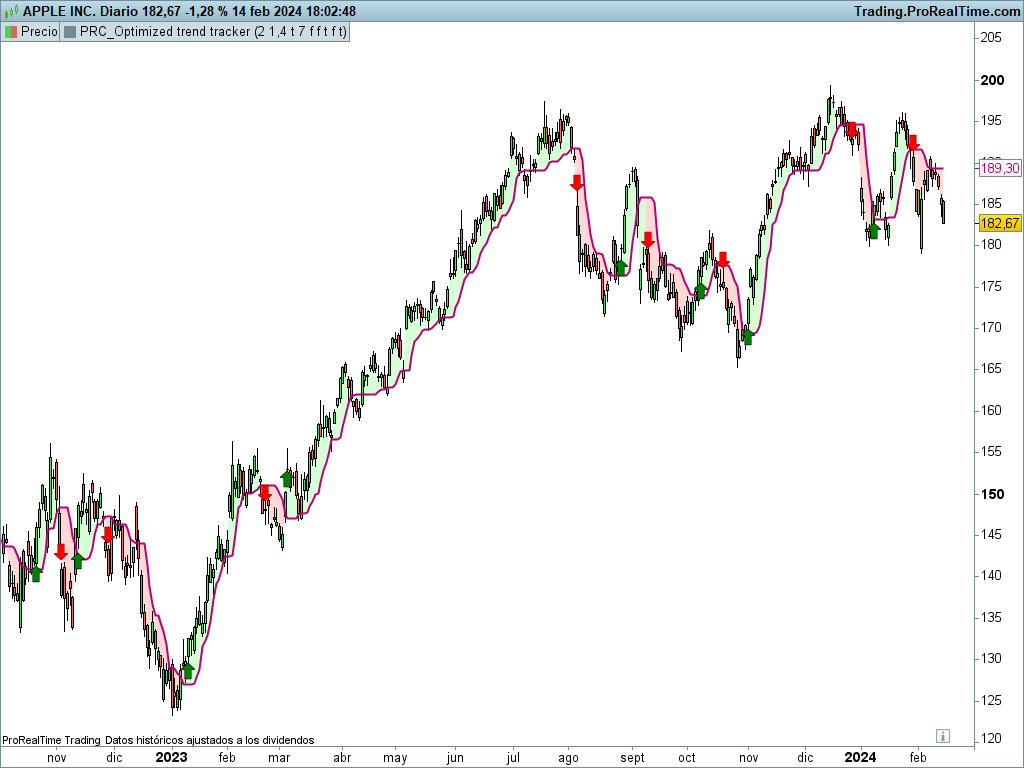
Optimized Trend Tracker OTT is an indicator that provides traders to find an existing trend or in another words to see which side of the current trend we are on.
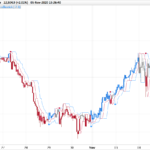
We are under the effect of the uptrend in cases where the prices are above OTT ,
under the influence of a downward trend, when prices are below OTT.
The first parameter in the OTT indicator set by the two parameters is the period/length.
OTT will be much sensitive to trend movements if it is smaller. And vice versa, will be less sensitive when it is longer.
As the period increases it will become less sensitive to little trends and price actions.
In this way, your choice of period, will be closely related to which of the sort of trends you are interested in.
The OTT percent parameter in OTT is an optimization coefficient. Just like in the period
small values are better at capturing short term fluctuations, while large values
will be more suitable for long-term trends.
In addition, when OTT is used with the support line in it, buy and sell signals
it will become a producing indicator.
You can use OTT default alarms and Buy Sell signals like:
1-
BUY when Prices are above OTT
SELL when Prices are below OTT
2-
BUY when OTT support Line crosses over OTT line.
SELL when OTT support Line crosses under OTT line.
3-
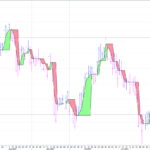
BUY when OTT line is Green and makes higher highs.
SELL when OTT line is Red and makes lower lows.
Text from his author: KivancOzbilgic
//PRC_Optimized Trend Tracker | indicator
//version = 0
//14.02.24
//Iván González @ www.prorealcode.com
//Sharing ProRealTime knowledge
////developer: ANIL ÖZEKŞİ
//////inputs
src = customclose
length = 2 //OTT period
percent = 1.4 //OTT percent
showsupport = 1 //Show Support Line
showsignalsk = 1 //Show Support Line Crossing Signals
showsignalsc = 0 //Show Price/OTT Crossing Signals
highlight = 0 //Show OTT Color Changes
highlighting = 1 //Highlighter On/Off
mav = 1 //Moving Average Type
///////indicator
////VAR
if barindex < 9 then
var = src
else
valpha=2/(length+1)
if src > src[1] then
vud1= src-src[1]
vdd1= 0
elsif src < src[1] then
vud1= 0
vdd1=src[1]-src
else
vud1=0
vdd1=0
endif
vUD=summation[9](vud1)
vDD=summation[9](vdd1)
vCMO=(vUD-vDD)/(vUD+vDD)
VAR=(valpha*abs(vCMO)*src)+(1-valpha*abs(vCMO))*VAR[1]
endif
if barindex < length then
Mavg = src
dir = 1
else
if AverageTypeVAR then
Mavg = var
else
Mavg=average[length,mav](src)
endif
fark = Mavg*percent*0.01

longStop = Mavg - fark
longStopPrev = longStop[1]

if Mavg > longStopPrev then
longStop = max(longStop,longStopPrev)
else
longStop = longStop
endif

shortStop = Mavg + fark
shortStopPrev = shortStop[1]

if Mavg < shortStopPrev then
shortStop = min(shortStop,shortStopPrev)
else
shortStop = shortStop
endif

if dir = -1 and Mavg > shortStopPrev then
dir = 1
elsif dir = 1 and Mavg < longStopPrev then
dir = -1
else
dir = dir[1]
endif
endif

if dir = 1 then
MT = longStop
else
MT = shortStop
endif

if Mavg > MT then
OTT = MT*(200+percent)/200
else
OTT = MT*(200-percent)/200
endif

pALL = OTT[2]
///////////OTT colors
if highlight then
if OTT[2]>OTT[3] then
r=76
g=175
b=80
else
r=255
g=82
b=82
endif
else
r=184
g=0
b=117
endif
//////////print signals
buysignal = Mavg crosses over OTT[2]
sellsignal = Mavg crosses under OTT[2]

if buysignal and showsignalsk then
drawarrowup(barindex,low-0.25*averagetruerange[10](close))coloured("green")
elsif sellsignal and showsignalsk then
drawarrowdown(barindex,high+0.25*averagetruerange[10](close))coloured("red")
endif

buySignalc = src crosses over OTT[2]
sellSignallc = src crosses under OTT[2]

if buySignalc and showsignalsc then
drawtext("▲",barindex,low-0.25*averagetruerange[10](close))coloured("green")
elsif sellSignallc and showsignalsc then
drawtext("▼",barindex,high+0.25*averagetruerange[10](close))coloured("red")
endif

if Mavg > OTT then
r1=0
g1=250
b1=0
else
r1=250
g1=0
b1=0
endif

mplot = (high+low+close+open)/4

if highlighting then
colorbetween(mplot,pALL,r1,g1,b1,40)
endif

return Mavg*showsupport as "Media" coloured(0,0,250)style(dottedline,2),pALL as "OTT"coloured(r,g,b)style(line,2)
Comments
You must be logged in to post a comment.


//PRC_Optimized Trend Tracker | indicator //version = 0 //14.02.24 //Iván González @ www.prorealcode.com //Sharing ProRealTime knowledge ////developer: ANIL ÖZEKŞİ //////inputs src = customclose length = 2 //OTT period percent = 1.4 //OTT percent showsupport = 1 //Show Support Line showsignalsk = 1 //Show Support Line Crossing Signals showsignalsc = 0 //Show Price/OTT Crossing Signals highlight = 0 //Show OTT Color Changes highlighting = 1 //Highlighter On/Off AverageTypeVAR = 1 // use VAR average mav = 1 //Moving Average Type ///////indicator ////VAR if barindex < 9 then var = src else valpha=2/(length+1) if src > src[1] then vud1= src-src[1] vdd1= 0 elsif src < src[1] then vud1= 0 vdd1=src[1]-src else vud1=0 vdd1=0 endif vUD=summation[9](vud1) vDD=summation[9](vdd1) vCMO=(vUD-vDD)/(vUD+vDD) VAR=(valpha*abs(vCMO)*src)+(1-valpha*abs(vCMO))*VAR[1] endif if barindex < length then Mavg = src dir = 1 else if AverageTypeVAR then Mavg = var else Mavg=average[length,mav](src) endif fark = Mavg*percent*0.01 longStop = Mavg - fark longStopPrev = longStop[1] if Mavg > longStopPrev then longStop = max(longStop,longStopPrev) else longStop = longStop endif shortStop = Mavg + fark shortStopPrev = shortStop[1] if Mavg < shortStopPrev then shortStop = min(shortStop,shortStopPrev) else shortStop = shortStop endif if dir = -1 and Mavg > shortStopPrev then dir = 1 elsif dir = 1 and Mavg < longStopPrev then dir = -1 else dir = dir[1] endif endif if dir = 1 then MT = longStop else MT = shortStop endif if Mavg > MT then OTT = MT*(200+percent)/200 else OTT = MT*(200-percent)/200 endif pALL = OTT[2] ///////////OTT colors if highlight then if OTT[2]>OTT[3] then r=76 g=175 b=80 else r=255 g=82 b=82 endif else r=184 g=0 b=117 endif //////////print signals buysignal = Mavg crosses over OTT[2] sellsignal = Mavg crosses under OTT[2] if buysignal and showsignalsk then drawarrowup(barindex,low-0.25*averagetruerange[10](close))coloured("green") elsif sellsignal and showsignalsk then drawarrowdown(barindex,high+0.25*averagetruerange[10](close))coloured("red") endif buySignalc = src crosses over OTT[2] sellSignallc = src crosses under OTT[2] if buySignalc and showsignalsc then drawtext("▲",barindex,low-0.25*averagetruerange[10](close))coloured("green") elsif sellSignallc and showsignalsc then drawtext("▼",barindex,high+0.25*averagetruerange[10](close))coloured("red") endif if Mavg > OTT then r1=0 g1=250 b1=0 else r1=250 g1=0 b1=0 endif mplot = (high+low+close+open)/4 if highlighting then colorbetween(mplot,pALL,r1,g1,b1,40) endif return Mavg*showsupport as "Media" coloured(0,0,250)style(dottedline,2),pALL as "OTT"coloured(r,g,b)style(line,2)
Hi. No I didn't. This is a code translation requested by an user a few days ago.