







Multiple Logistic Regression indicator
Introduction to Multiple Logistic Regression
In traditional technical analysis, we usually look at an indicator and wait for a fixed level (like RSI > 70). Logistic Regression is different. It is a statistical model used to determine the probability of an event occurring (e.g., “Is the price likely to go up?”).
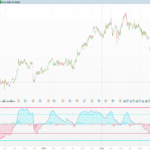
Because this is a Multiple regression, it looks at six different indicators simultaneously, weighs their importance, and outputs a single value between 0 and 1.
- Value > 0.5: Bullish probability.
- Value < 0.5: Bearish probability.
How it Works: The Logic Breakdown
The code is divided into four main logical phases: Feature Calculation, Normalization, The Probability Engine, and The Learning Phase.
1. The Features (Inputs)
The model uses six “features” to understand the market:
- RSI: Momentum2.
- CCI: Trend strength and overbought/oversold levels.
- DMI: Directional movement (DI+ vs DI-).
- Aroon: Trend detection and age.
- EMAs: Moving average crossovers for trend direction.
- Supertrend: A volatility-based trend follower.
2. Normalization (The Binary State)
Machine Learning models work best with simplified data. The code takes the indicators above and converts them into 1 (Bullish) or -1 (Bearish). For example:
if rsivalue > 50 then
   x1=1
else
   x1=-1
endif
This transforms complex curves into a set of binary votes.
3. The Probability Engine (The Sigmoid Function)
This is the mathematical heart of the indicator. It calculates a weighted sum of all normalized inputs (z) and passes them through the Sigmoid Function:
p = 1/ (1 + e^(-(beta0 + beta1x1 + beta2x2 …)))
This formula “squashes” any input value into a range between 0 and 1. The result p represents the raw probability of the current trend.
4. Gradient Descent: How it “Learns”
Unlike a standard indicator, this code calculates a Loss Function. It compares its prediction (p) against what is actually happening in the price (using a Z-score of the Close).
myloss = (-y) * log(p) - (1-y) * log(1-p)
If the model is “wrong” (high loss), it uses Gradient Descent to adjust the weights (Betas) of each indicator.
- Learning Rate (lr): This controls how fast the model changes its mind. A value of 0.08 means it adapts slowly and smoothly to avoid market noise.
- Adjusted Betas: The values b1 through b6 are the “learned” weights. If the RSI has been a reliable predictor lately, its Beta will increase.
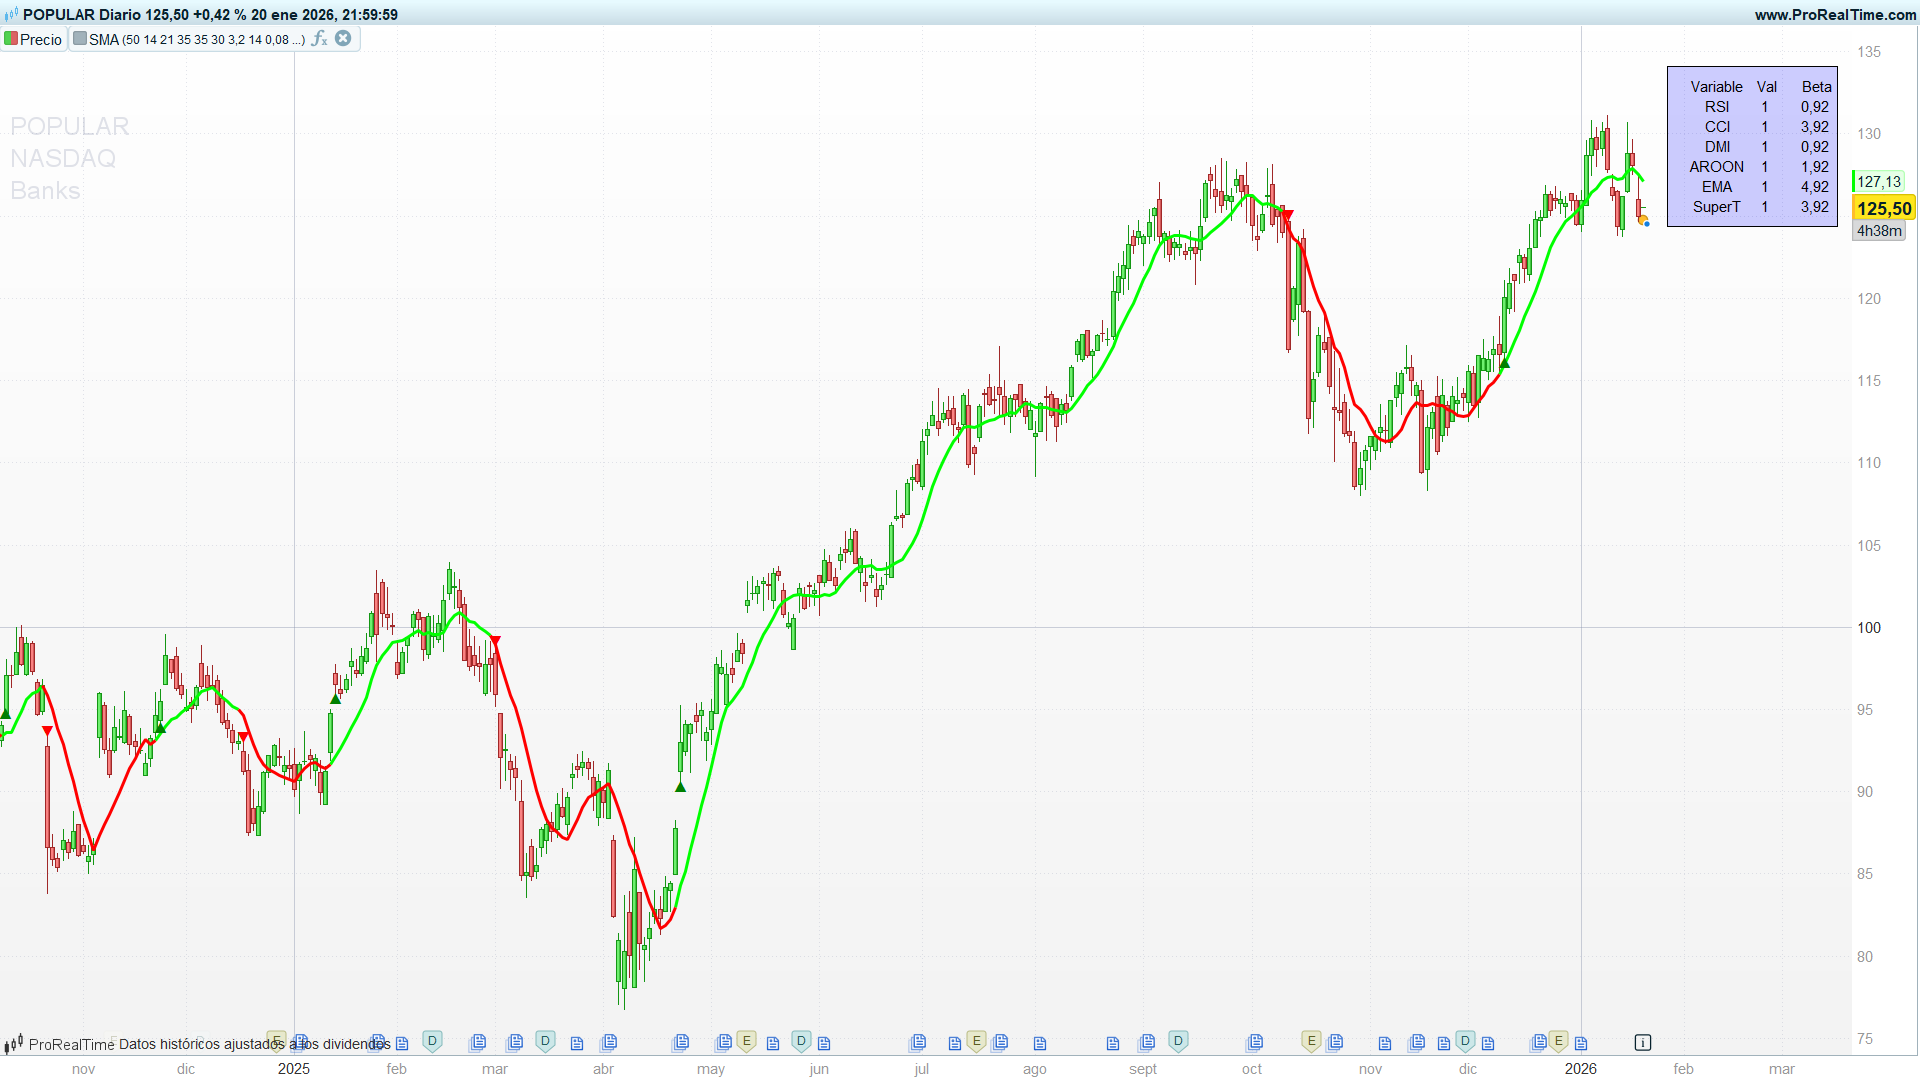
Reading the Dashboard
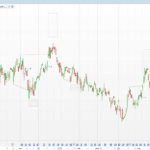
One of the most powerful features of this script is the On-Chart Data Table.
- Variable Column: The name of the indicator.
- Val Column: The current normalized state (1 or -1).
- Beta Column: The weight the model is currently giving to that indicator.
- High Beta: The model relies heavily on this indicator.
- Low Beta: The model is ignoring this indicator because it has been inaccurate recently.
Configuration & Parameters
- length = 50. The period used for the Z-score (the “truth” the model learns from).
- lr = 0.08. Learning Rate. Higher values make the model adapt faster but more erratically
- .b1 – b6 Variable. The initial “guess” weights for each indicator.
- Factor/ATR 3.2 / 2 Parameters for the internal Supertrend calculation.
Probuilder Code
DEFPARAM DRAWONLASTBARONLY =TRUE
//--------------------------------------------------------------//
//PRC_Multiple Logistic Regression
//version = 0
//14.05.24
//Iván González @ www.prorealcode.com
//Sharing ProRealTime knowledge
//-------------------------------------------------------------//
//-----Inputs--------------------------------------------------//
length=50 //Z score length
rsilength=35 //rsi
ccilength=45 //cc1
dmilength=35 //dmi
arlength=35 //aroon
emalength=30 //exponential average
factor=3.2 //factor for supertrend
atrperiod=2 //atr period
b0=1
b1=1//rsi
b2=4//cci
b3=1//dmi
b4=2//aroon
b5=5//ema
b6=4//supertrend
lr=0.08//step of learning
//-------------------------------------------------------------//
//-----INDICATORS----------------------------------------------//
//-----RSI
rsivalue=rsi[rsilength](close)
//-----CCI
ccivalue=cci[ccilength]((high+low+close)/3)
//-----DMI and DPI
plus=DIplus[dmilength](close)
minus=DIminus[dmilength](close)
//-----AROON
upper=AroonUp[arlength]
lower=AroonDown[arlength]
//-----EMAs
ema1=average[emalength,1](close)
ema2=average[emalength-10,1](close)
//-----SUPERTREND
atr = averagetruerange[atrperiod](close)
src=(high+low)/2
up = src - factor*atr
up1 = up[1]
if close[1] > up1 then
   up = max(up,up1)
else
   up = up
endif

dn = src + factor*atr
dn1 = dn[1]
if close[1] < dn1 then
   dn = min(dn,dn1)
else
   dn = dn
endif

once direction = 1

if direction = -1 and close > dn1 then
   direction = 1
elsif direction = 1 and close < up1 then
   direction = -1
else
   direction = direction
endif

if direction = 1 then
   st = up
else
   st = dn
endif
//-------------------------------------------------------------//
//-----Normalized indicators-----------------------------------//
//-----Normalized close
basis=average[length](close)
zscore=(close-basis)/std[length](close)
if zscore > 0 then
   y=1
else
   y=-1
endif
//-----Normalized RSI
if rsivalue > 50 then
   x1=1
else
   x1=-1
endif
//-----Normalized CCI
if ccivalue crosses over 100 then
   x2=1
elsif ccivalue crosses under -100 then
   x2=-1
endif
//-----Normalized DMI
if plus > minus then
   x3=1
else
   x3=-1
endif
//-----Normalized Aroon
if upper > lower then
   x4=1
else
   x4=-1
endif
//-----Normalized ema
if ema1 > ema2 then
   x5=-1
else
   x5=1
endif
//-----Normalized Supertrend
x6=direction*(1)
//-------------------------------------------------------------//
//-----MULTIPLE LOGISTIC REGRESSION----------------------------//
//-----Pre Multiple Logic Regression
p=1/(1+exp(-(b0+b1*x1+b2*x2+b3*x3+b4*x4+b5*x5+b6*x6)))
//-----Loss
myloss=(-y)*log(p)-(1-y)*log(1-p)
//-----Adjusting model weights using gradient descent
b11=b1-lr*(p+myloss)*x1
b22=b2-lr*(p+myloss)*x2
b33=b3-lr*(p+myloss)*x3
b44=b4-lr*(p+myloss)*x4
b55=b5-lr*(p+myloss)*x5
b66=b6-lr*(p+myloss)*x6
//-----Multiple Logic Regression With adjusted weights based on loss function
lreg=1/(1+exp(-(b0+b11*x1+b22*x2+b33*x3+b44*x4+b55*x5+b66*x6)))
//-------------------------------------------------------------//
//-----PLOT----------------------------------------------------//
//-----Color
if lreg>=0.5 then
   r=0
   g=255
else
   r=255
   g=0
endif
//-----SMA
sma=average[10](close)
//-------------------------------------------------------------//
//-----SIGNALS-------------------------------------------------//
if lreg crosses over 0.5 then
   $crossupx[z+1]=barindex
   $crossup[z+1]=low
   z=z+1
elsif lreg crosses under 0.5 then
   $crossdnx[t+1]=barindex
   $crossdn[t+1]=high
   t=t+1
endif
for i=0 to z do
   drawtext("▲",$crossupx[i],$crossup[i])coloured("green")
next
for j=0 to t do
   drawtext("▼",$crossdnx[j],$crossdn[j])coloured("red")
next
//-------------------------------------------------------------//
//-----TABLE---------------------------------------------------//
//-----Variable
drawtext("Variable",-200,-60)anchor(topRIGHT ,XSHIFT ,YSHIFT )
drawtext("RSI",-200,-80)anchor(topRIGHT ,XSHIFT ,YSHIFT )
drawtext("CCI",-200,-100)anchor(topRIGHT ,XSHIFT ,YSHIFT )
drawtext("DMI",-200,-120)anchor(topRIGHT ,XSHIFT ,YSHIFT )
drawtext("AROON",-200,-140)anchor(topRIGHT ,XSHIFT ,YSHIFT )
drawtext("EMA",-200,-160)anchor(topRIGHT ,XSHIFT ,YSHIFT )
drawtext("SuperT",-200,-180)anchor(topRIGHT ,XSHIFT ,YSHIFT )
//-----Val
drawtext("Val",-150,-60)anchor(topRIGHT ,XSHIFT ,YSHIFT )
drawtext("#x1#",-150,-80)anchor(topRIGHT ,XSHIFT ,YSHIFT )
drawtext("#x2#",-150,-100)anchor(topRIGHT ,XSHIFT ,YSHIFT )
drawtext("#x3#",-150,-120)anchor(topRIGHT ,XSHIFT ,YSHIFT )
drawtext("#x4#",-150,-140)anchor(topRIGHT ,XSHIFT ,YSHIFT )
drawtext("#x5#",-150,-160)anchor(topRIGHT ,XSHIFT ,YSHIFT )
drawtext("#x6#",-150,-180)anchor(topRIGHT ,XSHIFT ,YSHIFT )
//-----Beta
drawtext("Beta",-100,-60)anchor(topRIGHT ,XSHIFT ,YSHIFT )
drawtext("#b11#",-100,-80)anchor(topRIGHT ,XSHIFT ,YSHIFT )
drawtext("#b22#",-100,-100)anchor(topRIGHT ,XSHIFT ,YSHIFT )
drawtext("#b33#",-100,-120)anchor(topRIGHT ,XSHIFT ,YSHIFT )
drawtext("#b44#",-100,-140)anchor(topRIGHT ,XSHIFT ,YSHIFT )
drawtext("#b55#",-100,-160)anchor(topRIGHT ,XSHIFT ,YSHIFT )
drawtext("#b66#",-100,-180)anchor(topRIGHT ,XSHIFT ,YSHIFT )
//-----Rectangle
drawrectangle(-250,-200,-80,-40)anchor(topRIGHT ,XSHIFT ,YSHIFT )fillcolor("blue",50)
//-------------------------------------------------------------//
return sma as "SMA"coloured(r,g,0)style(line,3)

Comments
You must be logged in to post a comment.


The .itf files (now) associated with the Platform was me making a recent attempt to fix the problem.
NOTE: I am NOT getting the download and open in PRT problem with all files from the new PRC website as I just successfully downloaded and opened the file Perpetual-LinearRegress-Channels .itf file uploaded by LucasBest.
For the Record: I have just:
- Cleared my browser cache then tried the download - still same error.
- Reinstalled the PRT Launcher then tried the download - still same error.
- Opened PRT using Chrome browser then tried the download - still same error.
@Nicolas did you see on the link below where JC_Bywan confirmed the problem I am having, but it seemed he had to use a different Account (debug Account) to reproduce the problem?
https://www.prorealcode.com/topic/my-ichimoku-setup-for-scalping-eth/#post-256929.
Weird, there have been 86 downloads of this Indicator and yet nobody has reported any problems re opening the downloaded .if file in PRT.
I get the attached error message when I try and open the .itf file in PRT.
I had the same problem with an .itf in a 'Group', further details and confirmation from JC_Bywan are on the link below.
https://www.prorealcode.com/topic/my-ichimoku-setup-for-scalping-eth/#post-256929.
I'm flagging this up, partly to make it easier for others to say - Yes I had that problem?
I'm flagging this so that it can be sorted before multitudes of files need correction (by overworked Nicolas?) if the problem is multiplying across many locations?
(Ah we are in the Library, so I can't add a screenshot, but the error message is the same as in the link above, but including the filename "PRC_Multip-Logistic-Regression.itf)
Btw I am running Windows 10 and using Edge browser and PRT v12 in case this has any bearing on the error I am experiencing across multiple .itf files since we got the new PRC website.
Hi GraHal, just made a test to import this on v12 and had no issue. I start to wondering if there is an issue with your computer, since you shown us that the itf file type was now associate in windows with the platform.. Would you consider making a support ticket and explain this please? I'll catch it and do a deeper investigation backend. Sorry for that.

Que interesante Ivan, gracias. Voy a investigar las funciones matematicas el indicador se ve muy bien lo voy a probar. Se me ocurre que podria estar muy bien como un filtro lo vere? Gracias

Great Great indicator!!! Thank you Ivan!

@Nicolas said:
Would you consider making a support ticket and explain this please?
Do you mean a PRT Technical Report or a 'Contact Us' from the PRC website?
I will submit whichever Report you instruct me to Nicolas?
In view of 1. and 2. above - in my opinion - the problem, I am experiencing, is not due to the PRT Platform.
For the record, I just removed .itf file associations to the PRT Platform and downloaded a fresh .itf file from this Topic.
I still get the same error ... I cannot open the ,itf file downloaded (after removal of file associations) from this Topic in PRT.