Machine Learning Pivot Points (KNN)
Introduction
Most pivot tools tell you where a turn happened once enough bars have passed to confirm it. Machine Learning Pivot Points (KNN), by Steversteves, asks a different question: does the way price is moving right now look more like the moves that led into past pivot highs, or like the ones that led into past pivot lows?
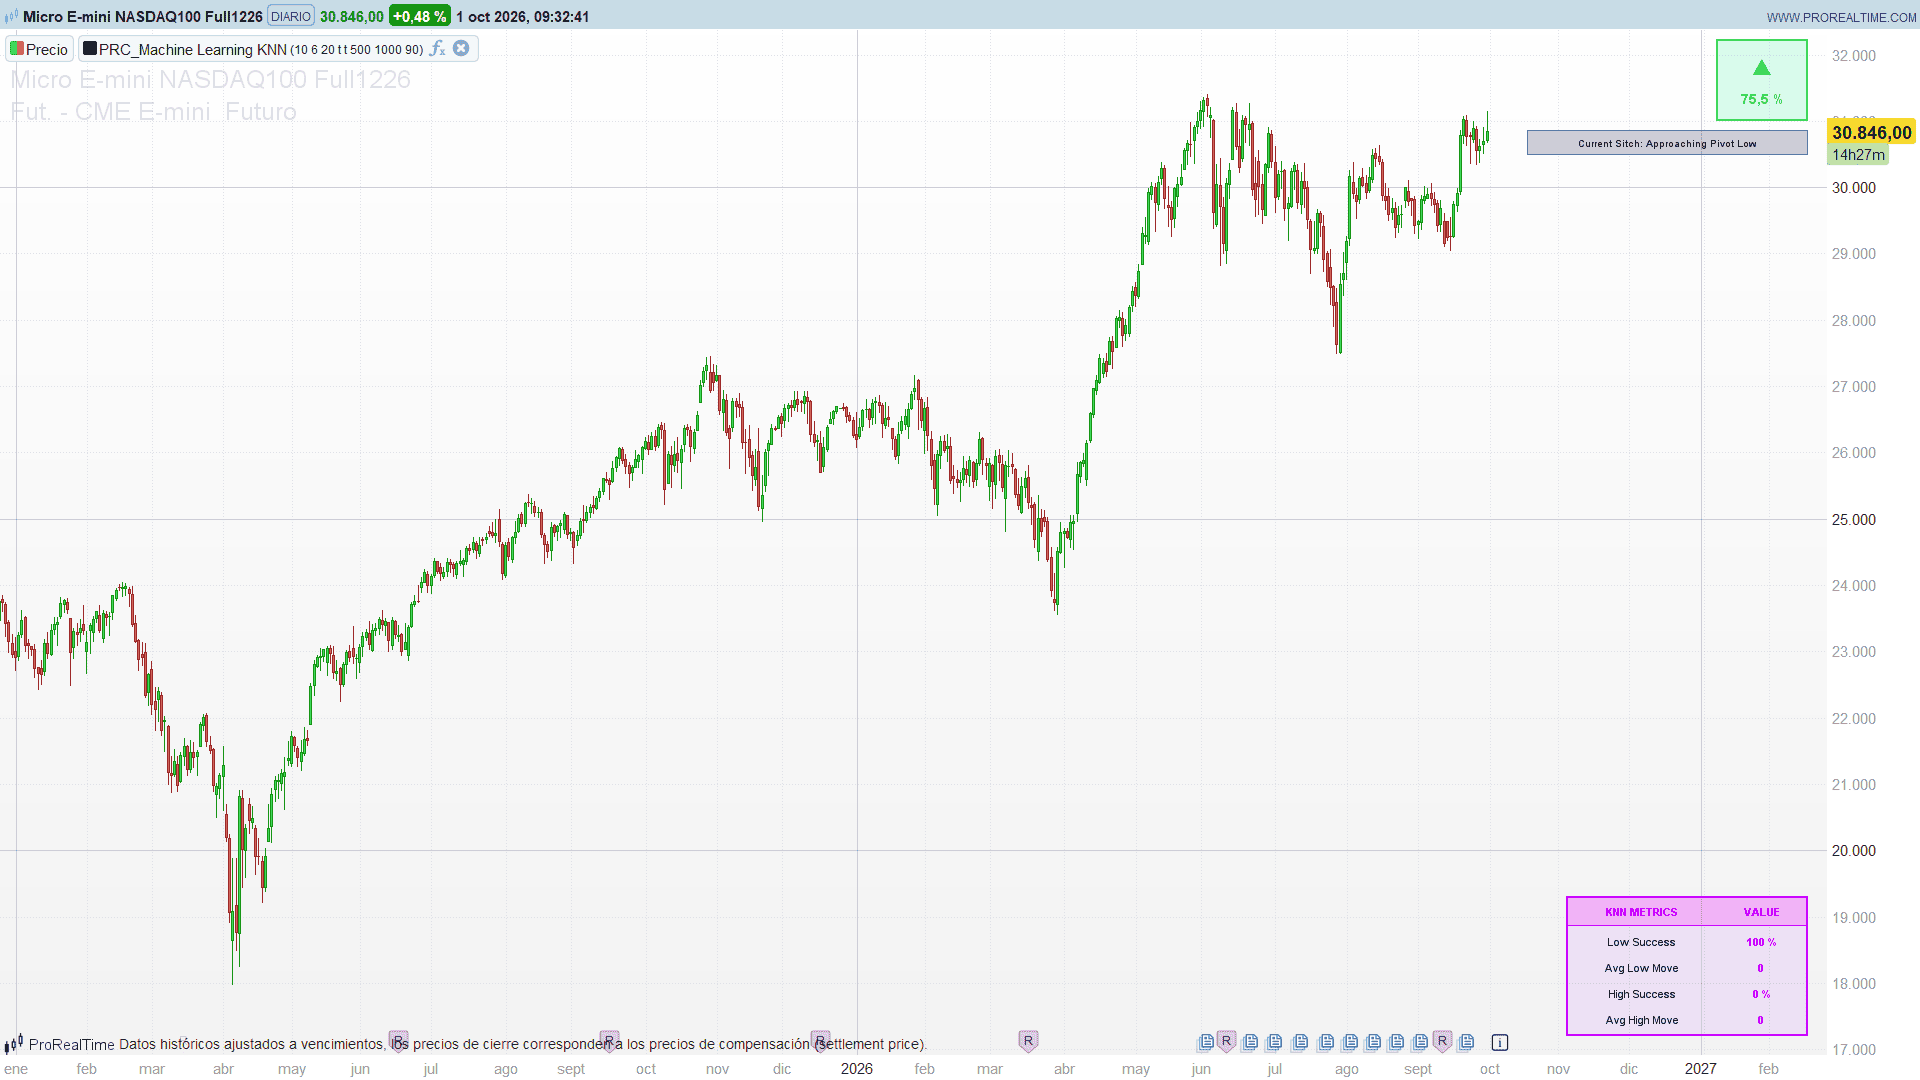
To answer it, the indicator stores the geometry of every confirmed pivot as a regression slope and compares the current slope with that memory using a k-nearest neighbours (KNN) classifier. The result is a directional bias with a confidence percentage, shown on every bar in a panel at the top right of the chart.
Theory Behind the Indicator
The memory: the slope that led into each pivot
A pivot high is a bar whose high is the highest of the 10 bars on each side (a pivot low, the same with lows). Each time one is confirmed, the indicator fits a least-squares line through the 20 bars that end on the pivot bar and stores its slope. Pivot highs and pivot lows go into two separate lists, so the model keeps a growing library of “what the approach to a top looks like” and “what the approach to a bottom looks like”.
The query: the current slope
On every bar, the indicator computes the slope of the linear regression of the close over the last 20 bars.
The classifier: k nearest neighbours
For each family, the indicator measures the distance between the current slope and every stored slope, keeps the k smallest distances (k = 2 by default) and averages them. The family with the smaller average distance wins:
- Closer to the pivot high library: Approaching Pivot High.
- Closer to the pivot low library: Approaching Pivot Low.
- Exactly the same distance (or no data yet): Neutral.
The confidence is 100 x (1 – winning distance / sum of both distances). At 50% the two families are equally close; the higher the value, the more clearly the current slope resembles one of them.
Key Features at a Glance
- Pivot detection with a configurable number of bars on each side
- A library of regression slopes, one per confirmed pivot high and pivot low, that grows with the chart
- KNN classification of the current slope with an adjustable number of neighbours
- Directional helper (top right): arrow and confidence percentage, coloured by the current class
- Current class in plain text under the helper
- Glowing triangle and “Pivot High / Pivot Low” label with the confidence when the class leaves the neutral state; small arrows for the signals older than 500 bars
- Backtest panel (bottom right) with the success rates and average moves of the signals of the last 1,000 bars
How to Read the Indicator
- The directional helper is the live reading. A red down arrow means the current slope looks like the approach to past pivot highs; a green up arrow, like the approach to past pivot lows. “WAIT” means the model has no preference.
- The confidence tells you how decisive that reading is. Values close to 50% mean both libraries are almost equally close, so the class can flip on the next bar.
- The triangles mark the bars where the classifier leaves the neutral state. Neutral requires the two distances to be exactly equal, so this happens mainly when the model starts receiving data from both pivot families; once both libraries are filled, the class usually switches directly between the two states and new triangles are rare. The helper is what tracks the bias bar by bar.
- The backtest panel summarises the triangle signals of the last 1,000 bars. With few or no signals in that window, its values stay at 0.
Practical Applications
- Context for pivot trading. A reading of “Approaching Pivot High” with high confidence while price reaches a resistance level adds weight to a reversal scenario; the opposite reading suggests the move into that level does not look like past tops.
- Filtering entries. Use the class as a filter: look for longs only when the slope resembles the approach to past lows, and shorts in the opposite case.
- Tuning the memory. More neighbours (k) make the classification smoother and less sensitive to a single similar pivot. A longer pivot window describes a broader approach to the pivot; the author suggests at least twice the pivot length.
The classification describes similarity with past pivots. It does not say how far price will go or when the pivot will form.
Indicator Configuration
pivLen(default: 10): bars on each side that confirm a pivot. It also sets where the stored slope ends.knnK(default: 2): number of nearest stored slopes averaged by the classifier. More neighbours, stricter and smoother classification.lenW(default: 20): pivot window, the number of bars of each regression slope. Keep it at least twicepivLen.showHelper(default: 1): directional helper at the top right.showStats(default: 1): backtest panel at the bottom right.recentBars(default: 500): signals older than this number of bars are drawn as small arrows instead of triangles.statBars(default: 1000): window, in bars, of the signals counted by the backtest panel.panelGap(default: 70): pixels kept free on the right of the window for the price scale. Raise it if the panels look cut.- Colours:
hiR/G/B(pivot high),lwR/G/B(pivot low),pkR/G/BandpuR/G/B(panel accents).
Apply the indicator on the price chart. Signals and panels are redrawn on the last bar.
Code
//---------------------------------------------------------------
// PRC_Machine Learning KNN
// version = 0
// 01.10.2026
// Iván González @ www.prorealcode.com
// Author: Steversteves
// Sharing ProRealTime knowledge
//--------------------------------------------------------------------//
// Apply it on the price chart.
// Every confirmed pivot stores the regression slope of the "lenW" bars that led to it.
// On each bar, the current regression slope is compared with the stored slopes of pivot highs
// and pivot lows (k nearest neighbours): the closer family gives the class of the bar.
// When the class leaves "Neutral", a triangle marks the expected pivot.
DEFPARAM DRAWONLASTBARONLY = true

//----- Parameters
pivLen = 10            // bars left/right of a pivot
knnK = 2               // KNN clusters: number of nearest stored pivots averaged (2 suggested)
lenW = 20              // pivot window: slope lookback, at least twice pivLen
showHelper = 1         // 1 = directional helper (top right): current bias and confidence
showStats = 1          // 1 = backtest panel (bottom right)
recentBars = 500       // signals older than this (bars from the last one) are drawn as small arrows
statBars = 1000        // signals of the last statBars bars feed the backtest panel
panelGap = 70          // pixels kept free on the right for the price scale (raise it if the panels are cut)

//----- Colours
hiR = 242              // pivot high (red)
hiG = 54
hiB = 69
lwR = 0                // pivot low (lime)
lwG = 230
lwB = 118
pkR = 255              // panel accent (neon pink)
pkG = 0
pkB = 255
puR = 157              // panel accent (neon purple)
puG = 0
puB = 255

once nHi = 0           // stored pivot high slopes
once nLo = 0           // stored pivot low slopes
once nTr = 0           // stored signals
once lastPredHi = 0    // high of the last "Approaching Pivot High" signal
once lastPredLo = 0    // low of the last "Approaching Pivot Low" signal

myAtr = averagetruerange[14]

//----- 1. Pivots: store the slope of the lenW bars that end on the pivot bar
// The slope uses the bar offset as x (offset pivLen to pivLen + lenW - 1), as in the original.
// The arrays are written by pure assignment on a scalar counter, so a pivot that disappears
// later in the same bar leaves nothing behind: the counter goes back with the other scalars.
IF barindex >= 2 * pivLen AND barindex >= pivLen + lenW - 1 AND lenW > 1 THEN
   isPh = 0
   isPl = 0
   IF high[pivLen] = highest[2 * pivLen + 1](high) THEN
      isPh = 1
   ENDIF
   IF low[pivLen] = lowest[2 * pivLen + 1](low) THEN
      isPl = 1
   ENDIF
   IF isPh = 1 OR isPl = 1 THEN
      sx = 0
      sx2 = 0
      syH = 0
      sxyH = 0
      syL = 0
      sxyL = 0
      FOR i = pivLen TO pivLen + lenW - 1 DO
         sx = sx + i
         sx2 = sx2 + i * i
         syH = syH + high[i]
         sxyH = sxyH + i * high[i]
         syL = syL + low[i]
         sxyL = sxyL + i * low[i]
      NEXT
      den = lenW * sx2 - sx * sx
      IF isPh = 1 THEN
         $hiSl[nHi] = (lenW * sxyH - sx * syH) / den
         nHi = nHi + 1
      ENDIF
      IF isPl = 1 THEN
         $loSl[nLo] = (lenW * sxyL - sx * syL) / den
         nLo = nLo + 1
      ENDIF
   ENDIF
ENDIF

//----- 2. KNN: mean distance to the knnK nearest stored slopes of each family
cls = 0                // 1 = Approaching Pivot High, -1 = Approaching Pivot Low, 0 = Neutral
conf = 0
IF barindex >= lenW - 1 THEN
   curSl = LinearRegressionSlope[lenW](close)

   // pivot highs
   distHi = 1000000
   IF nHi >= knnK THEN
      FOR q = 0 TO knnK - 1 DO
         $best[q] = 999999999999
      NEXT
      FOR i = 0 TO nHi - 1 DO
         d = abs(curSl - $hiSl[i])
         IF d < $best[knnK - 1] THEN
            pos = knnK - 1
            IF knnK > 1 THEN
               FOR q = knnK - 1 DOWNTO 1 DO
                  IF $best[q - 1] > d THEN
                     $best[q] = $best[q - 1]
                     pos = q - 1
                  ENDIF
               NEXT
            ENDIF
            $best[pos] = d
         ENDIF
      NEXT
      sumD = 0
      FOR q = 0 TO knnK - 1 DO
         sumD = sumD + $best[q]
      NEXT
      distHi = sumD / knnK
   ELSIF nHi > 0 THEN
      distHi = abs(curSl - $hiSl[0])
   ENDIF

   // pivot lows
   distLo = 1000000
   IF nLo >= knnK THEN
      FOR q = 0 TO knnK - 1 DO
         $best[q] = 999999999999
      NEXT
      FOR i = 0 TO nLo - 1 DO
         d = abs(curSl - $loSl[i])
         IF d < $best[knnK - 1] THEN
            pos = knnK - 1
            IF knnK > 1 THEN
               FOR q = knnK - 1 DOWNTO 1 DO
                  IF $best[q - 1] > d THEN
                     $best[q] = $best[q - 1]
                     pos = q - 1
                  ENDIF
               NEXT
            ENDIF
            $best[pos] = d
         ENDIF
      NEXT
      sumD = 0
      FOR q = 0 TO knnK - 1 DO
         sumD = sumD + $best[q]
      NEXT
      distLo = sumD / knnK
   ELSIF nLo > 0 THEN
      distLo = abs(curSl - $loSl[0])
   ENDIF

   // class and confidence
   totD = distHi + distLo
   IF totD > 0 THEN
      conf = 100 * (1 - distHi / totD)
   ENDIF
   IF distHi < distLo THEN
      cls = 1
      conf = 100 * (1 - distHi / totD)
   ELSIF distLo < distHi THEN
      cls = -1
      conf = 100 * (1 - distLo / totD)
   ENDIF
ENDIF

//----- 3. Signals: the class leaves "Neutral"
IF barindex > 0 THEN
   IF cls[1] = 0 AND cls = 1 THEN
      lastPredHi = high
      $tX[nTr] = barindex
      $tT[nTr] = 1
      $tH[nTr] = high
      $tL[nTr] = low
      $tA[nTr] = myAtr
      $tC[nTr] = conf
      nTr = nTr + 1
   ELSIF cls[1] = 0 AND cls = -1 THEN
      lastPredLo = low
      $tX[nTr] = barindex
      $tT[nTr] = -1
      $tH[nTr] = high
      $tL[nTr] = low
      $tA[nTr] = myAtr
      $tC[nTr] = conf
      nTr = nTr + 1
   ENDIF
ENDIF

//----- 4. Last bar: signals, backtest and panels
IF islastbarupdate THEN
   loCnt = 0
   loPass = 0
   hiCnt = 0
   hiPass = 0
   sumHiMove = 0
   sumLoMove = 0

   IF nTr > 0 THEN
      FOR t = 0 TO nTr - 1 DO
         xT = $tX[t]
         age = barindex - xT
         atrT = $tA[t]
         confTxt = round($tC[t] * 1000) / 1000

         // backtest: signals of the last statBars bars, measured against the last predictions
         IF age <= statBars THEN
            IF $tT[t] = -1 THEN
               loCnt = loCnt + 1
               mv = lastPredHi - $tL[t]
               IF mv > 0 THEN
                  loPass = loPass + 1
                  sumHiMove = sumHiMove + mv
               ENDIF
            ELSE
               hiCnt = hiCnt + 1
               IF lastPredLo <> 0 THEN
                  mv = ($tH[t] - lastPredLo) / lastPredLo * 100
                  IF mv > 0 THEN
                     hiPass = hiPass + 1
                     sumLoMove = sumLoMove + mv
                  ENDIF
               ENDIF
            ENDIF
         ENDIF

         IF age > recentBars THEN
            // old signals: small arrow above / below the bar
            IF $tT[t] = 1 THEN
               DRAWTEXT("▼", xT, $tH[t] + atrT * 0.5, SansSerif, Standard, 10) COLOURED(hiR, hiG, hiB, 153)
            ELSE
               DRAWTEXT("▲", xT, $tL[t] - atrT * 0.5, SansSerif, Standard, 10) COLOURED(lwR, lwG, lwB, 153)
            ENDIF
         ELSIF $tT[t] = 1 THEN
            // expected pivot high: inverted triangle with its tip on the high, plus glow
            yTop = $tH[t] + atrT
            DRAWTRIANGLE(xT - 4, yTop, xT + 4, yTop, xT, $tH[t]) COLOURED(hiR, hiG, hiB, 255) FILLCOLOR(hiR, hiG, hiB, 64) STYLE(line, 1)
            DRAWTRIANGLE(xT - 4, yTop, xT + 4, yTop, xT, $tH[t]) COLOURED(hiR, hiG, hiB, 102) FILLCOLOR(hiR, hiG, hiB, 0) STYLE(line, 3)
            DRAWTRIANGLE(xT - 4, yTop, xT + 4, yTop, xT, $tH[t]) COLOURED(hiR, hiG, hiB, 38) FILLCOLOR(hiR, hiG, hiB, 0) STYLE(line, 5)
            DRAWTEXT("Pivot High", xT, yTop + atrT * 0.55, SansSerif, Bold, 9) COLOURED(hiR, hiG, hiB, 255)
            DRAWTEXT("Conf: #confTxt#", xT, yTop + atrT * 0.2, SansSerif, Standard, 9) COLOURED(hiR, hiG, hiB, 255)
         ELSE
            // expected pivot low: triangle with its tip on the low, plus glow
            yBot = $tL[t] - atrT
            DRAWTRIANGLE(xT - 4, yBot, xT + 4, yBot, xT, $tL[t]) COLOURED(lwR, lwG, lwB, 255) FILLCOLOR(lwR, lwG, lwB, 64) STYLE(line, 1)
            DRAWTRIANGLE(xT - 4, yBot, xT + 4, yBot, xT, $tL[t]) COLOURED(lwR, lwG, lwB, 102) FILLCOLOR(lwR, lwG, lwB, 0) STYLE(line, 3)
            DRAWTRIANGLE(xT - 4, yBot, xT + 4, yBot, xT, $tL[t]) COLOURED(lwR, lwG, lwB, 38) FILLCOLOR(lwR, lwG, lwB, 0) STYLE(line, 5)
            yLab = $tL[t] - atrT * 1.5
            DRAWTEXT("Pivot Low", xT, yLab + atrT * 0.15, SansSerif, Bold, 9) COLOURED(lwR, lwG, lwB, 255)
            DRAWTEXT("Conf: #confTxt#", xT, yLab - atrT * 0.2, SansSerif, Standard, 9) COLOURED(lwR, lwG, lwB, 255)
         ENDIF
      NEXT
   ENDIF

   // "Low Success" / "High Success" as defined by the author: abs(pass / count - 1) * 100
   lowSucc = 0
   IF loCnt > 0 THEN
      lowSucc = round(abs((loPass / loCnt - 1) * 100) * 10) / 10
   ENDIF
   highSucc = 0
   IF hiCnt > 0 THEN
      highSucc = round(abs((hiPass / hiCnt - 1) * 100) * 10) / 10
   ENDIF
   // "Avg Low Move" averages the positive moves after pivot high signals and
   // "Avg High Move" the ones after pivot low signals, as in the original
   avgLowMove = 0
   IF hiPass > 0 THEN
      avgLowMove = round(sumLoMove / hiPass * 100) / 100
   ENDIF
   avgHighMove = 0
   IF loPass > 0 THEN
      avgHighMove = round(sumHiMove / loPass * 100) / 100
   ENDIF

   // panels are anchored to the window corner, which lies under the price scale:
   // their right edge is moved panelGap pixels to the left so they are not cut
   pxR = 0 - 20 - panelGap

   // directional helper + current class (top right, pixels from the window corner)
   IF cls = 1 THEN
      hudR = hiR
      hudG = hiG
      hudB = hiB
   ELSIF cls = -1 THEN
      hudR = lwR
      hudG = lwG
      hudB = lwB
   ELSE
      hudR = 120
      hudG = 123
      hudB = 134
   ENDIF
   IF showHelper = 1 THEN
      confHud = round(conf * 10) / 10
      DRAWRECTANGLE(pxR - 90, 0 - 10, pxR, 0 - 90) ANCHOR(TOPRIGHT, XSHIFT, YSHIFT) COLOURED(hudR, hudG, hudB, 255) FILLCOLOR(hudR, hudG, hudB, 38) STYLE(line, 2)
      IF cls = 1 THEN
         DRAWTEXT("▼", pxR - 45, 0 - 35, SansSerif, Bold, 22) ANCHOR(TOPRIGHT, XSHIFT, YSHIFT) COLOURED(hudR, hudG, hudB, 255)
      ELSIF cls = -1 THEN
         DRAWTEXT("▲", pxR - 45, 0 - 35, SansSerif, Bold, 22) ANCHOR(TOPRIGHT, XSHIFT, YSHIFT) COLOURED(hudR, hudG, hudB, 255)
      ELSE
         DRAWTEXT("WAIT", pxR - 45, 0 - 35, SansSerif, Bold, 16) ANCHOR(TOPRIGHT, XSHIFT, YSHIFT) COLOURED(hudR, hudG, hudB, 255)
      ENDIF
      DRAWTEXT("#confHud#%", pxR - 45, 0 - 68, SansSerif, Bold, 14) ANCHOR(TOPRIGHT, XSHIFT, YSHIFT) COLOURED(hudR, hudG, hudB, 255)
   ENDIF
   DRAWRECTANGLE(pxR - 280, 0 - 100, pxR, 0 - 124) ANCHOR(TOPRIGHT, XSHIFT, YSHIFT) COLOURED(120, 123, 134, 255) FILLCOLOR(120, 123, 134, 90)
   IF cls = 1 THEN
      DRAWTEXT("Current Sitch: Approaching Pivot High", pxR - 140, 0 - 112, SansSerif, Standard, 10) ANCHOR(TOPRIGHT, XSHIFT, YSHIFT) COLOURED(0, 0, 0, 255)
   ELSIF cls = -1 THEN
      DRAWTEXT("Current Sitch: Approaching Pivot Low", pxR - 140, 0 - 112, SansSerif, Standard, 10) ANCHOR(TOPRIGHT, XSHIFT, YSHIFT) COLOURED(0, 0, 0, 255)
   ELSE
      DRAWTEXT("Current Sitch: Neutral", pxR - 140, 0 - 112, SansSerif, Standard, 10) ANCHOR(TOPRIGHT, XSHIFT, YSHIFT) COLOURED(0, 0, 0, 255)
   ENDIF

   // backtest panel (bottom right)
   IF showStats = 1 THEN
      DRAWRECTANGLE(pxR - 240, 158, pxR, 20) ANCHOR(BOTTOMRIGHT, XSHIFT, YSHIFT) COLOURED(puR, puG, puB, 255) FILLCOLOR(puR, puG, puB, 20) STYLE(line, 2)
      DRAWRECTANGLE(pxR - 240, 158, pxR, 130) ANCHOR(BOTTOMRIGHT, XSHIFT, YSHIFT) COLOURED(pkR, pkG, pkB, 255) FILLCOLOR(pkR, pkG, pkB, 51)
      DRAWTEXT("KNN METRICS", pxR - 165, 144, SansSerif, Bold, 11) ANCHOR(BOTTOMRIGHT, XSHIFT, YSHIFT) COLOURED(pkR, pkG, pkB, 255)
      DRAWTEXT("VALUE", pxR - 45, 144, SansSerif, Bold, 11) ANCHOR(BOTTOMRIGHT, XSHIFT, YSHIFT) COLOURED(pkR, pkG, pkB, 255)
      DRAWTEXT("Low Success", pxR - 165, 114, SansSerif, Standard, 11) ANCHOR(BOTTOMRIGHT, XSHIFT, YSHIFT) COLOURED(0, 0, 0, 255)
      DRAWTEXT("#lowSucc#%", pxR - 45, 114, SansSerif, Bold, 11) ANCHOR(BOTTOMRIGHT, XSHIFT, YSHIFT) COLOURED(pkR, pkG, pkB, 255)
      DRAWTEXT("Avg Low Move", pxR - 165, 88, SansSerif, Standard, 11) ANCHOR(BOTTOMRIGHT, XSHIFT, YSHIFT) COLOURED(0, 0, 0, 255)
      DRAWTEXT("#avgLowMove#", pxR - 45, 88, SansSerif, Bold, 11) ANCHOR(BOTTOMRIGHT, XSHIFT, YSHIFT) COLOURED(puR, puG, puB, 255)
      DRAWTEXT("High Success", pxR - 165, 62, SansSerif, Standard, 11) ANCHOR(BOTTOMRIGHT, XSHIFT, YSHIFT) COLOURED(0, 0, 0, 255)
      DRAWTEXT("#highSucc#%", pxR - 45, 62, SansSerif, Bold, 11) ANCHOR(BOTTOMRIGHT, XSHIFT, YSHIFT) COLOURED(pkR, pkG, pkB, 255)
      DRAWTEXT("Avg High Move", pxR - 165, 36, SansSerif, Standard, 11) ANCHOR(BOTTOMRIGHT, XSHIFT, YSHIFT) COLOURED(0, 0, 0, 255)
      DRAWTEXT("#avgHighMove#", pxR - 45, 36, SansSerif, Bold, 11) ANCHOR(BOTTOMRIGHT, XSHIFT, YSHIFT) COLOURED(puR, puG, puB, 255)
   ENDIF
ENDIF

RETURN