Utilizing Linear Regression to Enhance Chart Interpretation in Trading
In the world of trading, accurate interpretation of charts is paramount to making informed decisions. Among the plethora of tools and techniques available, linear regression stands out for its simplicity and efficacy.
Linear regression, a fundamental statistical method, helps traders identify the underlying trend of a security’s price by fitting a straight line through the data points. This line, known as the regression line, represents the best estimate of the future price movement, providing a clearer picture of the trend’s direction, strength, and volatility.
By reducing the noise in price data, linear regression makes it easier to spot trends and reversals, offering a solid foundation for both technical analysis and trading strategy development.
Linear Regression Candles Indicator
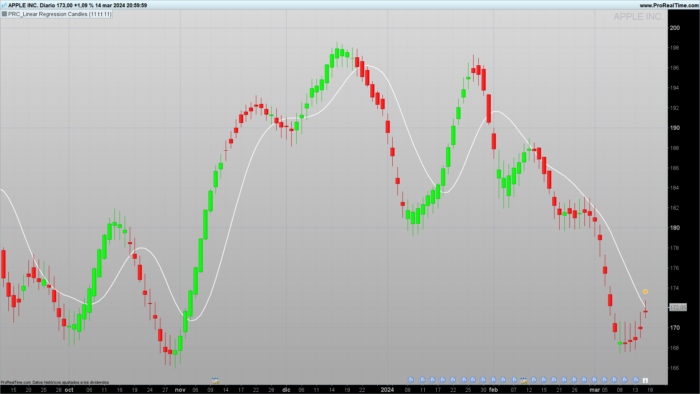
At its core, the indicator recalibrates standard candlestick data using linear regression, creating candles that better reflect the underlying trend’s direction.
Its ability to filter out market noise and present a cleaner trend analysis can significantly enhance decision-making in various trading strategies, including:
Trend Following: Traders can use the indicator to confirm the presence of a strong trend and enter trades in the direction of that trend.
Reversal Detection: The crossover of candles with the signal line can indicate potential trend reversals, providing early entries for counter-trend strategies.
Risk Management: By understanding the trend’s strength and direction, traders can set more informed stop-loss and take-profit levels, improving their risk-to-reward ratios.
The Linear Regression Candles indicator exemplifies how statistical techniques like linear regression can be innovatively applied to enhance traditional trading tools.
By offering a clearer view of the market trend and smoothing out price volatility, this indicator aids traders in navigating the complexities of the financial markets with greater confidence.
Whether for trend identification, reversal signals, or risk management, the Linear Regression Candles indicator is a testament to the continuous evolution of trading strategies in the digital age.
Indicator Configuration
The Linear Regression Candles indicator features several key inputs allowing for customization:
Signallength: Determines the smoothing length for the signal line, applying an average to smoothen out short-term fluctuations.
Smasignal: A boolean input that toggles between using a Simple Moving Average (SMA) or a weighted average for the signal line.
Linreg: Enables or disables the application of linear regression to the candlestick data.
Linreglength: Sets the length over which the linear regression is calculated, affecting the sensitivity of the adjusted candles to recent price changes.
Candle Adjustment and Coloring
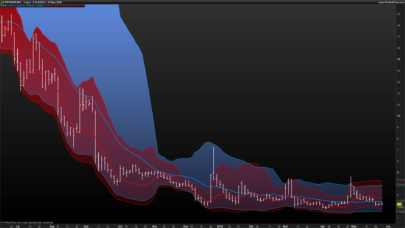
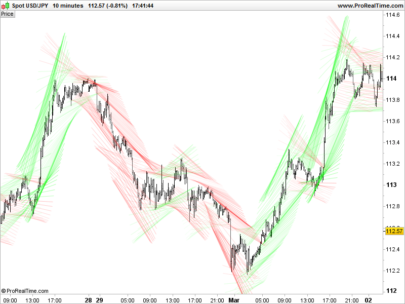
By applying linear regression, the indicator adjusts the open, high, low, and close values of each candle. This adjustment not only highlights the trend more clearly but also colors the candles in green (for bullish) or red (for bearish) based on whether the close is above or below the open.
This visual cue provides an immediate understanding of market sentiment and trend direction.
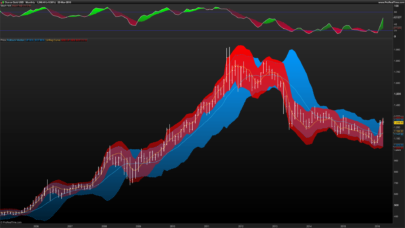
Signal Line and Its Interpretation
A component of the Linear Regression Candles indicator is the signal line, a moving average of the adjusted close prices.
Depending on the user’s preference, this can be a simple or weighted average.
The signal line serves as a trend confirmation tool, helping traders to discern the strength and potential continuation or reversal of a trend.
When the adjusted candles cross above the signal line, it may indicate a buying opportunity, whereas a cross below could signal a selling point.
|
1 2 3 4 5 6 7 8 9 10 11 12 13 14 15 16 17 18 19 20 21 22 23 24 25 26 27 28 29 30 31 32 33 34 35 36 37 38 39 40 41 42 43 44 45 |
//PRC_Linear Regression Candles //version = 0 //15.03.24 //Iván González @ www.prorealcode.com //Sharing ProRealTime knowledge /////////////////////////////////////////////////////// //------------------Inputs------------------------------ signallength = 11 //integer//Signal Smoothing smasignal = 1 //boolean // Simple MA (Signal Line) linreg = 1 //boolean//Linear Regression linreglength = 11//integer//Linear Regression Length //------------------------------------------------------ //-------------Candle definition------------------------ if linreg then bopen = LinearRegression[linreglength](open) bhigh = LinearRegression[linreglength](high) blow = LinearRegression[linreglength](low) bclose = LinearRegression[linreglength](close) else bopen = open bhigh = high blow = low bclose = close endif //-------------------------------------------------------- //--------------Color candles----------------------------- if bopen < bclose then r=0 g=255 else r=255 g=0 endif //--------------------------------------------------------- //---------------Draw Candles------------------------------ DRAWCANDLE(bopen, bhigh, blow, bclose)coloured(r,g,0) //--------------------------------------------------------- //---------------Signal definition------------------------- if smasignal then signal = average[signallength](bclose) else signal = average[signallength,1](bclose) endif return signal as "Signal"coloured("white")style(line,2) |
Share this
No information on this site is investment advice or a solicitation to buy or sell any financial instrument. Past performance is not indicative of future results. Trading may expose you to risk of loss greater than your deposits and is only suitable for experienced investors who have sufficient financial means to bear such risk.
ProRealTime ITF files and other attachments :
Find other exclusive trading pro-tools on ![]()
PRC is also on YouTube, subscribe to our channel for exclusive content and tutorials


Bonjour Ivan,
Merci pour cet indicateur.
Il me semble qu’il y a une erreur à la ligne 42 du code. La moyenne mobile pondérée est “2” dans la bibliothèque PRT.
Bonne journée.
Hi, there is a mistake in post, the code it’s OK.
It’s an exponential average instead weigthed average.
Hola Iván, magnífico indicador. ¿Sería posible hacer un screener sobre él?
Sí, qué quieres buscar?
El cambio de color de rojo a verde. Lo he intentado, pero no lo he conseguido. Lo veo interesante para gráficos semanales y mensuales.
sería así
//——————Inputs——————————
linreglength = 11//integer//Linear Regression Length
//——————————————————
//————-Candle definition————————
bopen = LinearRegression[linreglength](open)
bclose = LinearRegression[linreglength](close)
red = bopen >= bclose
green = bopen < bclose
screener[green and red[1]]
//screener[green[1] and red]
holaaa, have you run some statistics?
Muchísimas gracias Iván, está genial.