
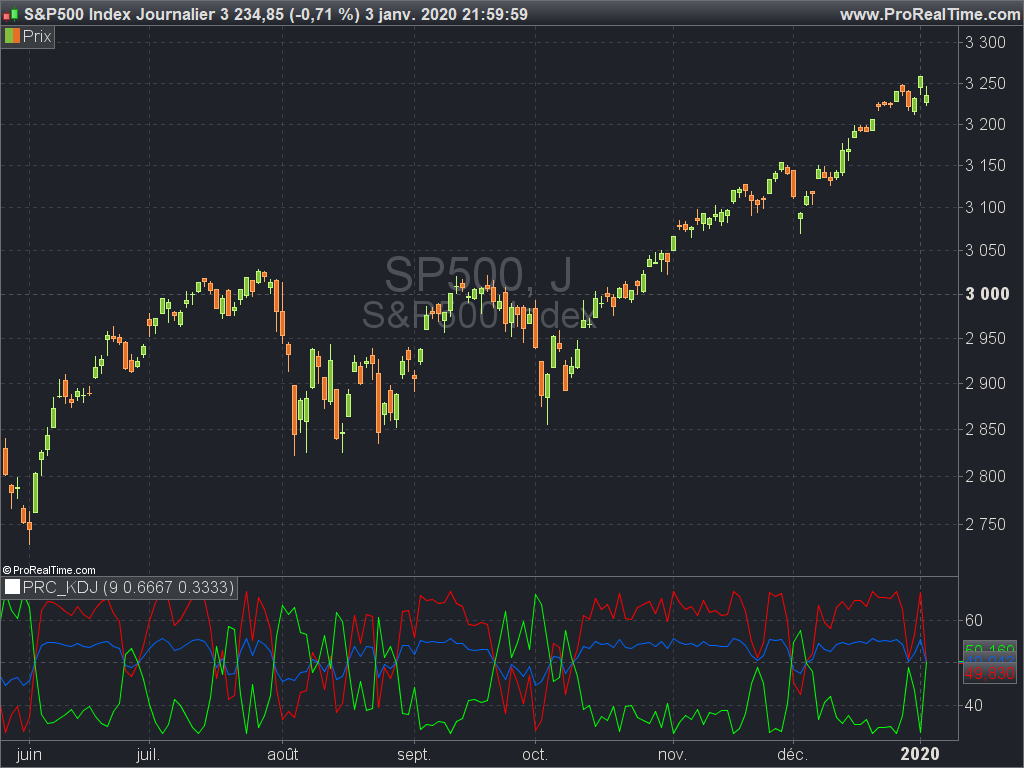
The KDJ indicator is derived from the Stochastic with the one difference being the addition of the J line. This implies that the KDJ indicator has a total of three lines; %K%D%J. The %J is simply put, the difference between the %K and the %D lines, which is similar to the MACD.
The difference between the %J and that of the MACD is that it is plotted as a histogram and the second being that the value are weighted and as such delivers more emphasis on the shorter term %K line.
What we now have is a line that moves quite slowly and has the knack to move beyond the range of a normal stochastic indicator.
This version is different from the one embedded in the platform and was translated from MT4 following a request in the forum.
|
1 2 3 4 5 6 7 8 9 10 11 12 13 14 15 16 17 18 19 20 21 22 23 24 25 26 27 28 29 30 31 32 33 34 35 |
//PRC_KDJ | indicator //09.12.2019 //Nicolas @ www.prorealcode.com //Sharing ProRealTime knowledge //converted from MT4 code // --- settings nPeriod = 9 factor1 = 0.6666666 factor2 = 0.3333333 // --- end of settings Cn=close Ln=close Hn=close for k=0 to nPeriod-1 do if ln>low[k] then ln=low[k] endif if hn<high[k] then hn=high[k] endif next if hn-ln <>0 then rsv=(Cn-Ln)/(Hn-Ln)*100 else RSV = 50 endif percentK = factor1 * 50 + factor2 * RSV percentD = factor1 * 50 + factor2 * percentK percentJ = 3 * percentD - 2 * percentK return percentk coloured(255,0,0), percentd coloured(0,100,255) , percentj coloured(0,255,0) |
Share this
No information on this site is investment advice or a solicitation to buy or sell any financial instrument. Past performance is not indicative of future results. Trading may expose you to risk of loss greater than your deposits and is only suitable for experienced investors who have sufficient financial means to bear such risk.
ProRealTime ITF files and other attachments :
Find other exclusive trading pro-tools on ![]()
PRC is also on YouTube, subscribe to our channel for exclusive content and tutorials


Bonsoir Nicolas. Merci pour tout ton travail.
Quand tu auras le temps pourras-tu jeter un oeil à ceci:
https://www.prorealcode.com/topic/indicateur-divergence-dmi/
Cela ne presse pas. Bien conscient que tu as reçu énormément de demandes durant les fêtes…
Meilleurs voeux et merci d’avance!
Bonsoir,
En remplaçant
percentJ = 3 * percentD – 2 * percentK
par
percentJ = 3 * percentK – 2 * percentD
j’obtiens un %J similaire à celui de l’indicateur.
Bonjour,
A la recherche d’un indicateur détectant les divergences sur DMI, je tombe sur ce post. Votre indicateur sur DMI est-il au point, est-il possible de le partager ?
Merci beaucoup.
Jean