

JK Trend Analyzer Combo 4.1
July 15, 2020, 12:47 PM
Indicators
0 Comments
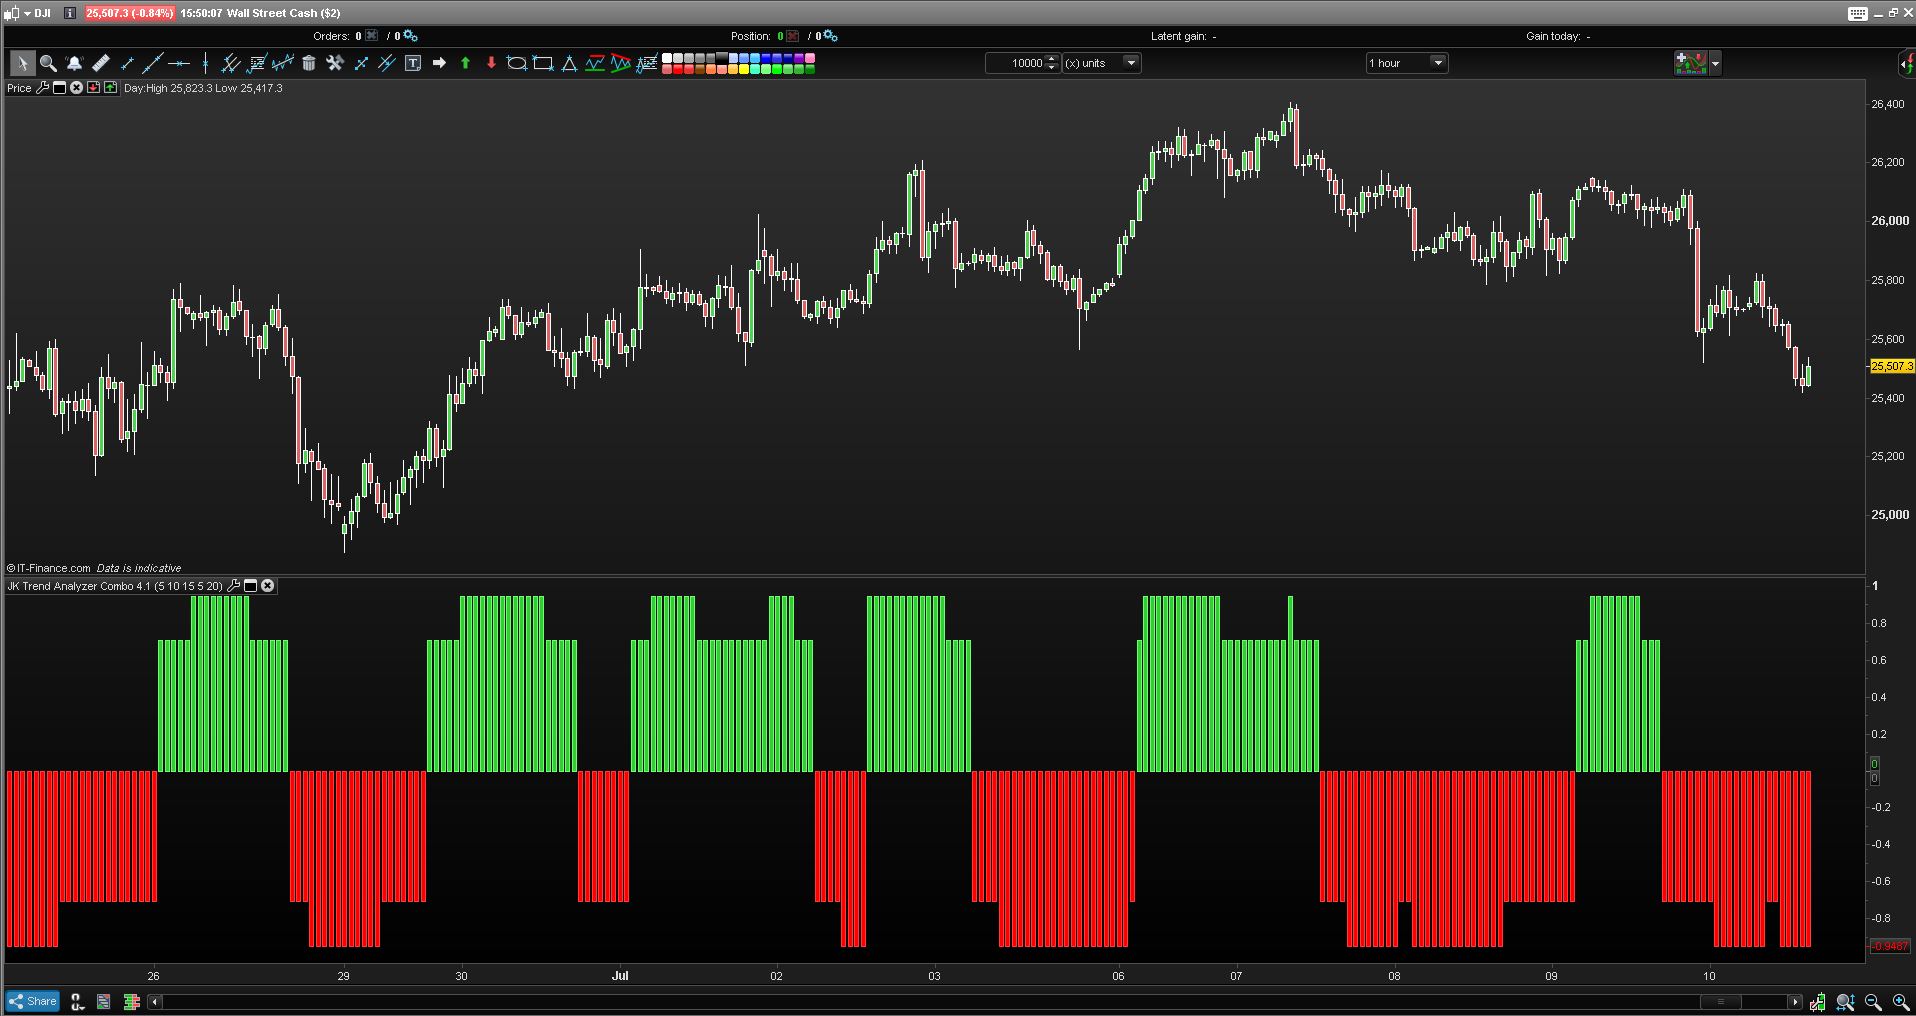
This is a indicator that find an count Elliott Waves. The original idea is coming from https://www.prorealcode.com/prorealtime-indicators/jeffrey-kennedy-trend-analyzer, I transform it to simpler to be used in my strategy. Basically the green is for uptrend and red is for downtrend. Although I find it more reliable on higher time frame, but can be used for any time frame.
I think any new discussion can be directly into here, https://www.prorealcode.com/topic/jeffrey-kennedy-trend-analyzer/
Kudos to the original author @ and @Zigo
//JKFast

//fastLength=5
//slowLength=20

valuefast=ExponentialAverage[fastlength](close)-ExponentialAverage[slowlength](close)

hv5 = Highest[a1](valuefast)
lv5 = Lowest[a1](valuefast)

if hv5 = lv5 then
JKFast5=0
else
JKFast5=((hv5 - valuefast) / (hv5 - lv5) * (-100) + 100)
endif

hv10 = Highest[a2](valuefast)
lv10 = Lowest[a2](valuefast)

if hv10 = lv10 then
JKFast10=0
else
JKFast10=((hv10 - valuefast) / (hv10 - lv10) * (-100) + 100)
endif

hv15 = Highest[a3](valuefast)
lv15 = Lowest[a3](valuefast)

if hv15 = lv15 then
JKFast15=0
else
JKFast15=((hv15 - valuefast) / (hv15 - lv15) * (-100) + 100)
endif

//JK TA

valuebase=ExponentialAverage[fastlength](close)

hv5 = Highest[a1](valuebase)
lv5 = Lowest[a1](valuebase)

if hv5 = lv5 then
JKTA5=0
else
JKTA5=((hv5 - valuebase) / (hv5 - lv5) * (-100) + 100)
endif

hv10 = Highest[a2](valuebase)
lv10 = Lowest[a2](valuebase)

if hv10 = lv10 then
JKTA10=0
else
JKTA10=((hv10 - valuebase) / (hv10 - lv10) * (-100) + 100)
endif

hv15 = Highest[a3](valuebase)
lv15 = Lowest[a3](valuebase)

if hv15 = lv15 then
JKTA15=0
else
JKTA15=((hv15 - valuebase) / (hv15 - lv15) * (-100) + 100)
endif

//JK Slow

valueslow=ExponentialAverage[slowLength](close)

hv5 = Highest[a1](valueslow)
lv5 = Lowest[a1](valueslow)

if hv5 = lv5 then
JKSlow5=0
else
JKSlow5=((hv5 - valueslow) / (hv5 - lv5) * (-100) + 100)
endif

hv10 = Highest[a2](valueslow)
lv10 = Lowest[a2](valueslow)

if hv10 = lv10 then
JKSlow10=0
else
JKSlow10=((hv10 - valueslow) / (hv10 - lv10) * (-100) + 100)
endif

hv15 = Highest[a3](valueslow)
lv15 = Lowest[a3](valueslow)

if hv15 = lv15 then
JKSlow15=0
else
JKSlow15=((hv15 - valueslow) / (hv15 - lv15) * (-100) + 100)
endif

//Return JKFast5 coloured (255,150,255) as "JKFast5", JKFast10 coloured (255,100,255) as "JKFast10", JKFast15 coloured (255,50,255) as "JKFast15", JKSlow5 coloured (150,200,0) as "JKSlow5", JKSlow10 coloured (100,200,0) as "JKSlow10", JKSlow15 coloured (50,200,0) as "JKSlow15", JKTA5 coloured (150,150,255) as "JKTA5", JKTA10 coloured (100,100,255) as "JKTA10", JKTA15 coloured (50,50,255) as "JKTA15"

JKF1=summation[a1](JKFast5)/a1
JKF2=summation[a2](JKFast10)/a2
JKF3=summation[a3](JKFast15)/a3
JKTA1=summation[a1](JKTA5)/a1
JKTA2=summation[a2](JKTA10)/a2
JKTA3=summation[a3](JKTA15)/a3
JKSl1=summation[a1](JKSlow5)/a1
JKSl2=summation[a2](JKSlow10)/a2
JKSL3=summation[a3](JKSlow15)/a3

JKSum1=(jkf1+jkf2+jkf3)/3
jksum2=(jkta1+jkta2+jkta3)/3
jksum3=(jksl1+jksl2+jksl3)/3

if jksum1 > 50 then
F=1
else
F=-1
endif
if jksum2 > 50 then
TA= 1
else
TA=-1
endif
if jksum3 > 50 then
Sl=1
else
sl=-1
endif
sign= sin(atan(F+TA+ Sl))

positivesign = 0
negativesign = 0
nosign = 0
if sign > 0 then
positivesign = sign
elsif sign < 0 then
negativesign = sign
else
nosign = sign
endif

Return positivesign coloured (50,205,50) STYLE(histogram), negativesign coloured (255,0,0) STYLE(histogram), nosign coloured (128,128,128) STYLE(histogram)
Download
Filename:
JK-Trend-Analyzer-Combo-4.1.itf
Downloads:
259
Veteran
Developer by day, aspiring writer by night. Still compiling my bio... Error 404: presentation not found.
Author’s Profile
Loading...