Help needed to translate to PRT
In brief it is built using Williams%R, 5 period or 10 period or 15 period, calculated on (ExponentialMovingAverage[5]-ExponentialMovingAverage[20])
I cannot do it…. it gives me error or, anyway, not what is shown below
from: http://indexswingtrader.blogspot.it/2012/05/so-you-think-you-can-count-but-can-you.html
Followers of R.N. Elliott do count waves. This week Pretzel Logic’s Market Charts and Analysis (see blogroll) published a two part Introduction on understanding Elliott Wave Theory. After reading that 101 on counting waves, a handy tool for counting waves and thus analyzing the wave structure would come in handy, right?
It happens some years ago Elliott Wave International’s chief commodity analyst and “Futures Junctures Service” editor Jeffrey Kennedy” presented his Trend Analyzing Tool in a webinar. On Tuesday, 22 December 2009, EWI disclosed the formula to the public on their website.
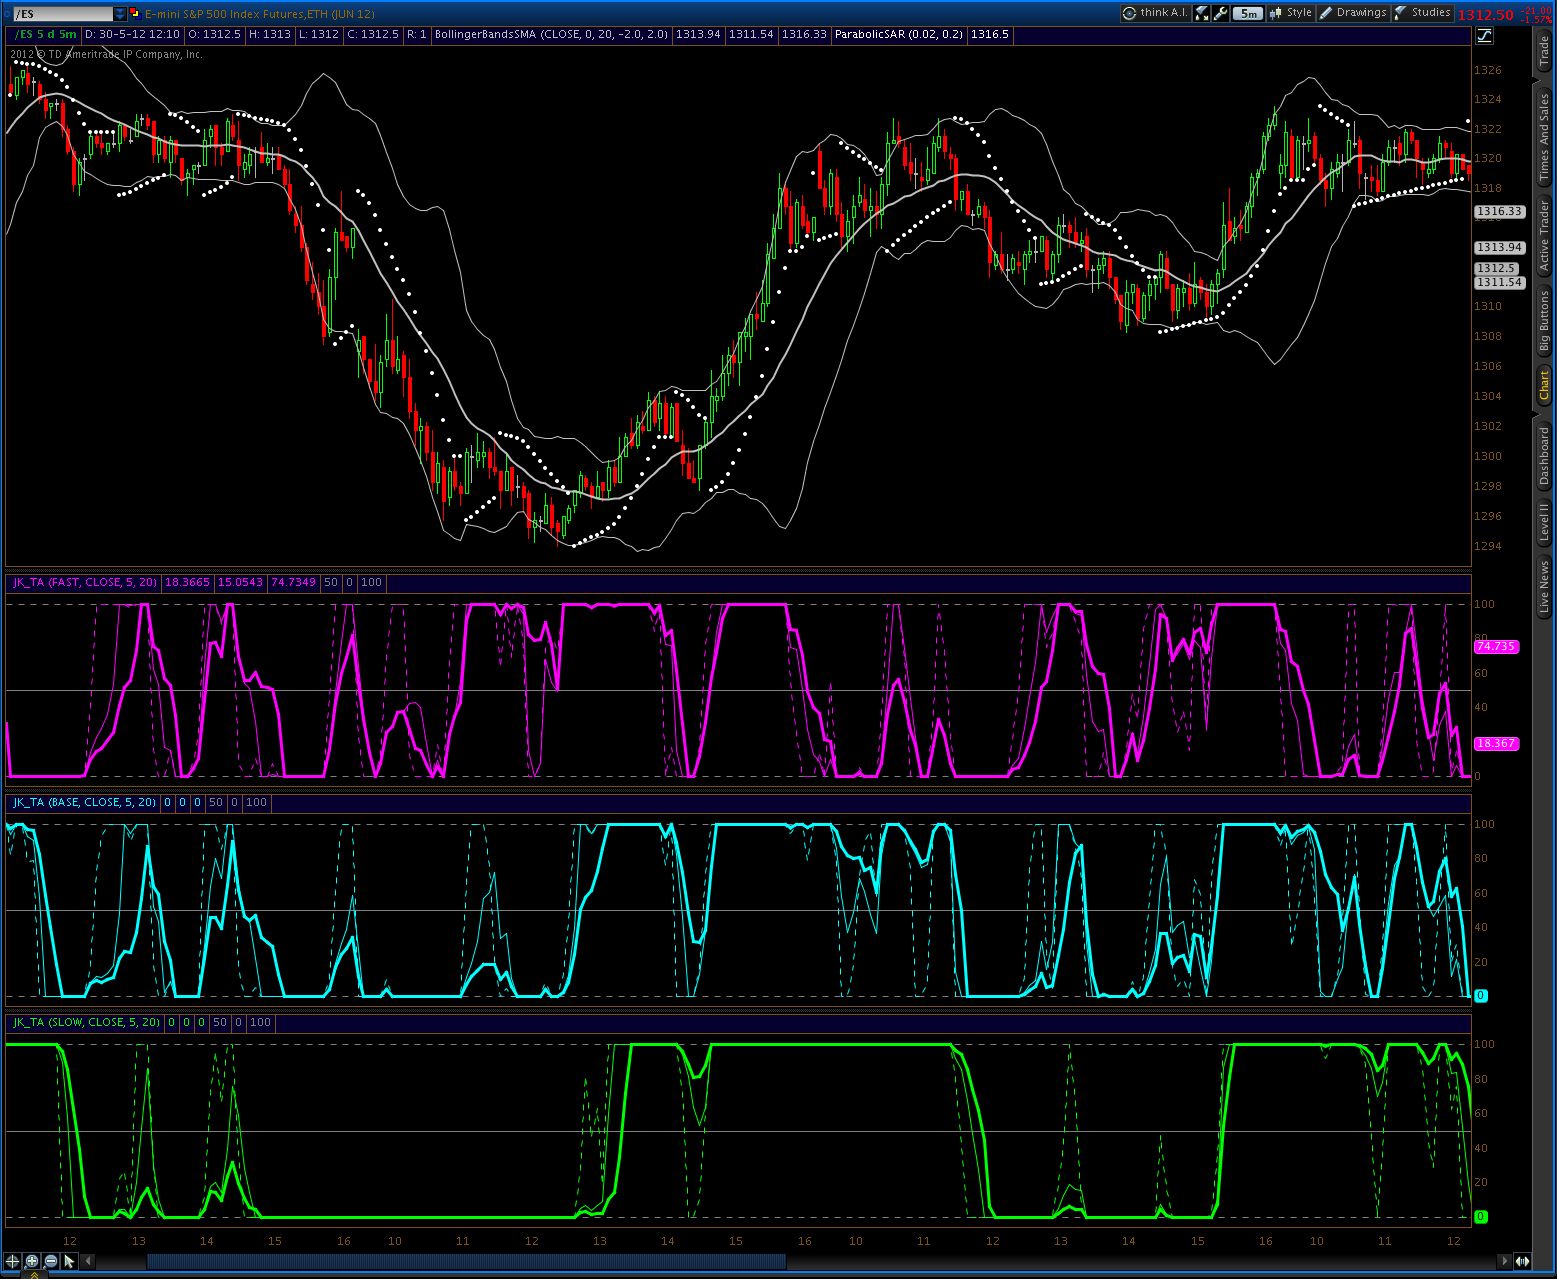
JK Fast Line measures the most immediate, near-term progression of a market’s trend and smallest degree of the Elliott wave structure.
JK Base Line measures the intermediate progression of a market’s trend.
JK Slow Line (not show on screen shot) measures the long-term progression of a market’s trend.
In the original JK_TA each panel of the indicator consists of three lines: a 5-period %R, a 10-period %R and a 15-period %R of the line concerned.
A reading of 100 indicates an uptrend. A reading of 0 indicates a downtrend.
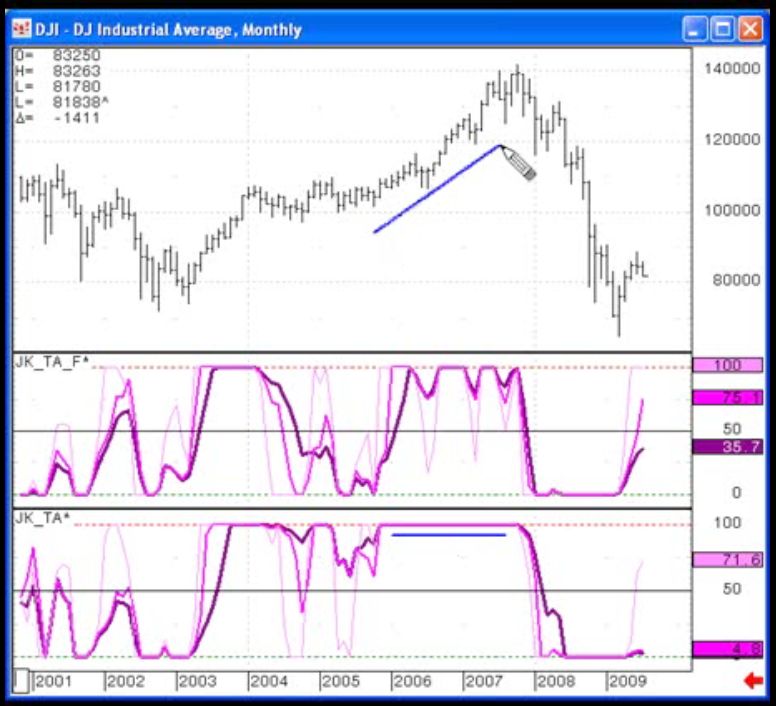
The JK TA as such is as a proxy for clarifying the underlying Elliott wave structure:
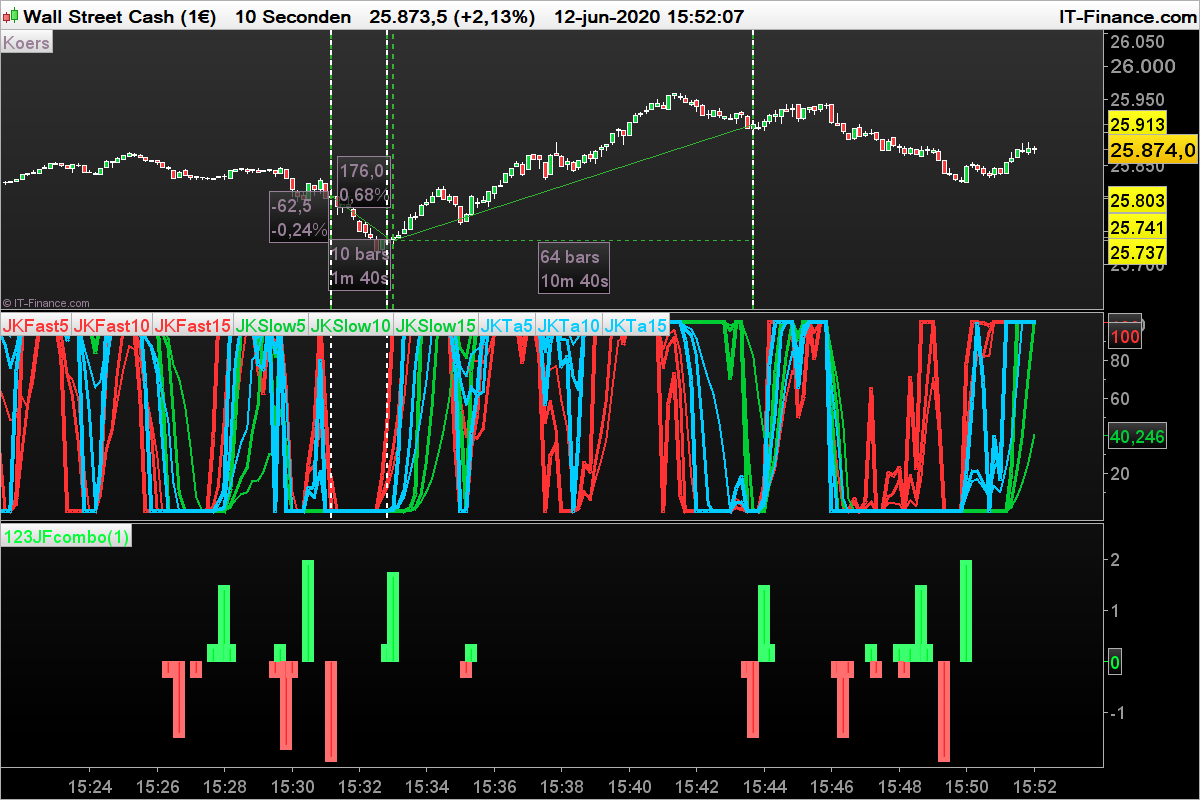
When all three lines in any version are flatlining (blended into one), it signals an impulsive, or motive, structure. See the blue lines in screen shot.
On the other hand, anytime you see the three lines separate, it’s a strong signal that the market is yielding a countertrend, or corrective pattern.
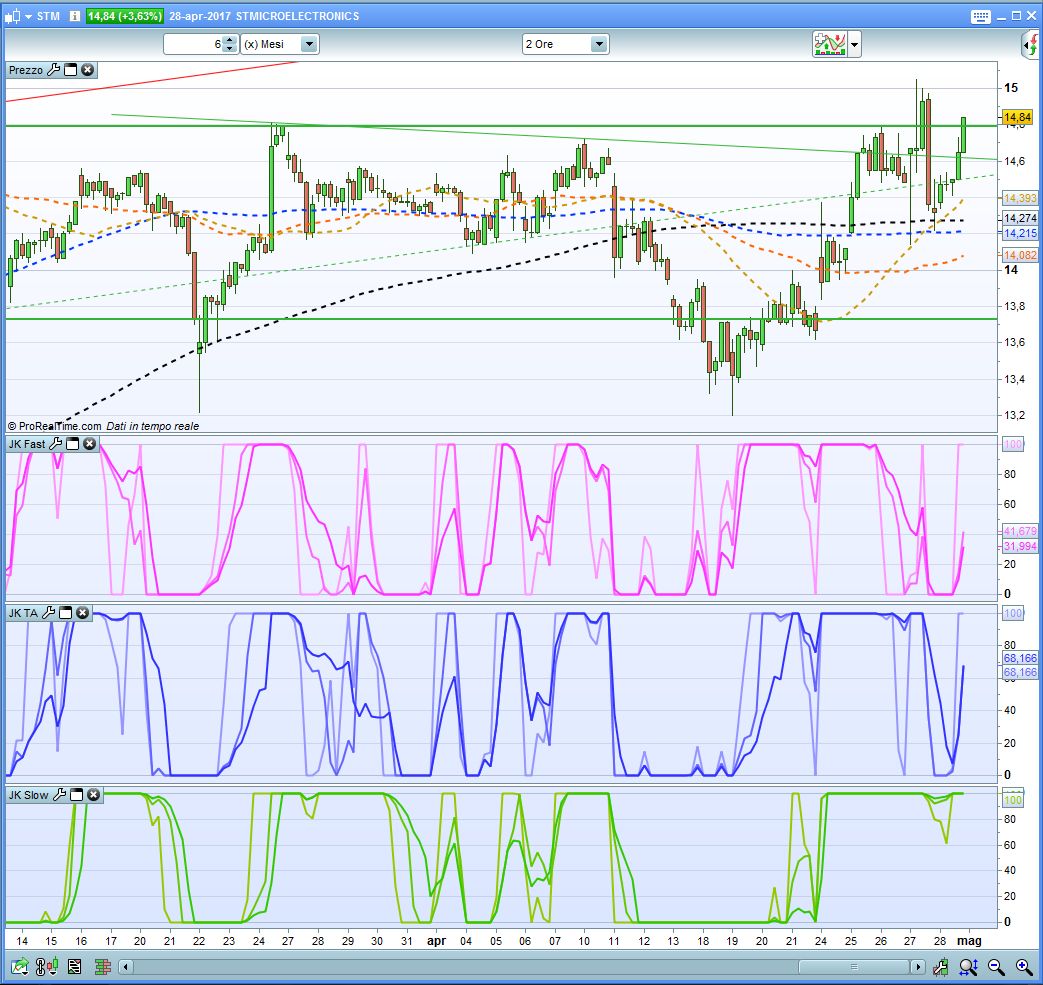
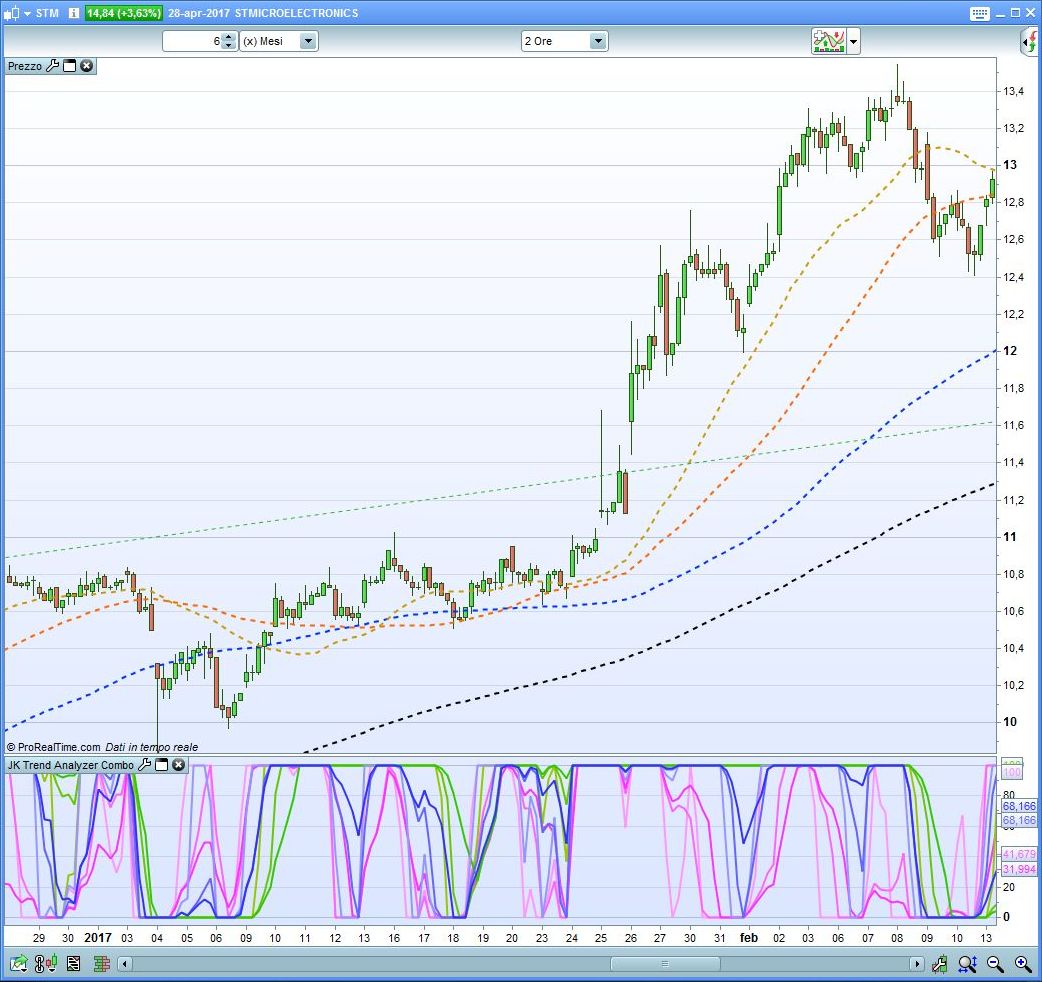
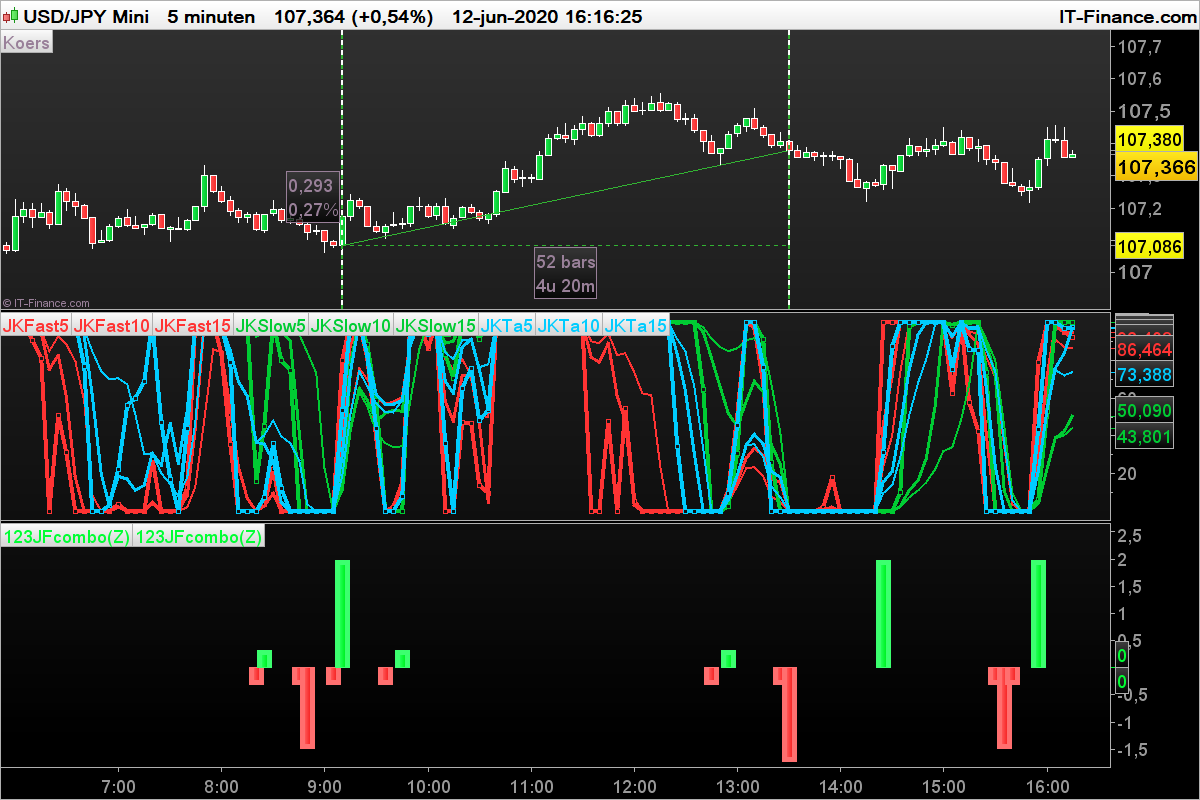
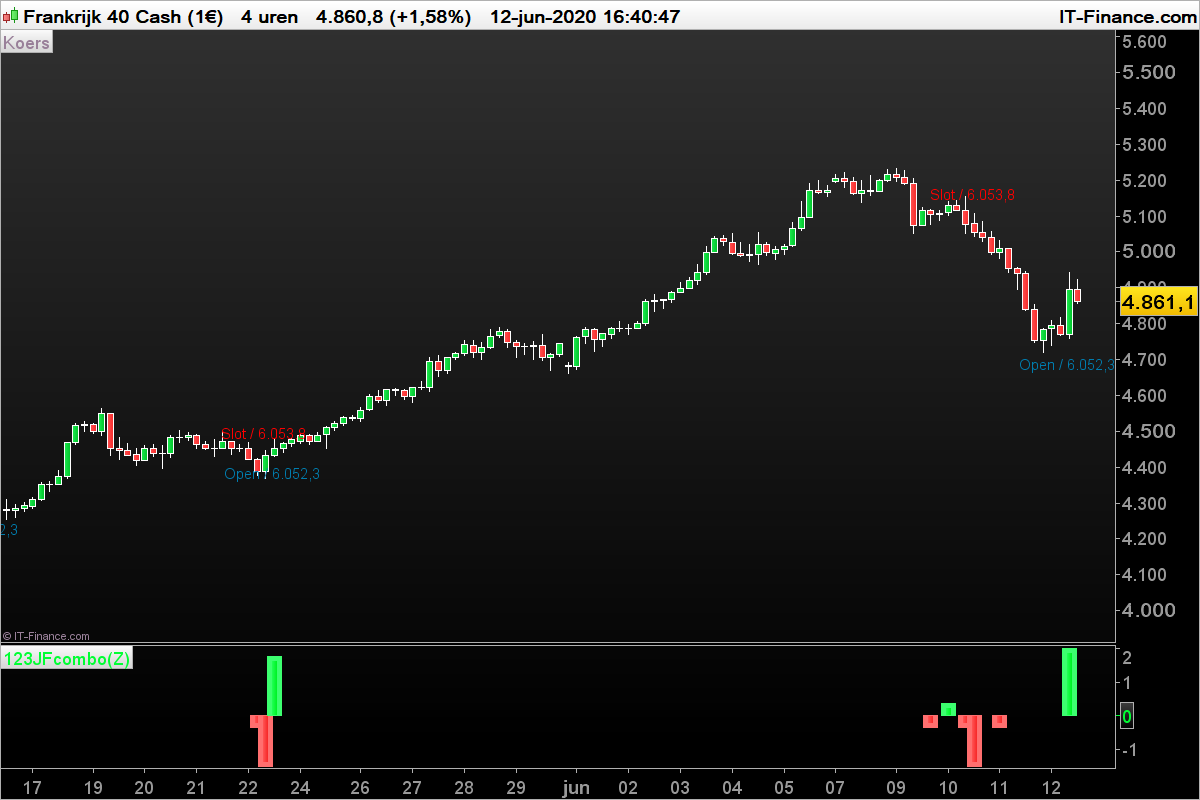
The JK_TA can be used on any instrument and on any time frame:
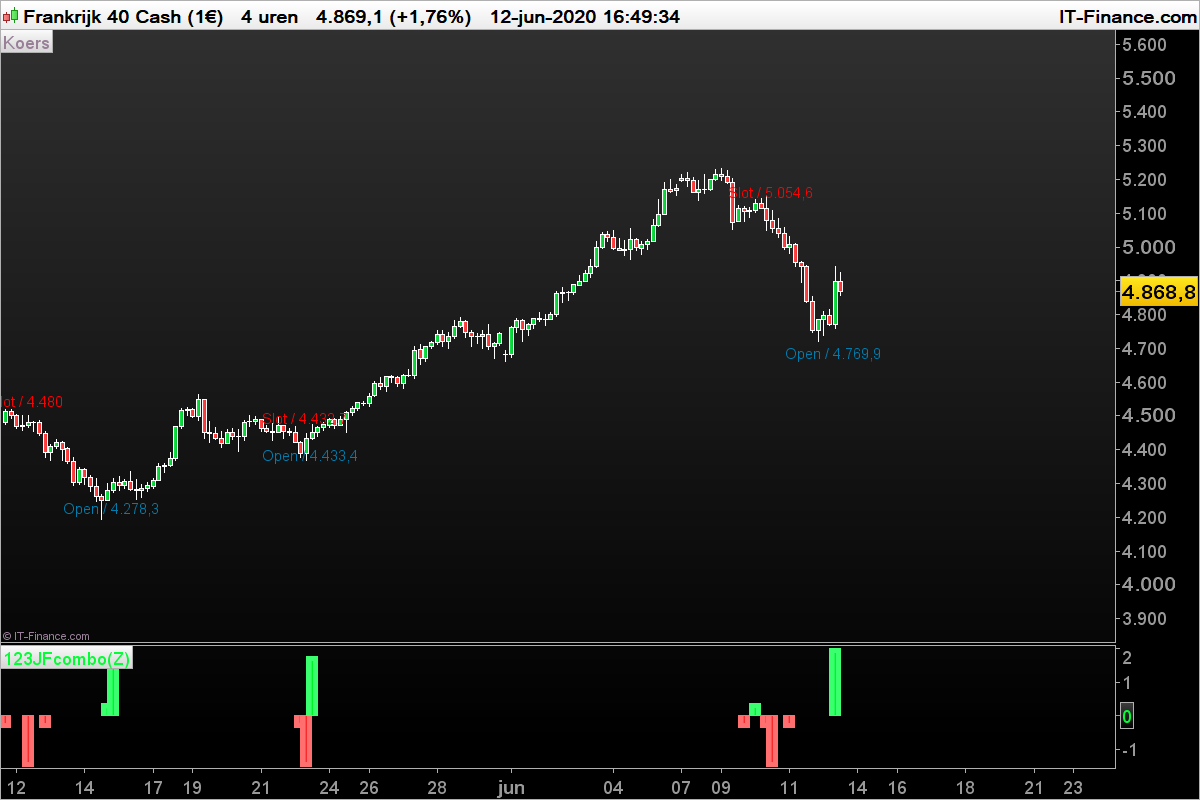
The first, second and third chart depict the basic indicator for different time frames. The fourth chart shows a custom variant of JK_TA: the Fast, Base and Slow lines packed together in one panel, selectable by the 5%R, 10%R or 15%R version of the three indicators.
Anyone needing help in counting waves can download the thinkscript studies from the comment section. While the default settings are 5 and 20, these may be adjusted to ones preferences.
Ready? Start counting!
The indicator is based on Williams%R, which is provided in the TOS studies set.
The default settings are three different Williams%R lines, each calculated for a
Fast: (20-period exponential moving average) substracted from (5-period exponential moving average)
Base: (5-period exponential moving average)
Slow: (20-period exponential moving average)
# Jeffrey Kennedy's Trend Analyzer Tool - JK_TA
# Original by Jeffrey Kennedy/Elliott Wave Internatial Inc.
# as presented on Tue, 22 December 2009 on www.elliottwave.com
#
# thinkscript by TrendXplorer
# website: www.trendxplorer.info
# e-mail: trendxplorer@gmail.com
# Revised: May 29, 2012

#hint:Jeffrey Kennedy's Trend Analyzer ToolnWhen all three lines in any version are flatlining as one, it signals an impulsive, or motive, structure.nAnytime the three lines separate, it's a strong signal that the market is yielding a countertrend, or corrective, pattern.

#hint setting: select Fast, Base or Slow version of the 5-period %R, 10-period %R and 15-period %R settings for the JFTA_5, JFTA_10 and JFTA_15 lines.

#
# --- script begin ----
#

declare lower;

input setting = {FAST, default BASE, SLOW};
input price = close;
input fastLength = 5;
input slowLength = 20;

def value;
def color;
switch (setting) {
case FAST:
 value = ExpAverage(close, fastLength) - ExpAverage(close, slowLength);
 color = 1;
case BASE:
 value = ExpAverage(close, fastLength);
 color = 2;
case SLOW:
 value = ExpAverage(close, slowLength);
 color = 3;
}

# Original Williams%R calculation by TD Ameritrade IP Company, Inc. (c) 2007-2012
def hv5 = Highest(value, 5);
def lv5 = Lowest(value, 5);
plot JKTA_5 = if hv5 == lv5 then 0 else ((hv5 - value) / (hv5 - lv5) * (-100) + 100);

def hv10 = Highest(value, 10);
def lv10 = Lowest(value, 10);
plot JKTA_10 = if hv10 == lv10 then 0 else ((hv10 - value) / (hv10 - lv10) * (-100) + 100);

def hv15 = Highest(value, 15);
def lv15 = Lowest(value, 15);
plot JKTA_15 = if hv15 == lv15 then 0 else ((hv15 - value) / (hv15 - lv15) * (-100) + 100);

JKTA_15.SetDefaultColor(GetColor(9));
JKTA_15.SetLineWeight(3);
JKTA_15.SetStyle(curve.firm);
JKTA_15.AssignValueColor(if color==1 then color.magenta else if color==2 then color.cyan else color.green);

JKTA_10.SetDefaultColor(GetColor(9));
JKTA_10.SetLineWeight(1);
JKTA_10.SetStyle(curve.firm);
JKTA_10.AssignValueColor(if color==1 then color.magenta else if color==2 then color.cyan else color.green);

JKTA_5.SetDefaultColor(GetColor(9));
JKTA_5.SetLineWeight(1);
JKTA_5.SetStyle(curve.short_dash);
JKTA_5.AssignValueColor(if color==1 then color.magenta else if color==2 then color.cyan else color.green);

plot line50 = 50;
plot line0 = 0;
plot line100 = 100;
line50.SetDefaultColor(GetColor(7));
line50.SetLineWeight(1);
line50.SetStyle(curve.firm);
line0.SetDefaultColor(GetColor(7));
line0.SetLineWeight(1);
line0.SetStyle(curve.short_dash);
line100.SetDefaultColor(GetColor(7));
line100.SetLineWeight(1);
line100.SetStyle(curve.short_dash);

#
# --- script end ----
#


**********************************************************

# Jeffrey Kennedy's Trend Analyzer Tool - JK_TA_Combo
# Original by Jeffrey Kennedy/Elliott Wave Internatial Inc.
# as presented on Tue, 22 December 2009 on www.elliottwave.com
#
# thinkscript by TrendXplorer
# website: www.trendxplorer.info
# e-mail: trendxplorer@gmail.com
# Revised: May 29, 2012

#hint:Jeffrey Kennedy's Trend Analyzer Tool Combined versionnWhen all three lines in any version are flatlining as one, it signals an impulsive, or motive, structure.nAnytime the three lines separate, it's a strong signal that the market is yielding a countertrend, or corrective, pattern.

#hint setting %R: select 5-period %R, 10-period %R or 15-period %R as settings for the JFTA_Slow, JFTA_Base and JFTA_Base lines.

#
# --- script begin ----
#

declare lower;

input price = close;
input setting_R = {"5", "10", default "15"};
input fastLength = 5;
input slowLength = 20;

def period;
switch (setting_R) {
case "5":
 period = 5;
case "10":
 period = 10;
case "15":
 period = 15;
}

def fast = ExpAverage(close, fastLength) - ExpAverage(close, slowLength);
def base = ExpAverage(close, fastLength);
def slow = ExpAverage(close, slowLength);

# Original Williams%R calculation by TD Ameritrade IP Company, Inc. (c) 2007-2012
def hs = Highest(slow, period);
def ls = Lowest(slow, period);
plot JKTA_Slow = if hs == ls then 0 else ((hs - slow) / (hs - ls) * (-100) + 100);
JKTA_Slow.SetDefaultColor(GetColor(6));
JKTA_Slow.SetLineWeight(2);
JKTA_Slow.SetStyle(curve.firm);

def hb = Highest(base, period);
def lb = Lowest(base, period);
plot JKTA_Base = if hb == lb then 0 else ((hb - base) / (hb - lb) * (-100) + 100);
JKTA_Base.SetDefaultColor(GetColor(1));
JKTA_Base.SetLineWeight(2);
JKTA_Base.SetStyle(curve.firm);

def hf = Highest(fast, period);
def lf = Lowest(fast, period);
plot JKTA_Fast = if hf == lf then 0 else ((hf - fast) / (hf - lf) * (-100) + 100);
JKTA_Fast.SetDefaultColor(GetColor(0));
JKTA_Fast.SetLineWeight(2);
JKTA_Fast.SetStyle(curve.firm);

plot line50 = 50;
plot line0 = 0;
plot line100 = 100;
line50.SetDefaultColor(GetColor(7));
line50.SetLineWeight(1);
line50.SetStyle(curve.firm);
line0.SetDefaultColor(GetColor(5));
line0.SetLineWeight(1);
line0.SetStyle(curve.short_dash);
line100.SetDefaultColor(GetColor(6));
line100.SetLineWeight(1);
line100.SetStyle(curve.short_dash);

#
# --- script end ----
#