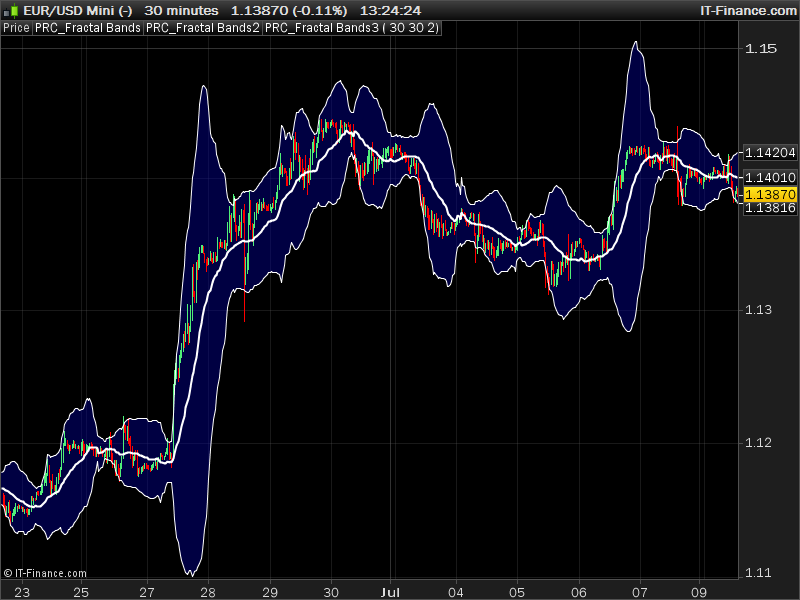
The Fractal Bands is a implementation of the Fractal Dimension into the Bollinger Bands. It’s purpose is to find potential mean reversion opportunities when price touch the upper or lower bands. The upper and lower bands are built open a FRASMA (Fractally Modified Simple Moving Average)
e_period (integer): This is the period considered for calculating the fractal dimension, default is 30.
normal_speed (integer): This is the speed of the SMA before being modified to become the FRASMA, default is 30.
alpha (real): This is the alpha from equation (2), default is 2.
Note from the author (Jean-Philippe Poton) about the use of the indicator:
The strategy is quite straightforward.
I enter in a BUY position after the price have rebounded (after touching it) from the lower band and crossed the FRASMA, my Stop Loss is then set to the level the prices hit the lower band, and my Take Profit is when the prices hit the higher band.
Symmetrically, I enter a SELL position after the price have fallen from the higher band (after touching it) and crossed the FRASMA, Stop Loss set at the level of the hit of the higher band, and Take Profit when the lower band is hit.
It is obviously possible (and even advised) to make your Stop Loss trailing the price changes.
I used this strategy for EUR/USD on a 5 minutes timeframe, using it on other timeframes or on other instruments may require a different setup, mine was to set the speed of the FRASMA at 30, and α=2 (in equation (2) above), it is possible to change these values.
Indicator translated from MT4 version by a request in the French forum.
|
1 2 3 4 5 6 7 8 9 10 11 12 13 14 15 16 17 18 19 20 21 22 23 24 25 26 27 28 29 30 31 32 33 34 35 36 37 38 39 40 41 42 43 44 45 46 47 48 49 50 51 52 53 54 55 56 57 58 59 60 61 62 |
//PRC_Fractal Bands | indicator //10.07.2017 //Nicolas @ www.prorealcode.com //Sharing ProRealTime knowledge //translated from MT4 code //---settings //eperiod =30 //normalspeed =30 //alpha =2.0 //---end of settings shift=0 etypedata =customclose gperiodminus1=eperiod - 1 log2=log(2.0) inputData=etypedata priceMax = highest[eperiod](inputData) priceMin = lowest[eperiod](inputData) length =0.0 priorDiff=0.0 for iteration=0 to gperiodminus1 do if((pricemax-pricemin)>0.0) then diff=(inputdata[iteration]-pricemin)/(pricemax-pricemin) if iteration>0 then result=square(diff-priordiff)+(1.0/square(eperiod)) length=length+(sqrt(result)) endif priordiff=diff endif next if (length>0.0) then fdi=1.0+(log(length)+log2)/log(2*gperiodminus1) else fdi=0.0 endif hurst=2-fdi // The Hurst exponent traildim=1/hurst // This is the trail dimension, the inverse of the Hurst-Holder exponent beta=traildim/2 speed=Round(normalspeed*beta) ExtOutputBuffer=average[speed](close)//iMA(NULL,0,speed,0,0,0,pos); // Buffer of the FRASMA sum=0.0 k=gperiodminus1 frasma=ExtOutputBuffer[shift] while(k>=0) do newres=Close[k]-frasma sum=sum+(newres*newres) k=k-1 wend deviation=2*Sqrt(sum/eperiod) // 2 standard deviations around the frasma UpperBuffer=frasma+deviation*exp(hurst*log(alpha)) LowerBuffer=frasma-deviation*exp(hurst*log(alpha)) return upperbuffer,lowerbuffer,ExtOutputBuffer style(line,2) |
Share this
No information on this site is investment advice or a solicitation to buy or sell any financial instrument. Past performance is not indicative of future results. Trading may expose you to risk of loss greater than your deposits and is only suitable for experienced investors who have sufficient financial means to bear such risk.
ProRealTime ITF files and other attachments :
Find other exclusive trading pro-tools on ![]()
PRC is also on YouTube, subscribe to our channel for exclusive content and tutorials


I like this
je me demande si prorealtime pourrait etre programee sur fonction lorsquún point cgange de clouleur independament de la valeur mis comme condition merci
can you provide this code for tradestation, please. Thanks
No sorry, please use this file instead into a prorealtime trading platform.
I just installed this indicator. It opens in its own pane rather than overlaid on the chart like the pic above. How do I get it on top of the chart?
Just apply it on your price chart instead and you’re ok.