







Edge Finder and Condition Tester
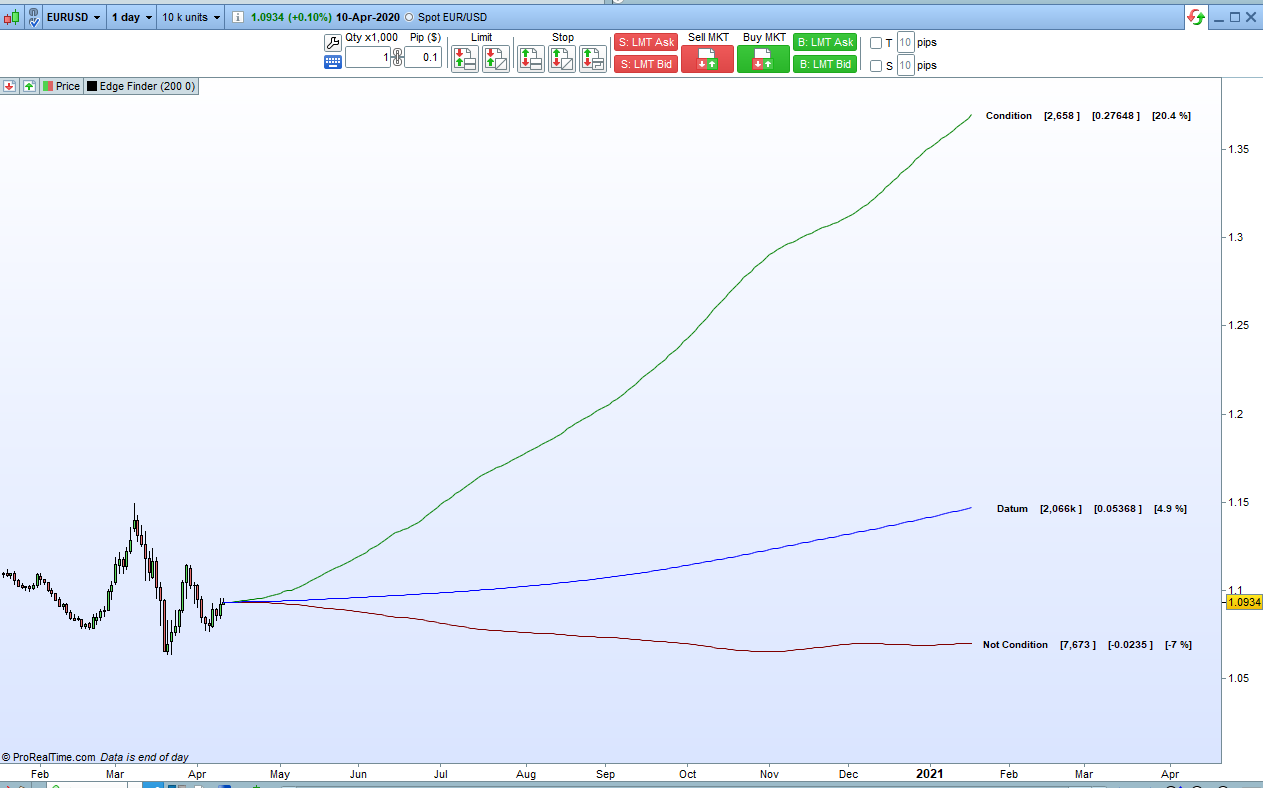
This indicator can help you find out what condition or set of conditions might give you an edge in any market. It can check through all of history and record what price did after any condition or any set of conditions occurred.
This indicator only works on PRTv11 onwards.
You set ‘projection’ to how many bars after an event you want to analyse.
You can change line 10 in the code to be any condition or set of conditions that you wish to analyse. So for example it could be something like any of the following:
- high > high[1]
- close > average[10]
- close > average[10] and high > high[1]
- stochastic[10,3] > stochastic[10,3][1] and low > low[1]
The options are endless.
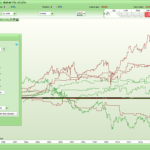
The indicator returns three lines drawn ‘projection’ bars into the future from the close of the last candle on the chart.
The blue line is our datum and is a line calculated from what happened after every bar on the chart. If this line curves upwards then we are trading a market that has a long tendency. If it curves down then it has a short tendency. If it is fairly level then the market might be considered to be more of a mean reversal market.
The green line shows what happened on average after a candle which met our condition/s occurred. If it is above the blue line then that is an edge. If it is below then it is a condition that gives a disadvantage.
The red line shows what happened on average after a candle which did not meet our condition/s occurred. If it is above the blue line then there is an edge to trading candles that do not meet our condition/s. If it is below then not meeting our condition gives a disadvantage.
The lines are labelled. The first number is the sample size or quantity of candles that either met our condition/s or did not meet our condition/s and for the datum line it is the total number of candles tested to get our datum.
The second number is the difference between the end of the projection line and the start of it. You can set a spread amount and this is then deducted off this result so you can see if the edge is big enough over ‘projection’ bars to actually overcome the spread.
The third number on the datum line is the percentage gain or loss compared to the start of the datum line. For the green condition met and red condition not met lines it is the difference of percentage to the datum line.
I advise downloading and importing to get full functionality.
//Edge Finder and Condition Tester
//PRTv11
//By Vonasi
//20200413

//projections = 100
//spread = 0

//Change this line to whatever condition or set of conditions you want to test
condition = stochastic[10,3] > stochastic[10,3][1] and close > average[10] and low > low[1]

if barindex > projection then
 if condition[projection] then
  condcount = condcount + 1
  for a = 1 to projection
   $cond[a] = $cond[a] + ((close[projection-a] - close[projection])/close[projection])
   $condcount[a] = $condcount[a]+1
   $condavg[a] = $cond[a]/$condcount[a]
  next
 endif

 if not condition[projection] then
  notcondcount = notcondcount + 1
  for a = 1 to projection
   $notcond[a] = $notcond[a] + ((close[projection-a] - close[projection])/close[projection])
   $notcondcount[a] = $notcondcount[a]+1
   $notcondavg[a] = $notcond[a]/$notcondcount[a]
  next
 endif

 for a = 1 to projection
  datumcount = datumcount + 1
  $datum[a] = $datum[a] + ((close[projection-a] - close[projection])/close[projection])
  $datumcount[a] = $datumcount[a]+1
  $datumavg[a] = $datum[a]/$datumcount[a]
 next
endif

if islastbarupdate then
 lasty = close
 lasty2 = close
 lasty3 = close
 for a = 1 to projection
  drawsegment(barindex+a-1,lasty,barindex+a,lasty+(close*$condavg[a]))coloured(0,128,0)
  drawsegment(barindex+a-1,lasty2,barindex+a,lasty2+(close*$notcondavg[a]))coloured(128,0,0)
  drawsegment(barindex+a-1,lasty3,barindex+a,lasty3+(close*$datumavg[a]))coloured(0,0,255)
  lasty = lasty+(close*$condavg[a])
  lasty2 = lasty2+(close*$notcondavg[a])
  lasty3 = lasty3+(close*$datumavg[a])
 next
 condresult = lasty-close-spread
 notcondresult = lasty2-close-spread
 datumresult = lasty3-close-spread
 condperc = round((condresult/close)*100,1)
 notcondperc = round((notcondresult/close)*100,1)
 datumperc = round((datumresult/close)*100,1)
 condperc = condperc-datumperc
 notcondperc = notcondperc-datumperc
 drawtext(" Condition    [#condcount#]    [#condresult#]    [#condperc#%]",barindex+a+30,lasty,sansserif,bold,10)
 drawtext("Not Condition    [#notcondcount#]    [#notcondresult#]    [#notcondperc#%]",barindex+a+30,lasty2,sansserif,bold,10)
 drawtext("   Datum    [#datumcount#]    [#datumresult#]    [#datumperc#%]",barindex+a+30,lasty3,sansserif,bold,10)
endif

return
Comments
You must be logged in to post a comment.

We already spoke about the fact that the indicator needs further development and bug fixing as it was created on PRT v11 pre tick by tick data. At the moment I am not coding because I threw a cup of tea over my keyboard and I am waiting for replacement to be delivered from UK to Greece (subject to Brexit created delays and costs). I am currently limited to using an old bluetooth keyboard that misses a lot of typing and is very annoying to use while I wait for the replacement to arrive. Please be patient!
I just made some time today to load up the correct FOMC conditions in PRT but I still get only a blue and horizontal green line for hourly or daily charts? Pls see Dropbox image (click "x" in the top right of the "create account" pop up. https://www.dropbox.com/s/tv56fa4bqszpygi/edge.png
Put it down to misinterpreting some Date and Time posts here on the forum (that always use, if or once) and not being a coder! What is the difference between defining a condition first with "if" or "once" and then referring to those conditions (i.e. FOMC dates) with Condition = OpenDate, -- because after all, isn't that the only times we're interested in defining and all other dates will return not true -- and the correct method of just using Condition = OpenDate and writing a long list of dates and times after it? Cheers,
I'm not sure that you understand how conditions work! Condition = opendate will always return true. Delete the IF THEN and replace everything with CONDITION = (OpenDate = 20200331 and time = 001800) or (OpenDate = 20200428 and Time = 001800) or (OpenDate = 20200609 and Time = 001800) or (OpenDate = 20200728 and Time = 001800) or (OpenDate = 20200827 and Time = 001800) or (OpenDate = 20200915 and Time = 001800) or (OpenDate = 20201104 and Time = 001800) or (OpenDate = 20201215 and Time = 001800) or (OpenDate = 20210127 and Time = 001800) or (OpenDate = 20210317 and Time = 001800)
Thanks @Vonasi. I've coded the Fed meeting dates condition below -- from last March 2020 to this March 2021 -- but I only get a blue datum line going up and a green line going out horizontal? Is what I'm testing feasible to get a 3 lined result? Cheers. If (OpenDate = 20200331 and time = 001800) or (OpenDate = 20200428 and Time = 001800) or (OpenDate = 20200609 and Time = 001800) or (OpenDate = 20200728 and Time = 001800) or (OpenDate = 20200827 and Time = 001800) or (OpenDate = 20200915 and Time = 001800) or (OpenDate = 20201104 and Time = 001800) or (OpenDate = 20201215 and Time = 001800) or (OpenDate = 20210127 and Time = 001800) or (OpenDate = 20210317 and Time = 001800) Then Condition = Opendate EndIf
Great, I look forward to the update as this is a very interesting and useful indicator. Btw, although I’m a technical trader the first Condition that actually sprang to mind was the impact of Federal Reserve meetings and interest rate decisions on the Dow and Cable. I tried the condition code for those specific interest rate decisions, (Jan 27th and March 17th’s etc) but it doesn’t produce all the three coloured lines — sometimes it produces just the red and blue lines but not the green line and other times no red line, just blue and green? I tried using: ONCE StartDate = 20200331 or 20200428 or 20200609 or 20200728 or 20200827 or 20200915 or 20201104 or 20201215 or 20210127 or 20210317 Condition = StartDate And I also tried: Once StartDate = 20200331 and Time = 18000 or StartDate = 20200428 and Time = 18000 or StartDate = 20200609 and Time = 18000 or StartDate = 20200728 and Time = 18000 or StartDate = 20200827 and Time = 18000 or StartDate = 20200915 and Time = 18000 or StartDate = 20201104 and Time = 18000 or StartDate = 20201215 and Time = 18000 or StartDate = 20210127 and Time = 18000 or StartDate = 20210317 and Time = 18000 Condition = StartDate ... but couldn't get it to work, so I'm wondering how to code these dates it to see the impact of how price changes after these meetings? Cheers.
I'm guessing that it is a similar issue to the one that I had on the distribution of returns indicators. I developed them when we only had PRT end of day accounts to use for developing codes on using the new array coding. Now it is updating the arrays tick by tick the code needs modifying to solve the issue. I'll try to find sometime to do it.
Nice job @Vonasi, I was wondering though why does the positive % gain keep increasing and increasing on the Datum? It's gone up 4% just in one minute and is still rising for the Daily £/Yen with Projection = 30 and Spread = 3.8? Condition set as: condition = stochastic[7,3] > stochastic[7,3][100] and close > average[100] and low > low[100] Cheers,


Hi Vonasi, I tried to understand the concept behind the 3 lines. "The indicator returns three lines drawn ‘projection’ bars into the future from the close of the last candle on the chart. The blue line is our datum and is a line calculated from what happened after every bar on the chart. If this line curves upwards then we are trading a market that has a long tendency. If it curves down then it has a short tendency. If it is fairly level then the market might be considered to be more of a mean reversal market. The green line shows what happened on average after a candle which met our condition/s occurred. If it is above the blue line then that is an edge. If it is below then it is a condition that gives a disadvantage. The red line shows what happened on average after a candle which did not meet our condition/s occurred. If it is above the blue line then there is an edge to trading candles that do not meet our condition/s. If it is below then not meeting our condition gives a disadvantage." Why have you developed this visual ? What is the conceptual difference with back testing the rule with the projection period ?
First of all it was a nice exercise in the use of arrays. If you back test your rule and say buy now and sell in x bars then while you are on the market you are missing all the other trade starting points that might also occur. With this indicator that does not happen. Every single candle that meets your conditions is analysed for what price did next and the lines are an average of all those price movements for every candle that your condition was met on. Also you get to compare it directly to all the candles that did not meet your condition and also against a market datum. All that is impossible to do in a strategy.

I guess it might be a nice addition so that you can check back in history and compare whether your condition has always given an edge. In fact that has given me an idea to possibly draw lines for lots of different sample periods to check the robustness of the edge! I'm a bit busy with other stuff right now but I'll keep it in mind.

HELLO Il faut enlever le "s" de projections dans le setting et çela fonctionne à merveille

Hi Vonassi, Your coding skills in PRT are amazing. Keep up the great contributions. I have a fairly simple request (it should be by your standard :)): How do I write a simple code that for example looks back at the last 100 bars and averages only positive values? For example I have an indicator that returns either a + value or - value for every bar. I want to lookback 100 bars and average only the + values (- values are skipped/ignored in average calculation) thank you and regards.


Any reason why this indicator would have stopped working. Tried to run it on v11 and v12 but does not draw any lines anymore.