Break-Out_FDXS_9-10_Uhr
Hi everyone,
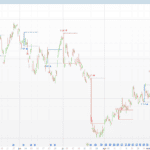
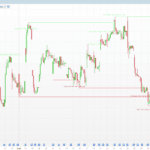
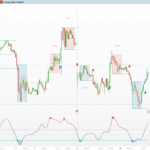
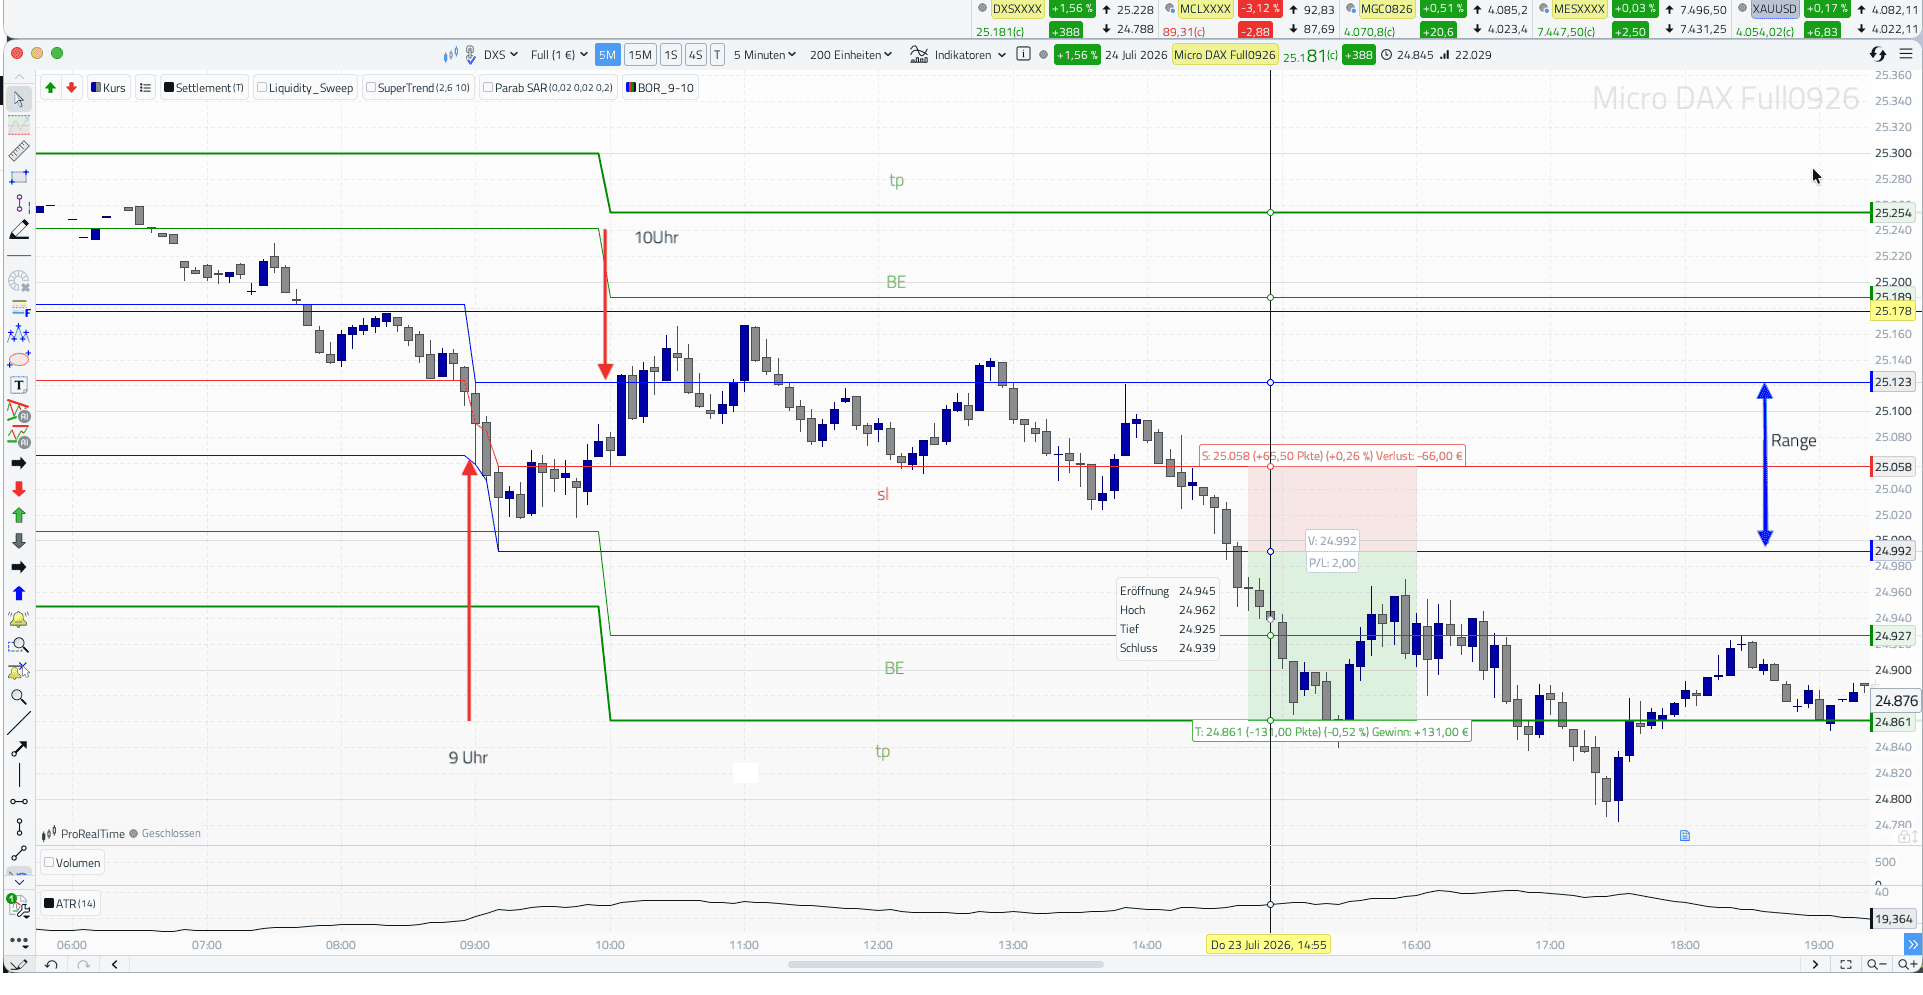
Here’s my breakout strategy for the FDXS on the M5 timeframe from 9 to 10 a.m.
Depending on how the chart breaks out of the range that formed between 9 and 10 a.m., I’ll go long or short the moment the chart breaks out of that range. The stop-loss (SL) is set at the midpoint of the range, and the take-profit (TP) is the entire range. This gives a risk-reward (CRV) ratio of 2:1. Once the trade has reached the stop-loss distance in “my” direction, I move the stop-loss to break-even (BE) > entry price. I look forward to your feedback and experiences.
Holger
——-
Hallo zusammen,
hier meine Break-Out-Open-Strategie für den FDXS auf M5 von 9-10 Uhr.
Je nach dem wie der Chart aus der Range die sich zwischen 9 und 10 Uhr gebildet hat, trade ich long oder short ab dem Moment an dem der Chart aus diesem Bereich ausbricht. Der sl liegt auf der Mitte der Range, der tp ist die Range. Damit CRV von 2:1. Hat der Trade die sl-Distanz in “meine” Richtung erreicht, ziehe ich auf BE > Einstandskurs. Freue mich auf euer Feedback, bzw. Erfahrungen.
Holger
// PRT Indikator: 09:00 - 10:00 Uhr Range mit Targets & Break-Even (M5)
// Bitte direkt im Preisfenster (über den Kerzen) anzeigen lassen

// 1. Um exakt 09:00 Uhr die Range-Ermittlung starten
IF OpenTime = 090000 THEN
HighRange = High
LowRange = Low
ENDIF

// 2. Zwischen 09:00 und 10:00 Uhr die Höchst- und Tiefstwerte live aktualisieren
IF OpenTime > 090000 AND OpenTime <= 095500 THEN
IF High > HighRange THEN
HighRange = High
ENDIF
IF Low < LowRange THEN
LowRange = Low
ENDIF
ENDIF

// 3. Liniensteuerung: Ab 09:00 Uhr live zeichnen und ab 10:00 Uhr einfrieren mit Targets
IF OpenTime >= 090000 THEN
PlotHigh = HighRange
PlotLow = LowRange
PlotMid = (HighRange + LowRange) / 2
RangePoints = HighRange - LowRange

// Die Targets und Break-Even-Linien schalten sich erst ab 10:00 Uhr dazu
IF OpenTime >= 100000 THEN
TargetLong = HighRange + RangePoints
TargetShort = LowRange - RangePoints

// Break-Even genau auf halber Strecke (0.5R) zum Target
BELong = HighRange + (RangePoints / 2)
BEShort = LowRange - (RangePoints / 2)
ELSE
TargetLong = Undefined
TargetShort = Undefined
BELong = Undefined
BEShort = Undefined
ENDIF
ELSE
// Vor 09:00 Uhr morgens (Nachtsitzung) wird im Chart ALLES ausgeblendet
PlotHigh = Undefined
PlotLow = Undefined
PlotMid = Undefined
TargetLong = Undefined
TargetShort = Undefined
BELong = Undefined
BEShort = Undefined
RangePoints = Undefined
ENDIF

// Standard-Ausgabe an den Chart
RETURN PlotHigh AS "9-10h High", PlotMid AS "9-10h Mitte", PlotLow AS "9-10h Low", TargetLong AS "Target LONG", TargetShort AS "Target SHORT", BELong AS "Break-Even LONG", BEShort AS "Break-Even SHORT", RangePoints AS "Live Rangegroesse (Punkte)"