




More from ProRealCode
ProRealCode - Trading & Coding with ProRealTime™



Z-Score Range Boxes Breakout
Introduction
A Z-Score tells you how far the close sits from its own mean, measured in standard deviations. Most indicators built on one stop there: two standard deviations down is oversold, so buy; two up is overbought, so sell. That is a bet that the stretch itself is the signal.
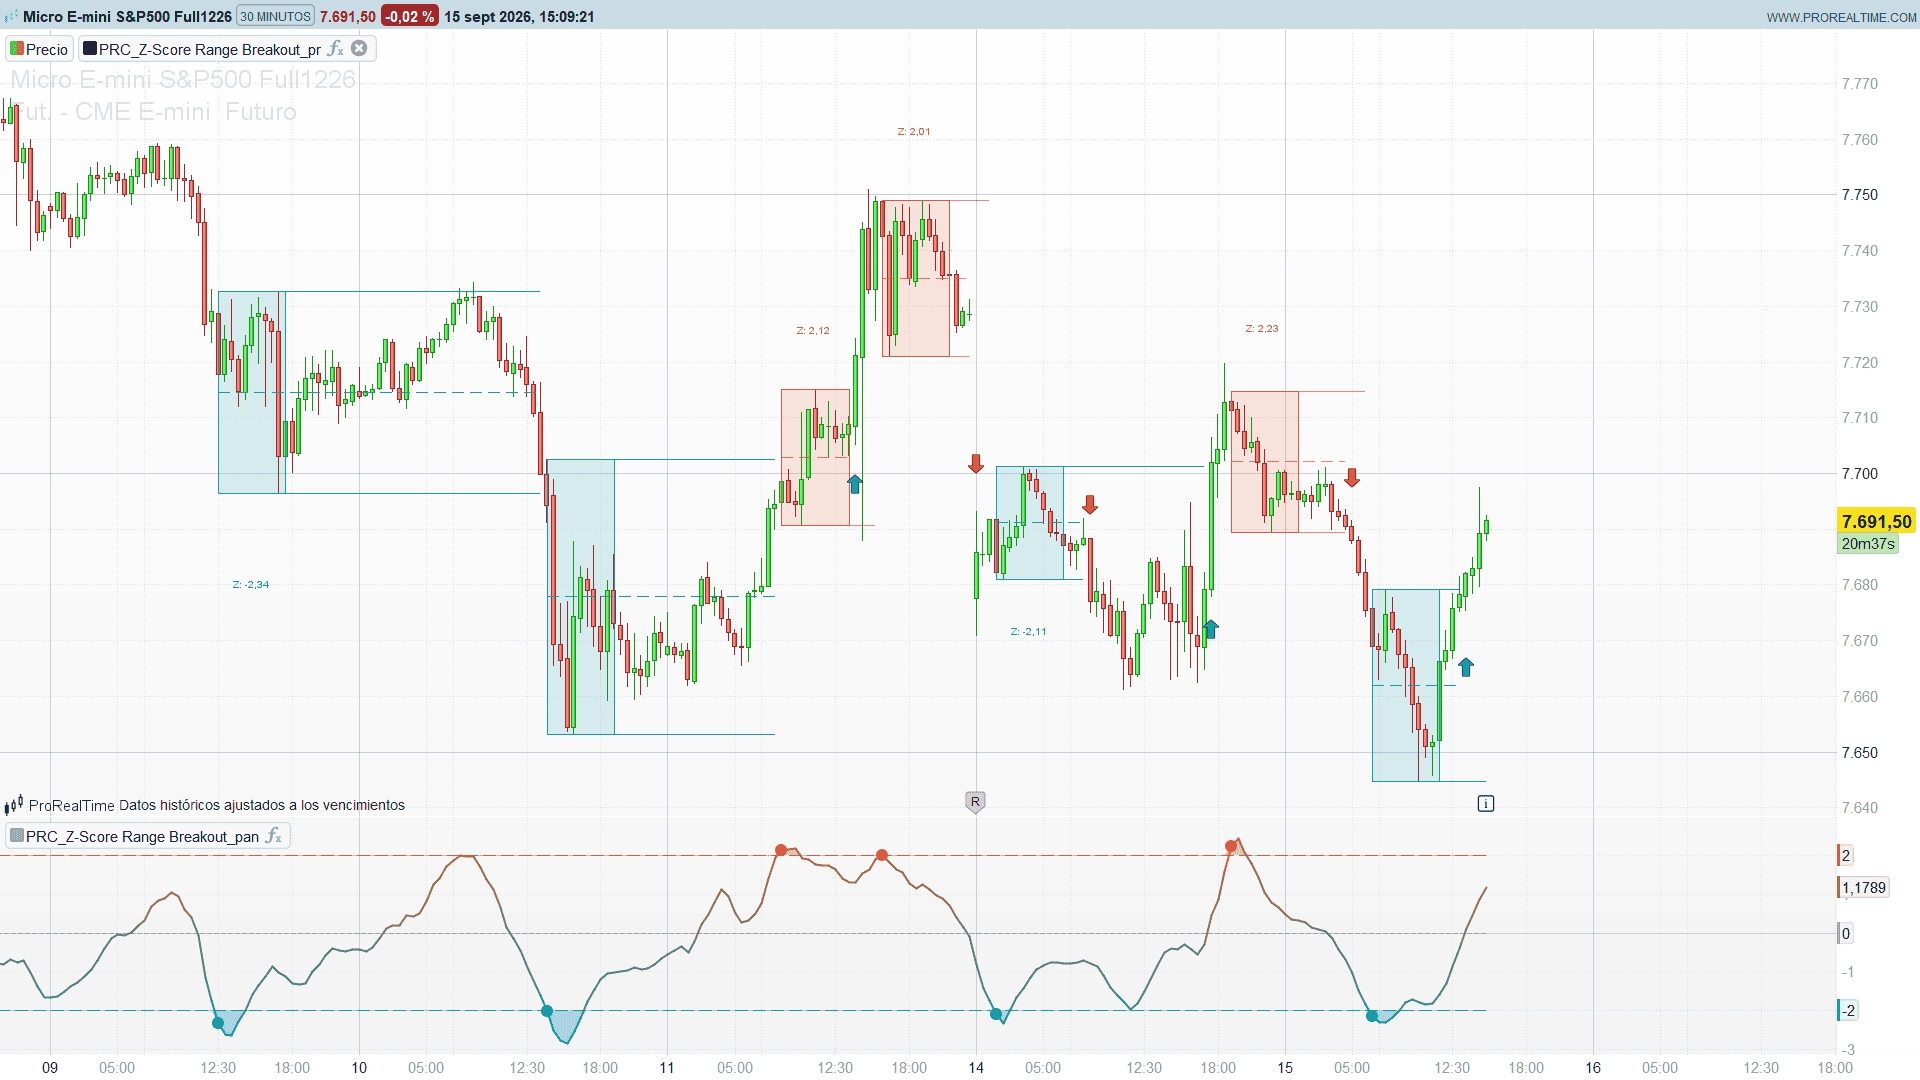
Z-Score Range Boxes Breakout does not take that bet. When the Z-Score crosses into an extreme, the indicator does not fire anything. It starts watching. It draws a box and, for the next ten bars, tracks the highest high and the lowest low the market produces while it is stretched. Then it freezes that box and waits.
The box is the answer to a more useful question than “is this extreme?”. It is the answer to “what did the market do about it?” — the range it built while it was supposedly unsustainable. A narrow box says the move stopped dead and coiled. A tall box says it kept running and never paused at all. Two very different things, and a plain oscillator reading of “-2.3” cannot tell them apart.
The signal comes afterwards. The top, the middle and the bottom of that frozen range are projected forward, and each one is cut the moment a close goes through it. That close is the breakout, and by then you already know which range it broke and how long that range held.
Theory Behind the Indicator
1. The Z-Score
Plain and deliberately so:
mean  = 20-bar simple moving average of the close
sd    = 20-bar standard deviation of the close
z     = (close - mean) / sd
line  = 5-bar simple moving average of z
The smoothing matters more than it looks. A raw Z-Score on the close is noisy enough that it clips a threshold and comes straight back on the next bar, which would arm a box on every bit of chop. Averaging five bars of it means a crossing has to be sustained to count.
2. The trigger, and which way it points
Read this one carefully, because the direction is the opposite of the reflex:
- The line crossing down through the oversold level arms a bullish box.
- The line crossing up through the overbought level arms a bearish box.
The box is armed on the way into the extreme, not on the way out. That is the whole design: the indicator wants to be watching before the market decides what to do about being stretched, not after.
3. The box
From the trigger bar onwards, for the configured number of bars, the box expands to hold every high and every low. The trigger bar itself is included. When the count is up the box stops growing and its top and bottom become fixed levels.
What you have then is a measured object rather than an opinion: the exact envelope of everything that happened while the Z-Score said the market was out of line.
4. The projections, and the one that refuses to die
Three levels are projected forward from the frozen box — the top, the midpoint, and the bottom. They grow one bar at a time and each one is cut the instant a close passes through it. An arrow marks the cut.
Here is the detail that separates this from every other range box:
- A close above the top kills the top and the middle. The bottom keeps growing.
- A close below the bottom kills the bottom and the middle. The top keeps growing.
So a range that breaks up and then fails and breaks down leaves both cuts on the chart, with two arrows and two lines of different lengths. The failed breakout is not erased by the one that followed; it stays visible as its own event. For anyone who trades continuation, that picture is the point.
5. One box at a time
While a box is still forming, any further crossing is ignored. No exceptions, no queue.
This is a bigger filter than it sounds. On a quiet setting it barely bites, because the line rarely re-crosses within ten bars. On tight levels with long boxes it throws away most of the crossings: on one test series, seventy boxes with the rule in place against eight without it. If the chart looks emptier than you expected, this is why, and it is deliberate — the indicator would rather show you one range it actually measured than ten it half-measured.
6. The reading on each box
Each box carries the Z-Score that armed it, printed just outside the box: below it for bullish setups, above it for bearish ones. A box armed at -2.1 and a box armed at -3.8 look identical otherwise, and they are not the same event.
Key Features at a Glance
- A range measured while the market is statistically stretched, not a level guessed from the extreme itself.
- Top, middle and bottom projected forward until price closes through each one.
- The opposite side of a broken range stays alive, so failed breakouts remain on the chart as their own event.
- The Z-Score that armed each box printed on the box.
- A gradient oscillator with shaded extreme zones in its own window, with a dot on the crossings that actually armed a box.
- Colours chosen to hold up on a light chart as well as a dark one.
How to Read the Indicator
A frozen box is a decision zone. Price inside it means the stretch has not resolved. The middle line is the honest tiebreaker: above it the range is being defended from the top, below it from the bottom.
An arrow is a close through a level, not a touch of it. That is a deliberately slower signal than a wick through, and it is what keeps the indicator from marking every probe of the range.
The length of a projection is information in itself. A line that runs for forty bars before being cut was a level the market respected for forty bars. A stub is one that folded immediately. The arrow alone does not tell you that; the line does.
Two arrows on the same box, one up and then one down, is a failed breakout. It is the most specific pattern this indicator produces and the reason the opposite side is kept alive.
Practical Applications
Continuation entries. An arrow through the top of a bullish box — a box armed by a move down into oversold — is the market rejecting the stretch. The bottom line that is still extending underneath is your invalidation, already drawn.
Failed-breakout fades. The two-arrow pattern marks a range that trapped both sides. Those are the ranges worth re-testing.
Volatility read. Box height against the Z-Score that armed it is a quick regime check. Tall boxes at modest readings mean the market is running, not reverting.
Context, not a system. The indicator marks structure and breaks; it does not size, stop or target. Test the crossing rule on your own instrument and timeframe before trading it.
Indicator Configuration
Two indicators are supplied, and they are meant to be loaded together. The first goes on the price chart and draws the boxes, the projections and the arrows. The second goes in its own window and plots the Z-Score itself. Both compute the Z-Score, so if you change zLen, smLen, osLev or obLev in one, change it in the other or the two windows will disagree.
Z-Score settings, present in both:
zLen(20) — bars for the mean and the standard deviation. Higher is slower and produces fewer, bigger readings.smLen(5) — smoothing of the Z-Score. Raising it cuts marginal crossings; lowering it arms boxes on noise.osLev(-2.0) andobLev(2.0) — the trigger levels. Values of 3 or 4 make the indicator much rarer and much more selective.
Range box:
boxBars(10) — bars the box tracks before freezing. This is the parameter that changes the character of the tool. Short boxes measure the immediate reaction; long boxes measure the whole digestion and, combined with tight levels, run into the one-box-at-a-time rule.
Display, price chart:
showZ(1) — print the Z-Score that armed each box.maxRng(40) andmaxMk(60) — how many completed ranges and arrows stay on the chart. Raise them for a longer history at the cost of a heavier redraw.
Display, panel:
showArm(1) — dot on the crossings that armed a box.gradLo(-3.0) andgradHi(3.0) — the readings at which the gradient reaches each end colour.
A Note on Warm-Up
The mean and the standard deviation need zLen bars, and the smoothing needs smLen more on top of them, because the two run in series. With the defaults nothing is calculated for the first 27 bars, not the first 20. Below that the indicator deliberately holds a clean zero rather than feeding an undefined standard deviation into the smoothing average, which would leave the line blank for the whole chart.
Code
Part 1, on the price chart:
//---------------------------------------------------------------------------//
//PRC_Z-Score Range Boxes Breakout
//version = 0
//15.09.2026
//Ivan Gonzalez @ www.prorealcode.com
//Author: BigBeluga
//Sharing ProRealTime knowledge
//---------------------------------------------------------------------------//
//PART 1 of 2 - THE PRICE CHART. Apply this one ON the price.
//The companion panel indicator, PRC_Z-Score Range Boxes Breakout (panel),
//plots the Z-Score itself in its own window.
//---------------------------------------------------------------------------//
//A Z-Score of the closing price crossing down through the oversold level, or
//up through the overbought level, arms a box. The box then tracks the highest
//high and the lowest low of the next boxBars bars and freezes there: that is
//the range the market built while the move was statistically stretched. The
//top, the middle and the bottom of that range are projected forward and each
//one is cut the moment price closes through it, which is the breakout the
//indicator is named after. Only one box is ever building at a time, so a
//crossing that arrives while a box is still forming is ignored.
//---------------------------------------------------------------------------//
DEFPARAM drawonlastbaronly = true

//-----Z-Score---------------------------------------------------------------//
zLen    = 20      //Bars used for the mean and the standard deviation
smLen   = 5       //Smoothing applied to the raw Z-Score
osLev   = -2.0    //Oversold level: crossing DOWN through it arms a box
obLev   = 2.0     //Overbought level: crossing UP through it arms a box

//-----Range box-------------------------------------------------------------//
boxBars = 10      //Bars the box tracks before the range is frozen

//-----Display---------------------------------------------------------------//
showZ   = 1       //1 = print the Z-Score that armed each box
maxRng  = 40      //Completed ranges kept on the chart
maxMk   = 60      //Breakout arrows kept on the chart

//-----Colours---------------------------------------------------------------//
bullR = 0
bullG = 150
bullB = 160
bearR = 220
bearG = 90
bearB = 40

//---------------------------------------------------------------------------//
//                              STATE AND SEEDS                              //
//---------------------------------------------------------------------------//

rgRing  = maxRng + 1
mkRing  = maxMk + 1

minBars = zLen + smLen + 2

IF barindex = 0 THEN
   nRng    = 0
   nMk     = 0
   boxAct  = 0
   boxStart = 0
   boxTop  = high
   boxBot  = low
   boxZ    = 0
   curH    = 0
   rngTop  = 0
   rngBot  = 0
   topLive = 0
   botLive = 0
   setOn   = 0
   topOn   = 0
   midOn   = 0
   botOn   = 0
   elapsed = 0
ENDIF

//---------------------------------------------------------------------------//
//                                 Z-SCORE                                   //
//---------------------------------------------------------------------------//

zSrc  = close
sdVal = std[zLen](zSrc)
meanV = average[zLen](zSrc)
IF sdVal > 0 THEN
   zRaw = (zSrc - meanV) / sdVal
ELSE
   zRaw = 0
ENDIF
zSm = average[smLen](zRaw)

//---------------------------------------------------------------------------//
//                                  ENGINE                                   //
//---------------------------------------------------------------------------//
//-----Triggers--------------------------------------------------------------//

trigOs = 0
trigOb = 0
IF barindex > minBars AND boxAct = 0 THEN
   IF zSm < osLev AND zSm[1] >= osLev THEN
      trigOs = 1
   ENDIF
   IF zSm > obLev AND zSm[1] <= obLev THEN
      trigOb = 1
   ENDIF
ENDIF

IF trigOs = 1 OR trigOb = 1 THEN

   IF setOn = 1 THEN
      curB = (nRng - 1) MOD rgRing
      IF topOn = 1 THEN
         $rgXT[curB] = barindex - 1
      ENDIF
      IF midOn = 1 THEN
         $rgXM[curB] = barindex - 1
      ENDIF
      IF botOn = 1 THEN
         $rgXB[curB] = barindex - 1
      ENDIF
   ENDIF
   setOn    = 0
   topOn    = 0
   midOn    = 0
   botOn    = 0
   topLive  = 0
   botLive  = 0
   boxStart = barindex
   boxTop   = high
   boxBot   = low
   boxZ     = round(zSm * 100) / 100
   IF trigOs = 1 THEN
      boxAct = 1
   ELSE
      boxAct = 2
   ENDIF
ENDIF

//-----The box that is building----------------------------------------------//

IF boxAct > 0 THEN
   elapsed = barindex - boxStart
   IF elapsed <= boxBars THEN
      boxTop = max(boxTop, high)
      boxBot = min(boxBot, low)
      IF elapsed = boxBars THEN
         fTop = boxTop
         fBot = boxBot
         fMid = (fTop + fBot) / 2
         curH = fTop - fBot
         rngTop  = fTop
         rngBot  = fBot
         topLive = 1
         botLive = 1
         slR = nRng MOD rgRing
         $rgL[slR]  = boxStart
         $rgR[slR]  = boxStart + boxBars
         $rgT[slR]  = fTop
         $rgB[slR]  = fBot
         $rgM[slR]  = fMid
         $rgD[slR]  = boxAct
         $rgZ[slR]  = boxZ

         $rgXT[slR] = barindex
         $rgXM[slR] = barindex
         $rgXB[slR] = barindex
         nRng  = nRng + 1
         setOn = 1
         topOn = 1
         midOn = 1
         botOn = 1
      ENDIF
   ELSE
      boxAct = 0
   ENDIF
ENDIF

//-----Breakouts-------------------------------------------------------------//

brkUp = 0
brkDn = 0
IF topLive = 1 AND topLive[1] = 1 AND close > rngTop AND close[1] <= rngTop THEN
   brkUp = 1
ENDIF
IF botLive = 1 AND botLive[1] = 1 AND close < rngBot AND close[1] >= rngBot THEN
   brkDn = 1
ENDIF

IF brkUp = 1 THEN

   curB = (nRng - 1) MOD rgRing
   IF topOn = 1 THEN
      $rgXT[curB] = barindex - 1
   ENDIF
   IF midOn = 1 THEN
      $rgXM[curB] = barindex - 1
   ENDIF
   topLive = 0
   topOn   = 0
   midOn   = 0
   slM = nMk MOD mkRing
   $mkX[slM] = barindex

   $mkY[slM] = low - curH * 0.3
   $mkD[slM] = 1
   nMk = nMk + 1
ENDIF

IF brkDn = 1 THEN
   curB = (nRng - 1) MOD rgRing
   IF botOn = 1 THEN
      $rgXB[curB] = barindex - 1
   ENDIF
   IF midOn = 1 THEN
      $rgXM[curB] = barindex - 1
   ENDIF
   botLive = 0
   botOn   = 0
   midOn   = 0
   slM = nMk MOD mkRing
   $mkX[slM] = barindex
   $mkY[slM] = high + curH * 0.3
   $mkD[slM] = 2
   nMk = nMk + 1
ENDIF

//-----Stretching the live projections---------------------------------------//

IF setOn = 1 THEN
   curB = (nRng - 1) MOD rgRing
   IF topOn = 1 THEN
      $rgXT[curB] = barindex
      IF midOn = 1 THEN
         $rgXM[curB] = barindex
      ENDIF
   ENDIF
   IF botOn = 1 THEN
      $rgXB[curB] = barindex
   ENDIF
ENDIF

//---------------------------------------------------------------------------//
//                                 DRAWING                                   //
//---------------------------------------------------------------------------//
IF islastbarupdate THEN

   //-----Frozen ranges: the box and its three projections-------------------//
   nR = min(nRng, maxRng)
   IF nR > 0 THEN
      stRg = (nRng - nR) MOD rgRing
      FOR q = 0 TO nR - 1 DO
         slR = (stRg + q) MOD rgRing
         IF $rgD[slR] = 1 THEN
            cR = bullR
            cG = bullG
            cB = bullB
         ELSE
            cR = bearR
            cG = bearG
            cB = bearB
         ENDIF
         DRAWRECTANGLE($rgL[slR], $rgT[slR], $rgR[slR], $rgB[slR]) COLOURED(cR, cG, cB, 255) FILLCOLOR(cR, cG, cB, 38)
         DRAWSEGMENT($rgL[slR], $rgT[slR], $rgXT[slR], $rgT[slR]) COLOURED(cR, cG, cB, 204) STYLE(line, 1)
         DRAWSEGMENT($rgL[slR], $rgM[slR], $rgXM[slR], $rgM[slR]) COLOURED(cR, cG, cB, 204) STYLE(dottedline2, 1)
         DRAWSEGMENT($rgL[slR], $rgB[slR], $rgXB[slR], $rgB[slR]) COLOURED(cR, cG, cB, 204) STYLE(line, 1)
         IF showZ = 1 THEN

            zTxt = $rgZ[slR]
            rgH  = $rgT[slR] - $rgB[slR]
            xTxt = round(($rgL[slR] + $rgR[slR]) / 2)
            IF $rgD[slR] = 1 THEN
               yTxt = $rgB[slR] - rgH * 0.45
            ELSE
               yTxt = $rgT[slR] + rgH * 0.45
            ENDIF
            DRAWTEXT("Z: #zTxt#", xTxt, yTxt, SansSerif, Standard, 10) COLOURED(cR, cG, cB, 255)
         ENDIF
      NEXT
   ENDIF

   //-----Breakout arrows----------------------------------------------------//
   nM = min(nMk, maxMk)
   IF nM > 0 THEN
      stMk = (nMk - nM) MOD mkRing
      FOR q = 0 TO nM - 1 DO
         slM = (stMk + q) MOD mkRing
         IF $mkD[slM] = 1 THEN
            DRAWARROWUP($mkX[slM], $mkY[slM]) COLOURED(bullR, bullG, bullB, 255)
         ELSE
            DRAWARROWDOWN($mkX[slM], $mkY[slM]) COLOURED(bearR, bearG, bearB, 255)
         ENDIF
      NEXT
   ENDIF

   //-----The box that has not finished forming------------------------------//

   IF boxAct > 0 THEN
      IF boxAct = 1 THEN
         dR = bullR
         dG = bullG
         dB = bullB
      ELSE
         dR = bearR
         dG = bearG
         dB = bearB
      ENDIF
      DRAWRECTANGLE(boxStart, boxTop, boxStart + boxBars, boxBot) COLOURED(dR, dG, dB, 255) FILLCOLOR(dR, dG, dB, 38)
      IF showZ = 1 THEN
         dzTxt = boxZ
         dH    = boxTop - boxBot
         dxTxt = round(boxStart + boxBars / 2)
         IF boxAct = 1 THEN
            dyTxt = boxBot - dH * 0.45
         ELSE
            dyTxt = boxTop + dH * 0.45
         ENDIF
         DRAWTEXT("Z: #dzTxt#", dxTxt, dyTxt, SansSerif, Standard, 10) COLOURED(dR, dG, dB, 255)
      ENDIF
   ENDIF

ENDIF

RETURN
Part 2, in its own window:
//---------------------------------------------------------------------------//
//PRC_Z-Score Range Boxes Breakout (panel)
//version = 0
//15.09.2026
//Ivan Gonzalez @ www.prorealcode.com
//Author: BigBeluga
//Sharing ProRealTime knowledge
//---------------------------------------------------------------------------//
//PART 2 of 2 - THE OSCILLATOR. Apply this one in its OWN window.
//The companion indicator, PRC_Z-Score Range Boxes Breakout, draws the range
//boxes and the breakouts on the price chart.
//---------------------------------------------------------------------------//
//How many standard deviations the close sits away from its own moving average,
//smoothed. The line runs through a continuous gradient from the oversold
//colour to the overbought colour, and the area between the line and a trigger
//level is shaded whenever the line is beyond it.
//The dots mark the crossings that actually ARM a box on the price chart, which
//is not every crossing: while a box is still forming the next one is ignored.
//---------------------------------------------------------------------------//

//-----Z-Score---------------------------------------------------------------//
zLen   = 20      //Bars used for the mean and the standard deviation
smLen  = 5       //Smoothing applied to the raw Z-Score
osLev  = -2.0    //Oversold level: crossing DOWN through it arms a box
obLev  = 2.0     //Overbought level: crossing UP through it arms a box
boxBars = 10     //Bars a box takes to form. Only used to gate the dots

//-----Display---------------------------------------------------------------//
showArm = 1      //1 = dot on the crossings that arm a box
gradLo  = -3.0   //Z-Score the gradient reaches its oversold colour at
gradHi  = 3.0    //Z-Score the gradient reaches its overbought colour at

//-----Colours---------------------------------------------------------------//

bullR = 0
bullG = 150
bullB = 160
bearR = 220
bearG = 90
bearB = 40

//---------------------------------------------------------------------------//
//                                 Z-SCORE                                   //
//---------------------------------------------------------------------------//

minBars = zLen + smLen + 2

zSrc  = close
sdVal = std[zLen](zSrc)
meanV = average[zLen](zSrc)
IF sdVal > 0 THEN
   zRaw = (zSrc - meanV) / sdVal
ELSE
   zRaw = 0
ENDIF
zSm = average[smLen](zRaw)

IF barindex > minBars THEN
   zOut = zSm
   zCol = zSm
ELSE
   zOut = undefined
   zCol = 0
ENDIF

//---------------------------------------------------------------------------//
//                                 GRADIENT                                  //
//---------------------------------------------------------------------------//

mixT = (zCol - gradLo) / (gradHi - gradLo)
mixT = max(0, min(1, mixT))
mixR = round(bullR + (bearR - bullR) * mixT)
mixG = round(bullG + (bearG - bullG) * mixT)
mixB = round(bullB + (bearB - bullB) * mixT)

//---------------------------------------------------------------------------//
//                          LEVELS AND SHADED AREAS                          //
//---------------------------------------------------------------------------//
obLine = obLev
osLine = osLev

zeroLn = 0.0

IF barindex > minBars AND zSm > obLev THEN
   fillOb = zSm
ELSE
   fillOb = obLev
ENDIF
IF barindex > minBars AND zSm < osLev THEN
   fillOs = zSm
ELSE
   fillOs = osLev
ENDIF
COLORBETWEEN(fillOb, obLine, bearR, bearG, bearB, 76)
COLORBETWEEN(fillOs, osLine, bullR, bullG, bullB, 76)

//---------------------------------------------------------------------------//
//                        WHICH CROSSINGS ARM A BOX                          //
//---------------------------------------------------------------------------//

IF barindex = 0 THEN
   boxAct   = 0
   boxStart = 0
ENDIF

armOs = 0
armOb = 0
IF barindex > minBars AND boxAct = 0 THEN
   IF zSm < osLev AND zSm[1] >= osLev THEN
      armOs = 1
   ENDIF
   IF zSm > obLev AND zSm[1] <= obLev THEN
      armOb = 1
   ENDIF
ENDIF

IF armOs = 1 THEN
   boxAct   = 1
   boxStart = barindex
ENDIF
IF armOb = 1 THEN
   boxAct   = 2
   boxStart = barindex
ENDIF
IF boxAct > 0 AND barindex - boxStart > boxBars THEN
   boxAct = 0
ENDIF

IF showArm = 1 THEN
   IF armOs = 1 THEN
      DRAWPOINT(barindex, zSm, 3) COLOURED(bullR, bullG, bullB, 255)
   ENDIF
   IF armOb = 1 THEN
      DRAWPOINT(barindex, zSm, 3) COLOURED(bearR, bearG, bearB, 255)
   ENDIF
ENDIF

RETURN zOut COLOURED(mixR, mixG, mixB) STYLE(line, 2) AS "Smoothed Z-Score", zeroLn COLOURED(140, 140, 140, 180) STYLE(dottedline, 1) AS "Zero", obLine COLOURED(bearR, bearG, bearB, 255) STYLE(dottedline2, 1) AS "Overbought", osLine COLOURED(bullR, bullG, bullB, 255) STYLE(dottedline2, 1) AS "Oversold"
Conclusion
Most Z-Score tools answer “is the market stretched?”. This one answers the question that follows it: the market was stretched, and here is exactly the range it built while it was, here is the level it eventually closed through, and here is how long it held before it did. The range is measured rather than assumed, the failed breakout survives the successful one, and both are on the chart where you can see them.