Hi to all,
I’m reading chapter 14 of John Carter’s “Mastering The Trade” (2nd edition), which describes a setup to open position after trend has changed and a three candle pattern has been formed.
For example, to go short following new trend when old trend was bullish, Carter says that you have to check for three consecutive lower closes, that means that reversal has been confirmed and trader has to go short at market.
At the same way, reversed rules are valid for bullish signal: after a reversal from a bearish to bullish, you have to check for three consecutive higher closes.
Carter adds a filter to avoid “Flags” (consolidation situations): in case of three lower closes, the close of the last two candles must be lower than the low of the first candle of the pattern; at the same way for bullish, the close of the last two candles must be higher than the high of the first candle of the pattern.
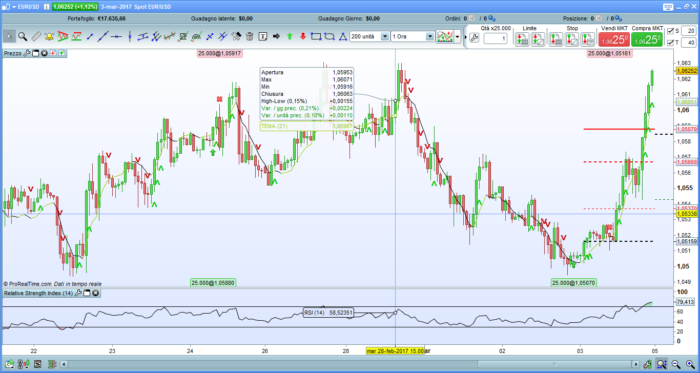
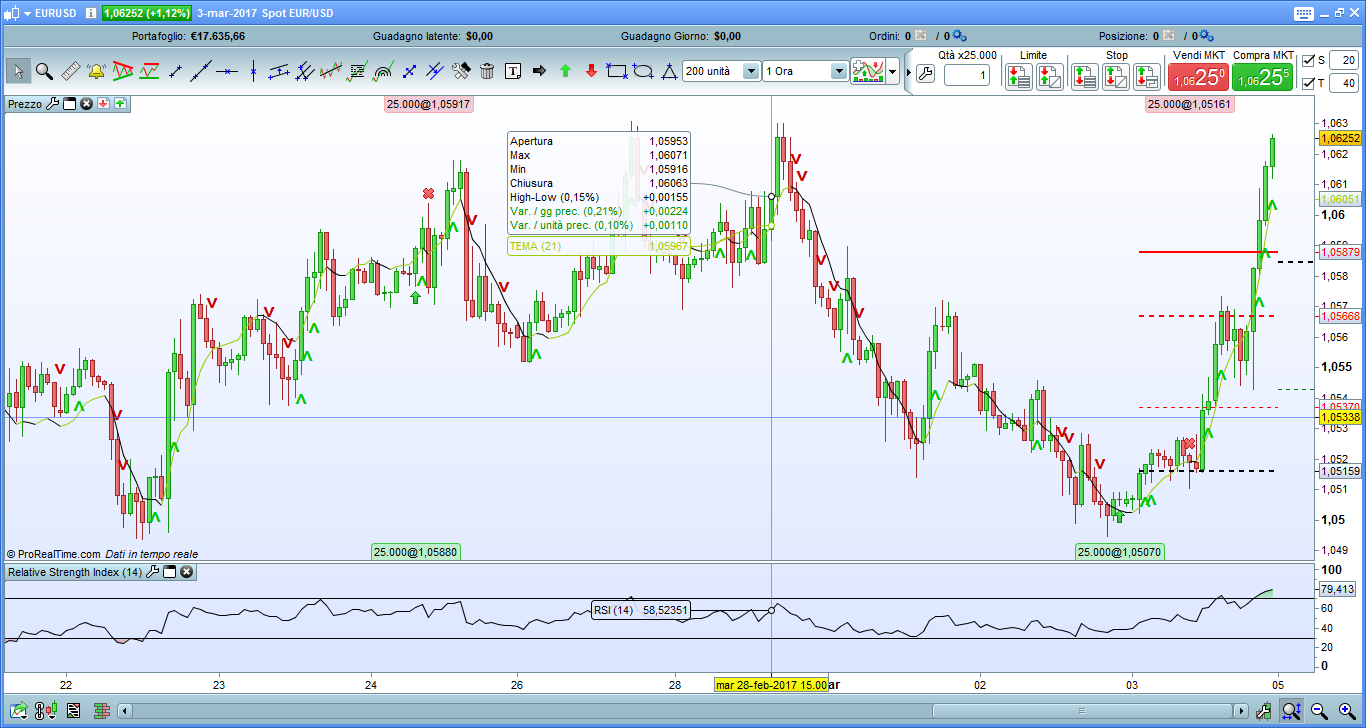
Using that rules, I tried to write an indicator that paint green (for bullish) an red (for bearish) arrows on the chart.
Note that when the first arrow is painted after a market reversal, You are on the market so You must ignore the following candles having the same color.
The original John Carter’s indicator for Trade Station put the signal to the first candle of the pattern. My indicator put the arrow to the third candle of the pattern, that is the entry candle.
Here’s the code:
|
1 2 3 4 5 6 7 8 9 10 11 12 13 14 15 16 17 18 19 20 21 22 23 24 25 26 |
//Author: Francesco //Date: 05-03-2017 ATR = averagetruerange //Three Bars Lower Closes BearCondition = Close < Close[1] And Close[1] < Close[2] And (Close < Low[2] And Close[1] <Low[2]) //Three Bars Higher Closes BullCondition = Close > Close[1] And Close[1] > Close[2] And (Close > High[2] And Close[1] > High[2]) //Go Short Signal If BearCondition then TOPy = high TOPx = Barindex DRAWTEXT("˅",TOPx,TOPy+ATR/2,Dialog,Bold,20) coloured(200,0,0,255) endif //Go Long Signal If BullCondition then BOTy = Low BOTx = Barindex DRAWTEXT("˄",BOTx,BOTy-ATR/2,Dialog,Bold,20) coloured(0,200,0,255) endif RETURN |
Share this
No information on this site is investment advice or a solicitation to buy or sell any financial instrument. Past performance is not indicative of future results. Trading may expose you to risk of loss greater than your deposits and is only suitable for experienced investors who have sufficient financial means to bear such risk.
ProRealTime ITF files and other attachments :PRC is also on YouTube, subscribe to our channel for exclusive content and tutorials


Hi Francesco,
Thanks for your code,
There is a little error. You need to add the notion of reversal (-1/+1). Because without this you will have too much signal as you see on your picture
Carter advice to take position to the third and exit wit hthe other signal
Sadly, I do an algo last week and the results are not very fantastic…May be the things change since his book
Regards
Zilliq
https://www.zilliqtradingresearch.fr/
Coding is not a crime 😉
Hi Zilliq!
I don`t understand were to put the notion of reversal (-1/+1). Can you please exlain or show in the code?
Regards Mikael
Hello. How can we modify the code to have an alert on each arrow buy and sell…? RETURN…..So we can test it with an alert in Prorealtime ?