

Display profit and loss on price chart with a custom indicator
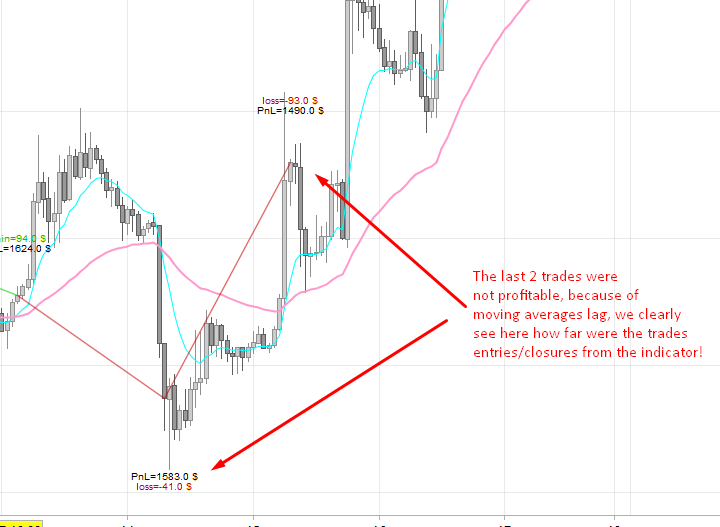
I made an indicator to display on your chart any strategy performance for a better reading of how indicators can lead you to believe that your fresh new founded trading strategy is an holy grail ..
A PnL indicator that display gain and loss on your chart! Why?
Someone ask me recently why his strategy doesn’t perform so well than what he was seeing on chart. I answered him that he should look at price Close, not at the color of the indicator he took to make his trades entries and exits. That’s the reason why I decided to code this little indicator that could help understand that price is the only relevant information, even if an indicator tell you something else.
Include the trading strategy code into the indicator
First, you’ll have to define your strategy into the indicator code. As an example I made a simple moving average crossover:
//the strategy
mm1 = average[10,1]
mm2 = average[50,1]
atr = averagetruerange[10]
if mm1 crosses over mm2 then
 direction=1
 lastclosebullish=close
 lastbarbullish=barindex
elsif mm1 crosses under mm2 then
 direction=-1
 lastclosebearish=close
 lastbarbearish=barindex
else
 direction=0
endif
If a new bullish or bearish crossover is detected, we store the price at where we took the decision to make a trade entry (lastclosebullish and lastclosebearish variables). We also store the barindex of the current chart, for future reference to draw our profit and loss segments (lines between a closure and a new entry).
At this point, if you need to change the strategy (and for sure you will), the useful variables are: lastclosebullish,lastbarbullish,lastclosebearish,lastbarbearish,direction. The “direction” variable is the one that tell us in which direction is the actual opened trade.
Draw segments between 2 trades with their profits and global PnL
Now, that we have the useful informations stored, we can use them each time a new trade is launched.
case of a bullish trade:
//(gain or loss?)
//case Bullish trend
if direction=1 and lastclosebearish>0 then
 if close<lastclosebearish then
  r=0
  g=200
 else
  r=200
  g=0
 endif
 //draw segment lines
 drawsegment(lastbarbearish,lastclosebearish,barindex,close) coloured(r,g,0,200)
 //calculate PnL and draw information text
 tradeprofit=round((lastclosebearish-close)/pointsize)*pointvalue
 pnl = pnl+tradeprofit
 if tradeprofit>=0 then     drawtext("gain=#tradeprofit#$",barindex,high+4*pointsize+atr) coloured(0,200,0)
 else
  drawtext("loss=#tradeprofit#$",barindex,high+4*pointsize+atr) coloured(200,0,0)
 endif
 drawtext("PnL=#pnl#$",barindex,high+atr)
endif
If a new bullish trade is detected, the current Close is tested to know if the last trade entry (a bearish one), was above or below it. Assuming the Close is above the last bearish entry, so the color is define to red (we have a loss) and vice-versa.
Segment liens are drawn between 2 last entries. The trade profit is calculated between these 2 last prices and displayed on chart with the according color (gain or loss, green or red).
Below this trade profit text, the global profit and loss (PnL) of the strategy is also displayed, to get the whole picture.
Full code to display the PnL on your chart
This is the full indicator’s code including the bullish and bearish parts.
//the strategy
mm1 = average[10,1]
mm2 = average[50,1]
atr = averagetruerange[10]
if mm1 crosses over mm2 then
 direction=1
 lastclosebullish=close
 lastbarbullish=barindex
elsif mm1 crosses under mm2 then
 direction=-1
 lastclosebearish=close
 lastbarbearish=barindex
else
 direction=0
endif

//(gain or loss?)
//case Bullish trend
if direction=1 and lastclosebearish>0 then
 if close<lastclosebearish then
  r=0
  g=200
 else
  r=200
  g=0
 endif
 //draw segment lines
 drawsegment(lastbarbearish,lastclosebearish,barindex,close) coloured(r,g,0,200)
 //calculate PnL and draw information text
 tradeprofit=round((lastclosebearish-close)/pointsize)*pointvalue
 pnl = pnl+tradeprofit
 if tradeprofit>=0 then
 drawtext("gain=#tradeprofit#$",barindex,high+4*pointsize+atr) coloured(0,200,0)
 else
  drawtext("loss=#tradeprofit#$",barindex,high+4*pointsize+atr) coloured(200,0,0)
 endif
 drawtext("PnL=#pnl#$",barindex,high+atr)
endif

//case Bearish trend
if direction=-1 and lastclosebullish>0 then
 if close>lastclosebullish then
  r=0
  g=200
 else
  r=200
  g=0
 endif
 //draw segment lines
 drawsegment(lastbarbullish,lastclosebullish,barindex,close) coloured(r,g,0,200)
 //calculate PnL and draw information text
 tradeprofit=round((close-lastclosebullish)/pointsize)*pointvalue
 pnl = pnl+tradeprofit
 if tradeprofit>=0 then
  drawtext("gain=#tradeprofit#$",barindex,low-4*pointsize-atr) coloured(0,200,0)
 else
  drawtext("loss=#tradeprofit#$",barindex,low-4*pointsize-atr) coloured(200,0,0)
 endif
 drawtext("PnL=#pnl#$",barindex,low-atr)
endif

RETURN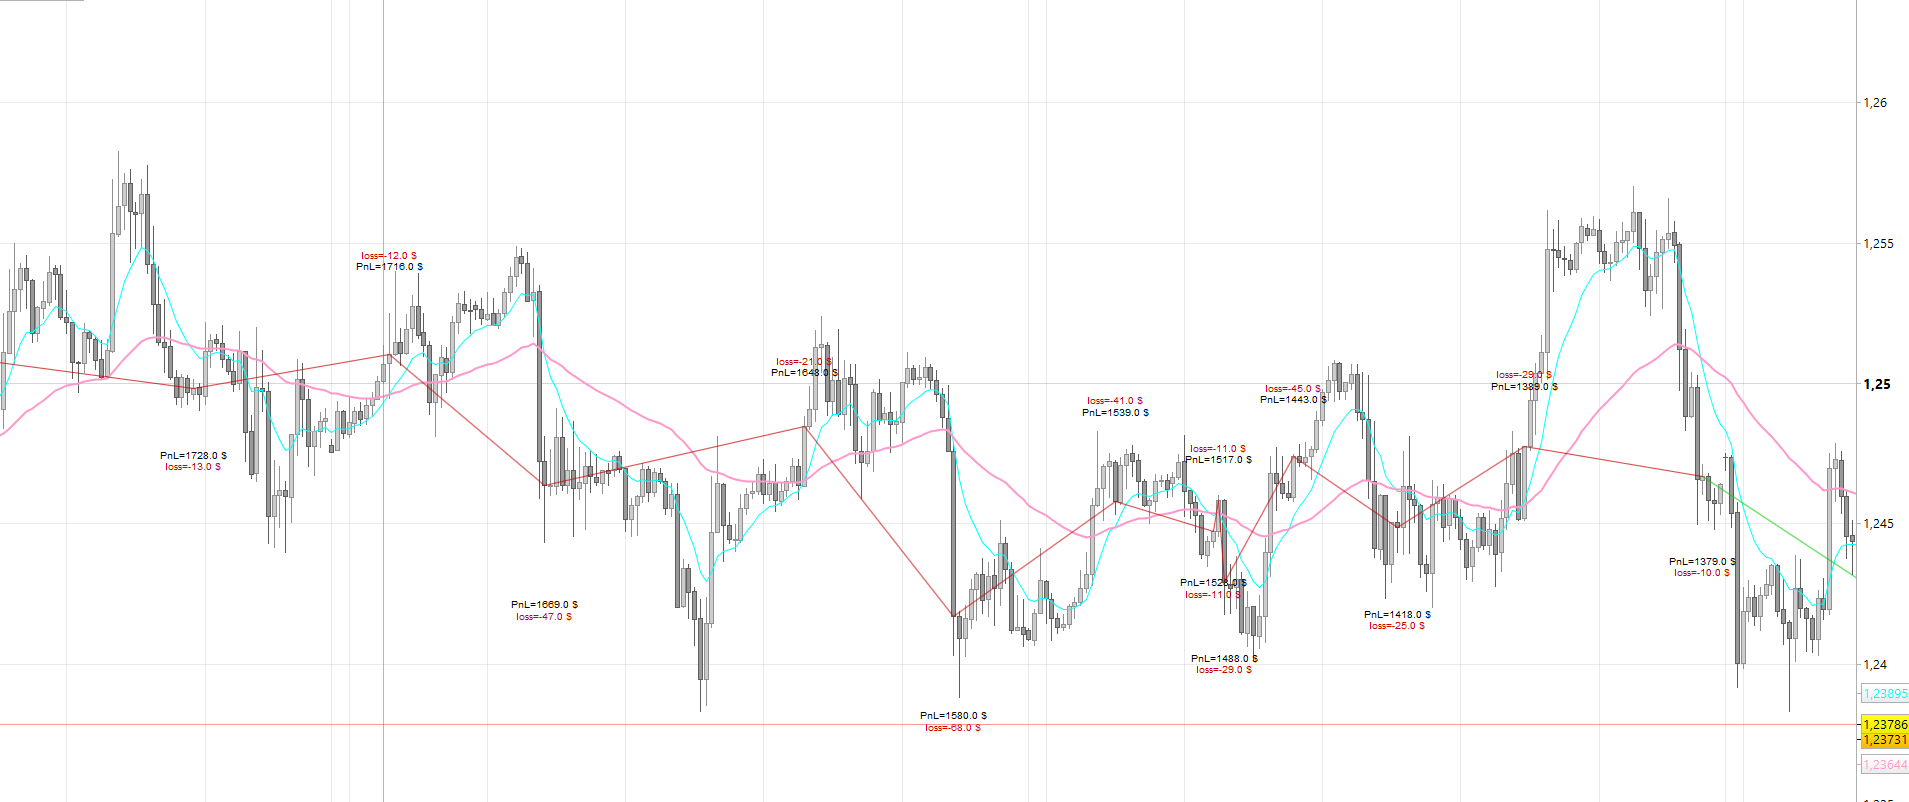
Improve the profit and loss indicator with any other useful information
This indicator could be improved with any information you’d like to be displayed on your chart (profit in points, indicators value, etc.).