







MACD divergences from price
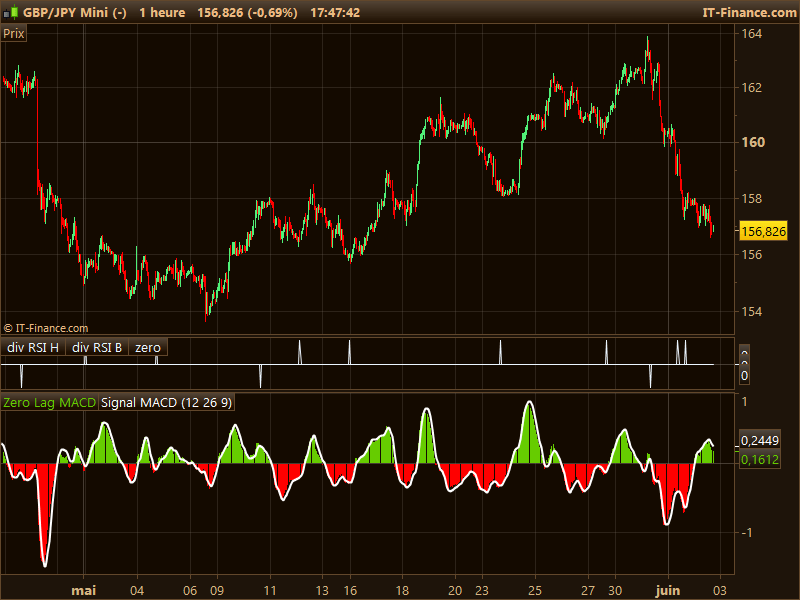
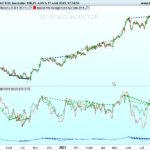
The MACD divergences spot difference between the price and the MACD histogram on recent lower low and highest high.
This indicator use the ZeroLag version of the MACD indicator that can be found on the library here: http://www.prorealcode.com/prorealtime-indicators/zerolag-macd/
Highest and Lowest point of the MACD are saved for divergence spotting only if the signal line of the MACD has crossed its histogram.
This indicator code is not the one of the MACD divergence indicator already embedded in the platform. It may have some differences of results between these two. This one can be used for any automated trading strategy development. The code is adapted from the RSI divergence HK-LISSE one.
// DIVERGENCES ZeroLag MACD adapted from HK-LISSE RSI divergences code

//MACD periods
short = 12
long = 26
signal = 9
//-----------

EMAshort1 = exponentialaverage[short](close)
EMAshort2 = exponentialaverage[short](EMAshort1)
DifferenceShort = EMAshort1 - EMAshort2
ZeroLagShort = EMAshort1 + DifferenceShort

EMAlong1 = exponentialaverage[long](close)
EMAlong2 = exponentialaverage[long](EMAlong1)
DifferenceLong = EMAlong1 - EMAlong2
ZeroLagLong = EMAlong1 + DifferenceLong

ZeroLagMACD = ZeroLagShort - ZeroLagLong

signal1=ExponentialAverage[signal](ZEROLAGMACD)
signal2=ExponentialAverage[signal](signal1)
DIFFERENCE2=signal1-signal2

SignalMACD=signal1+DIFFERENCE2
x = ZeroLagMACD
y = SignalMACD

//  BEARISH DIVERGENCES MACD

hi=max(hi,x)
hico=max(hico,max(high,high[1]))

if x crosses under y then
 sto2b=sto1b
 sto1b=hi
 hi=0
 p3b=p1b
 p2b=max(p1b,hico1)
 p1b=max(highest[3](high),hico)
  if p2b=p1b then
   p2b=max(p3b,p4b)
  endif
 hico=0
 hico1=0
endif
if x<y then
 p4b=hico1
 hico1=max(hico1,high)
endif
if p1b>p2b and sto1b<sto2b and x crosses under y and x<x[1] then
 signB= -2
else
 signB= 0
endif

// BULLISH MACD DIVERGENCES

lo=min(lo,x)
lowco=min(lowco,min(low,low[1]))

if x CROSSES OVER y  then
 sto2h=sto1h
 sto1h=lo
 lo=100
 p3h=p1h
 p2h=min(p1h,lowco1)
 p1h=min(lowest[3](low),lowco)
 if p2h=p1h then
  p2h=min(p3h,p4h)
 endif
 lowco=100000
 lowco1=100000
endif
if x>y then
 p4h=lowco1
 lowco1=min(lowco1,low)
endif
if p1h<p2h and sto1h > sto2h and x crosses over y and x>x[1]  then
 signH= 2
else
 signH= 0
endif

////////////////////////////////////////////////
RETURN signH as "Bullish MACD Divergence", signB as "Bearish MACD Divergence" , 0 as " zero "
Comments
You must be logged in to post a comment.

Hi Nicolas, >>This indicator code is not the one of the MACD divergence indicator already embedded in the platform... What's the name of the indicator embedded in the system?

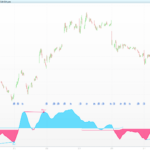
Hello Nicolas, in my opinion a divergence is only valid if between two low points or two high poins, the MACD histogram cross its centerline. Moreover, the bigger the difference between the two low/high points, the more powerfull is the divergence. Taking that into account, I don't see real divergence in the chart you used as example. What do you think?


This is a pretty useful indicator. I know how to identify divergences, but this definitely simplifies the task. I found that it is best used as an early warning signal, and then you open a trade on the next signal (on another indicator of your choice) confirming this one. e.g. every time if I had bought or sold based on this signal, I had a low chance of profit or breakeven. But if on this bullish signal, I waited for the next relative swing low to open my trade, I had about an 80-90% chance of profit or at least breakeven, even when it signaled countertrend during a larger opposite trend.
I'm a little new to PRC, so maybe some other newbies will appreciate a minor tip: binary indicators like this one are visually easier when you set to Histogram and set the bullish color to green, bearish to red.

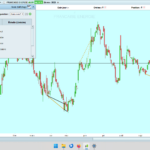
I think I've found it. My questions: 1. Do you have the source code? 2. The following is a screenshot. It seems sometimes it hasn't recognized the divergence?