Hi Guys,
Next game and next trials…
Perhaps as you see on the CCI, STO, SAR, Repulse file we can create a winning algo with a dumb indicator …
I really think we can create a winning algo with whatever Donkey indicator because the most important things in an algo is Market structure and money management
So the new challenge of this week (hope to have some time for) is to create an algo with an indicator you choose and my goal is to create an algo who can win after one week
Always on EUR/USD (Less bias) 1 mn and so on …
Let’s play Guys !
Hi Zilliq
In this case, i suggest only an algo based on candle and pivot. 😉
Hi Zilliq,
I don’t know if it should be a good challenge, but I worked with the bollinger bands with some timeframes and some markets.
Then I try to purpose this algo :
defparam cumulateorders = true
defparam preloadbars = 5000
defparam flatbefore = 080000
defparam flatafter = 180000

period = 20
dev = 2
data = customclose
MA = average[period](data)
BolUp = MA+STD[period]*dev
BolDn = MA-STD[period]*dev

//VENTE

c1v = high[1] > BolUp[1] or high[2] > BolUp[2]
c2v = high < BolUp

if c1v and c2v then
sellshort 1 contract at market
set stop ploss 20
set target pprofit 50
endif

//SORTIE VENTE

cc1v = low[5] < BolDn[5] or low[4] < BolDn[4] or low[3] < BolDn[3] or low[2] < BolDn[2] or low[1] < BolDn[1]
cc2v = close > open

if cc1v and cc2v then
exitshort at market
endif

//ACHAT

c1a = low[1] < BolDn[1] or low[2] < BolDn[2]
c2a = low > BolDn

if c1a and c2a then
buy 1 contract at market
set stop ploss 20
set target pprofit 50
endif

//SORTIE VENTE

cc1a = high[5] > BolUp[5] or high[4] > BolUp[4] or high[3] > BolUp[3] or high[2] > BolUp[2] or high[1] > BolUp[1]
cc2a = close < open

if cc1a and cc2a then
sell at market
endif

if time > 222500 then
sell at market
exitshort at market
endif
I suggest using the indicator called price.
defparam cumulateorders = false

if not onmarket and close < open then
buy 1 contract at market
endif

if not onmarket and close > open then
sellshort 1 contract at market
endif
If you can make that profitable across a very large historic data sample and also in a large forward testing sample then you will have proven a point!
Guys, I ask for an indicator for this challenge, not a setup on Price 😉
But whatever, I test with
c1 = (close > open)

c3 = (close < open)
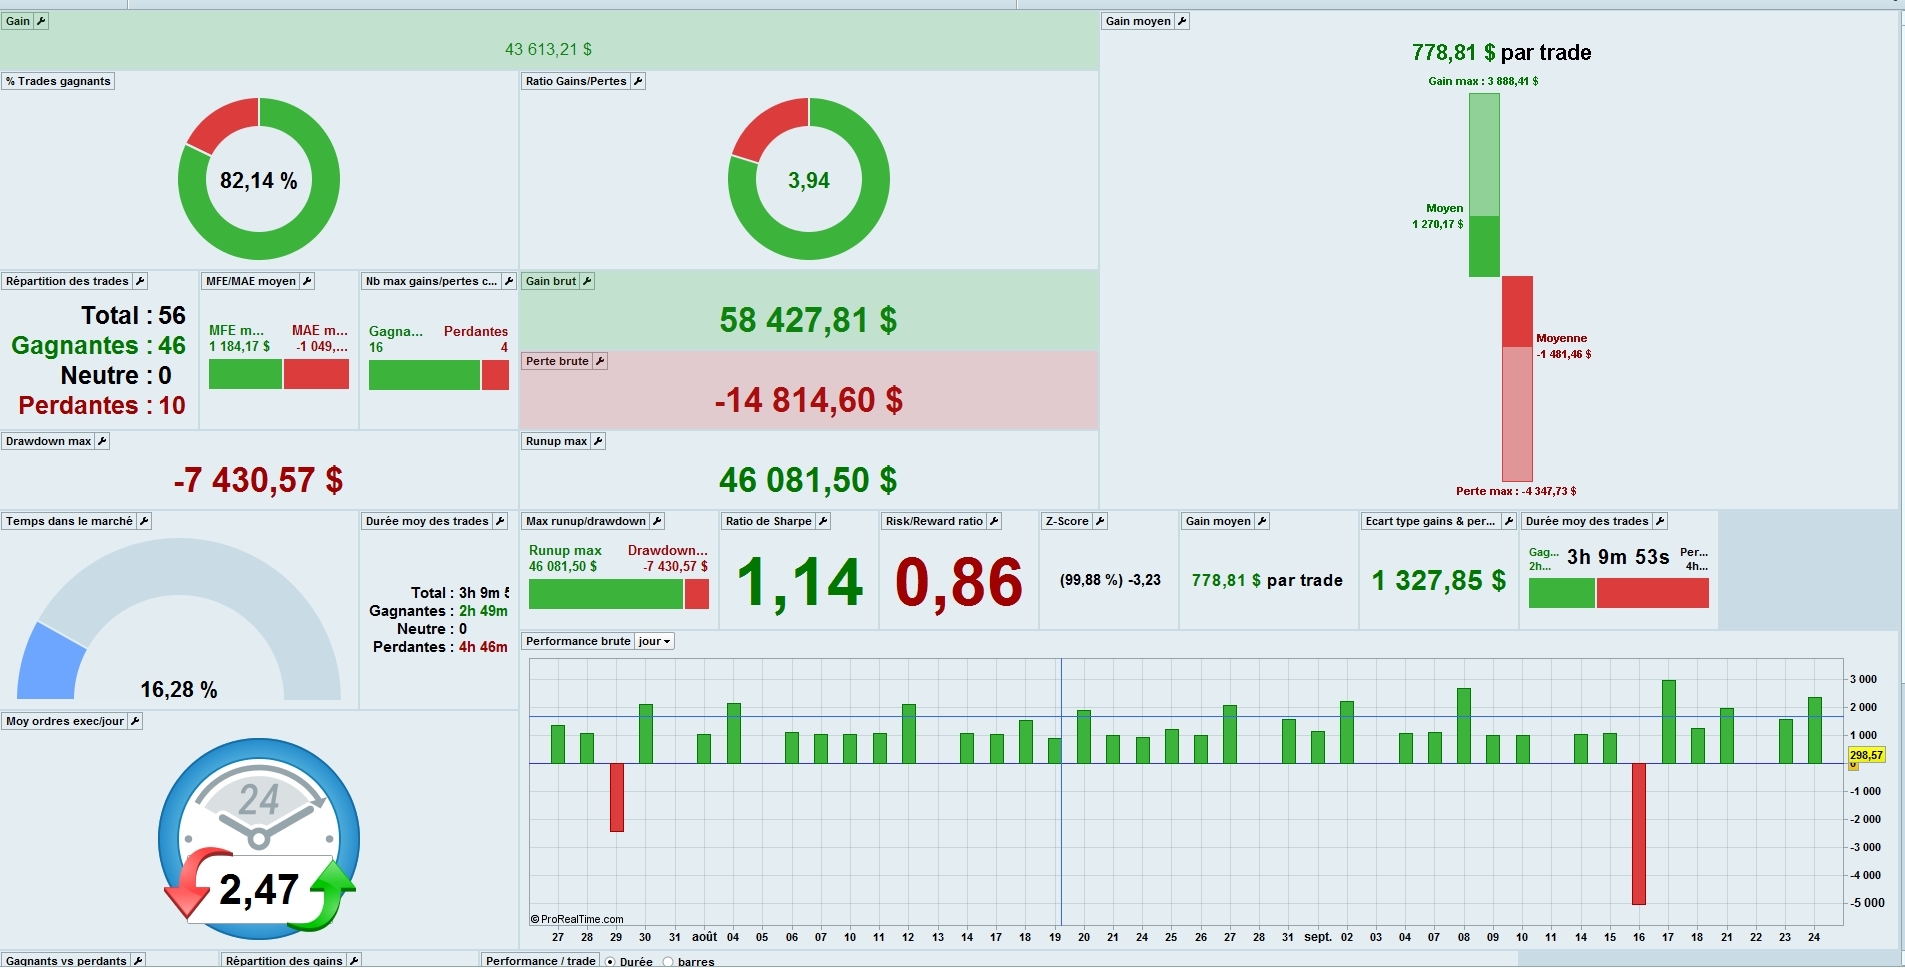
And you can find the results on 100 000 bars (Always with the same code for analyze structure and money management)
+436 %, 82.14 % winners, on 56 trades Win/Loss 3.94 Sharpe ratio 1.14 (Little bit small)
EUR/USD 1 mn Capital 10 000
Bye
Price movements are an indicator. A candle is just an indicator of price and what it has just done in the last x period of time.
Strange, my last message disappear …
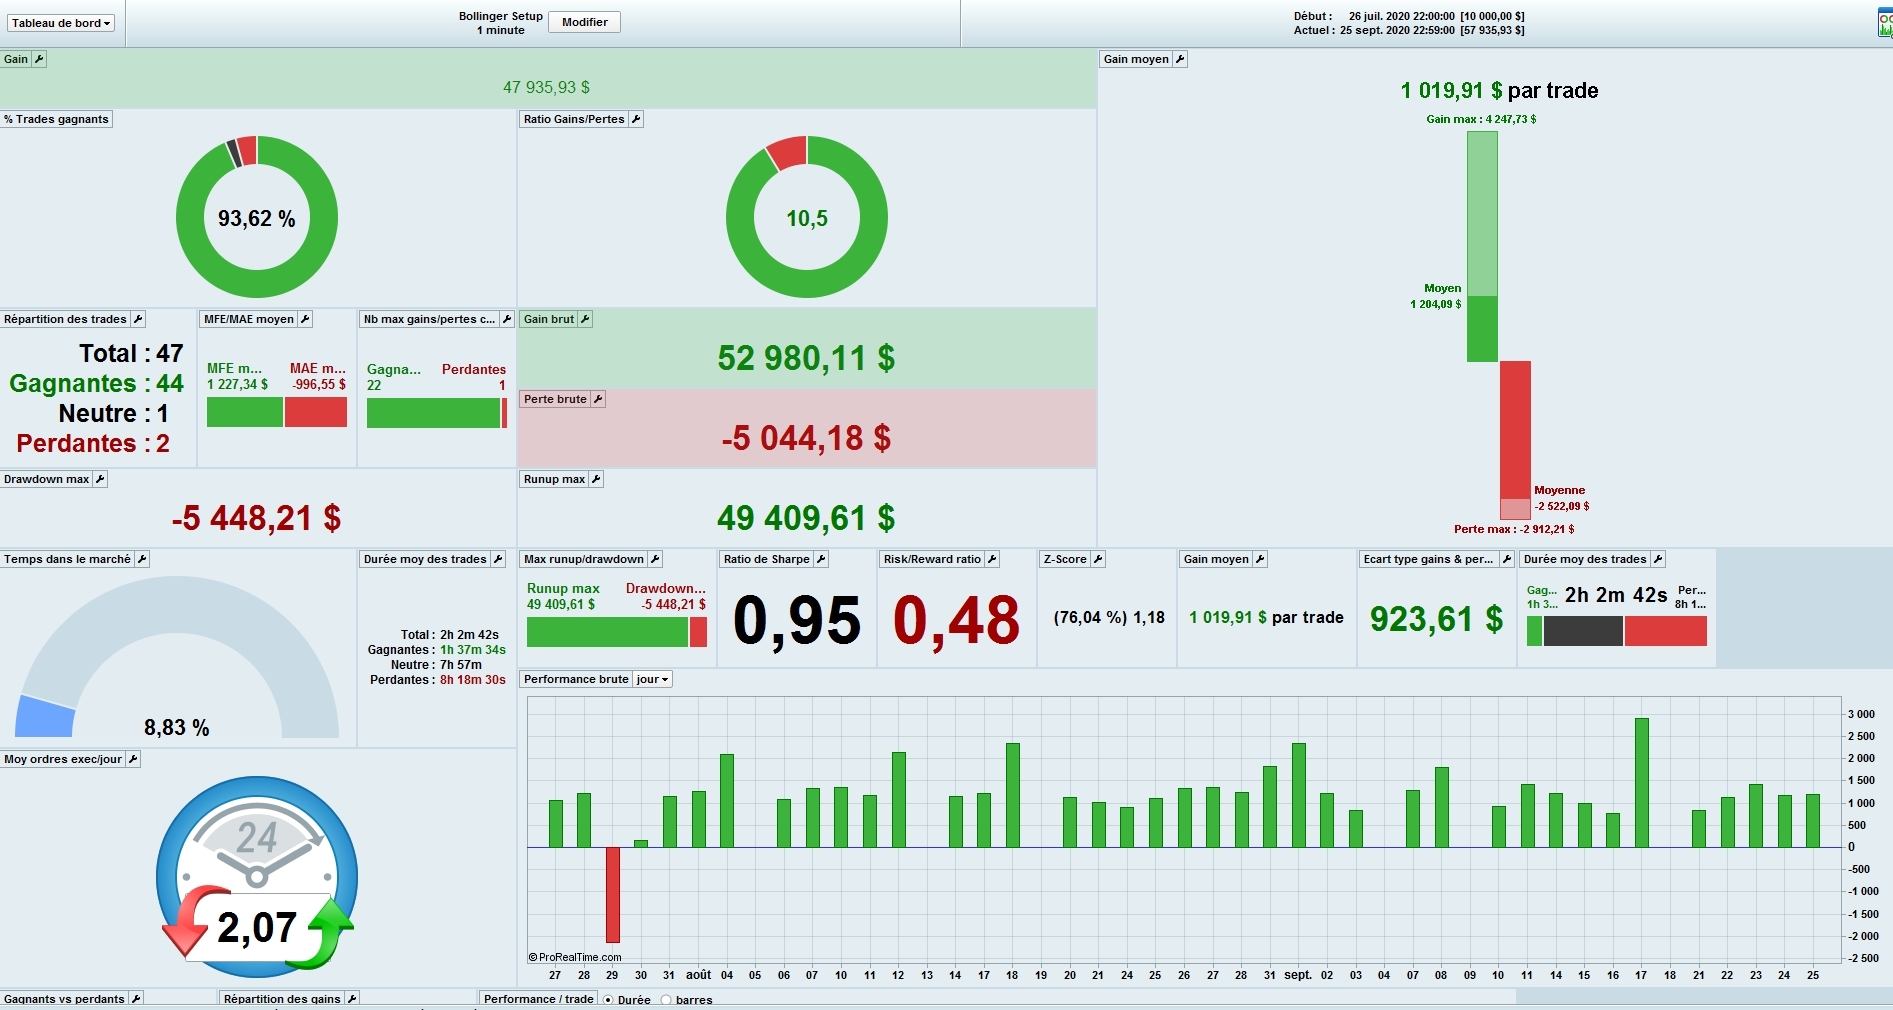
Whatever, I test with the Bollinger @Scooby but only as a signal not with all the strategy you propose because I couldn’t add the code for market structure and money management
The results are not bad
+479 %, 93.62 % winners win/loss of 10.5 and sharpe ratio of 0.95
I will run this second algo and see if it win the challenge to be a winner after one week
Bye
indicator1=BollingerUp[a](close)
indicator2=BollingerDown[a](close)

c1 = (close crosses over indicator1)

c3 = (close crosses under indicator2)
And you can find the results on 100 000 bars
Re the disappeared message (very strange?) … Please forgive me if I am wrong, but I can’t stop myself thinking that ‘smoke and mirrors’ might be used here? 🙂
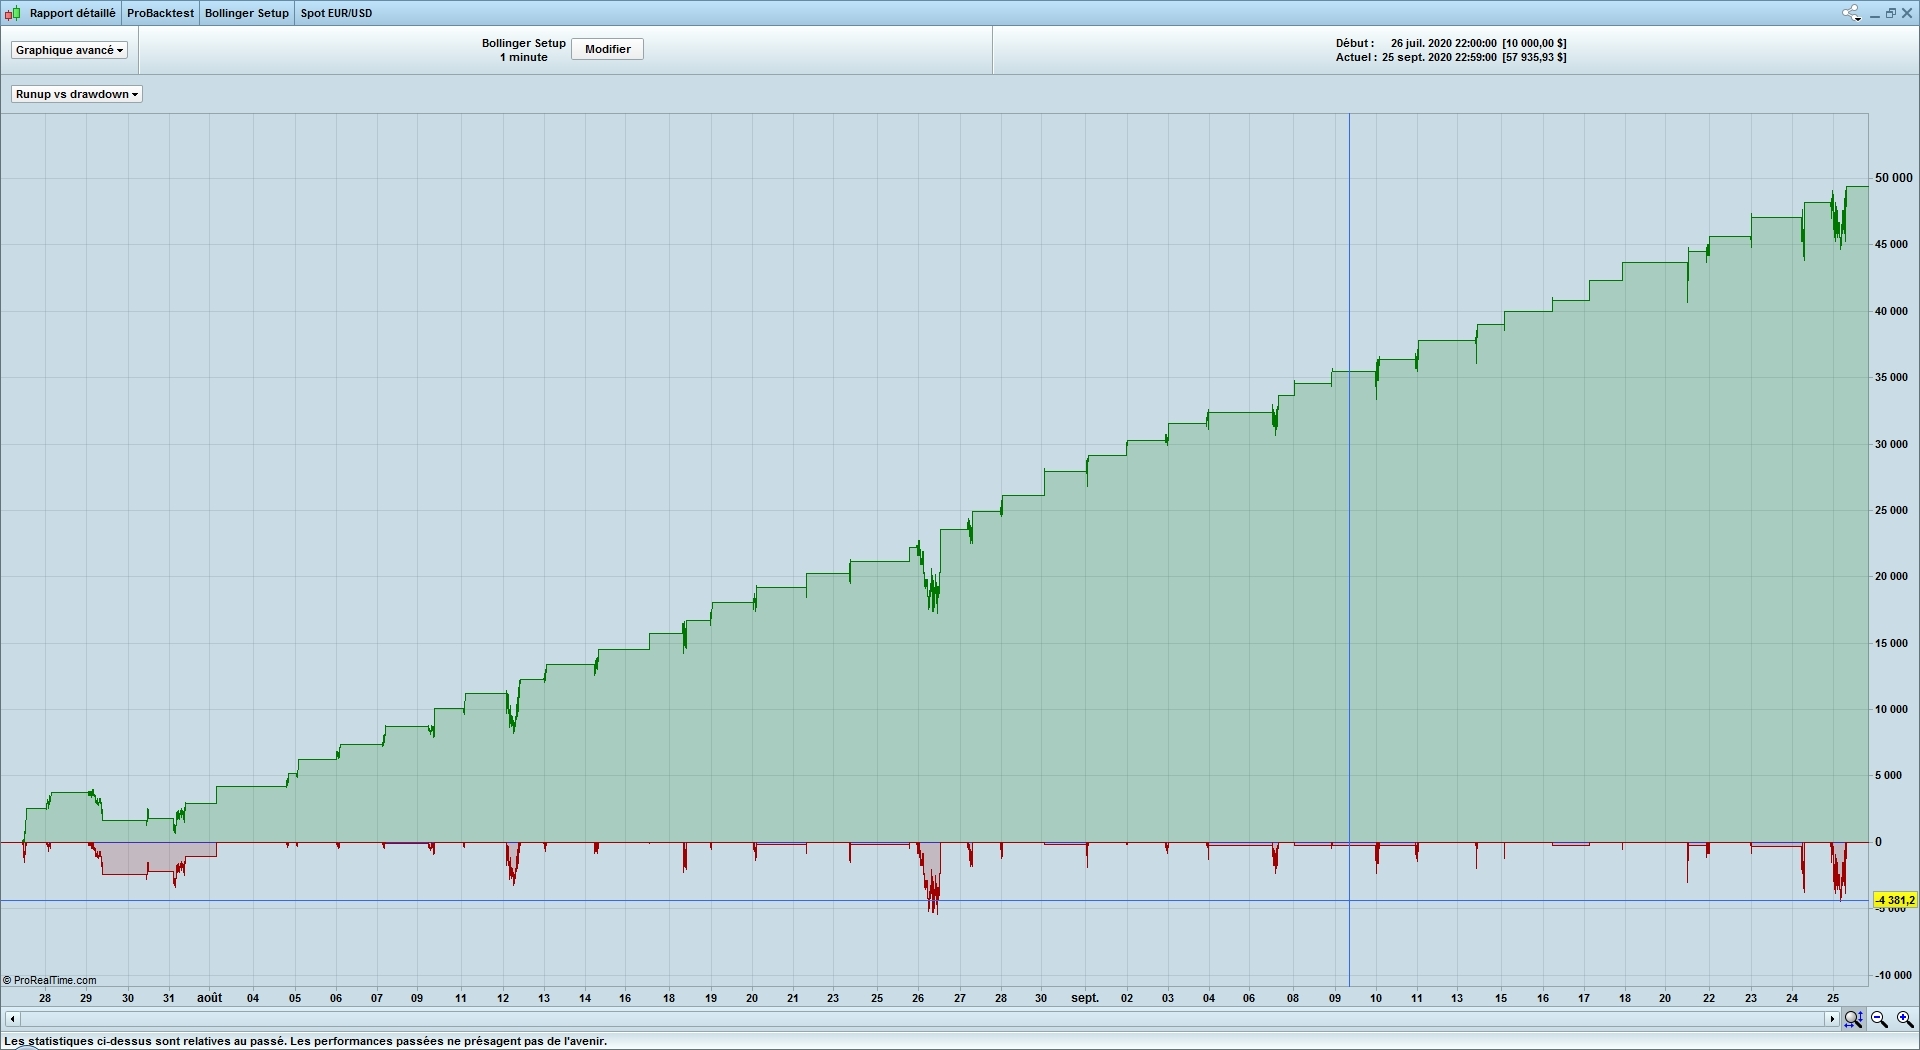
How come you choose not to show us the dates of the equity curve and also the duration of the backtest on the performance screen shot?
I sincerely want to believe what you are promoting as maybe then we all could have yachts like Vonasi and sail when the weather is sunny! 🙂
Hi @Grahal
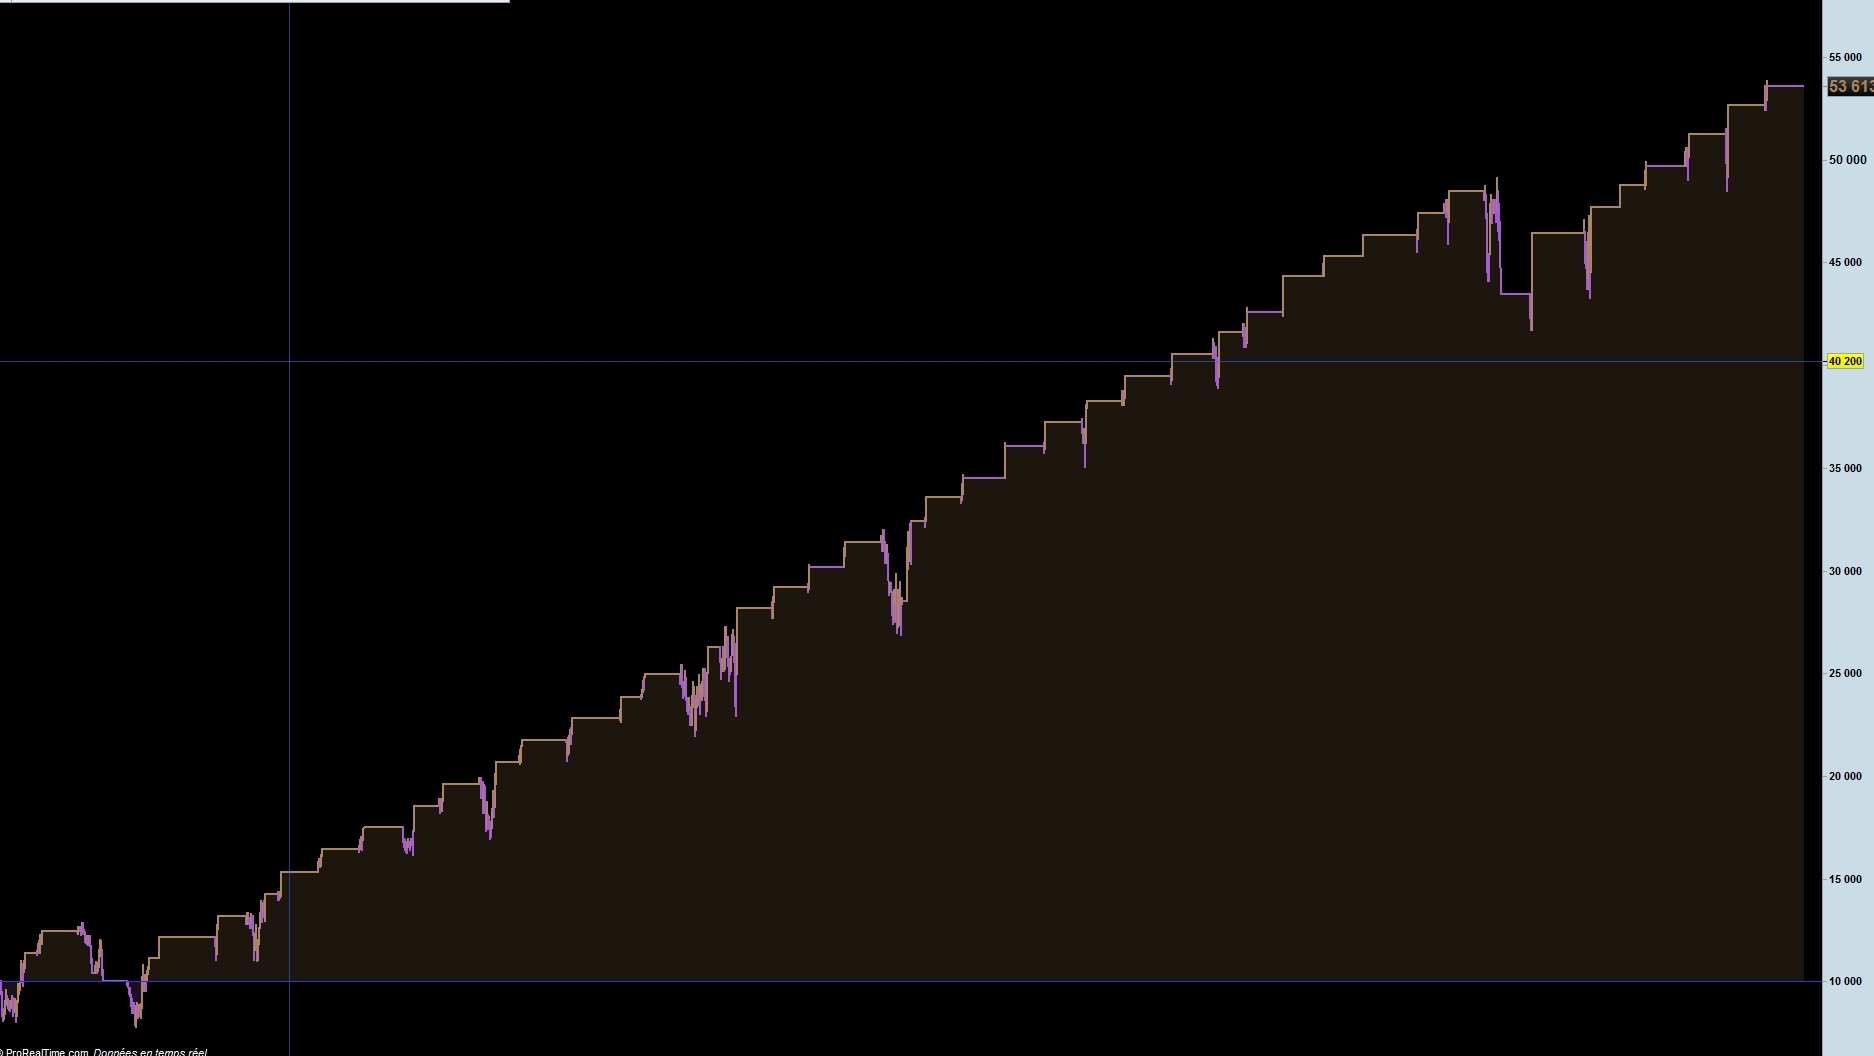
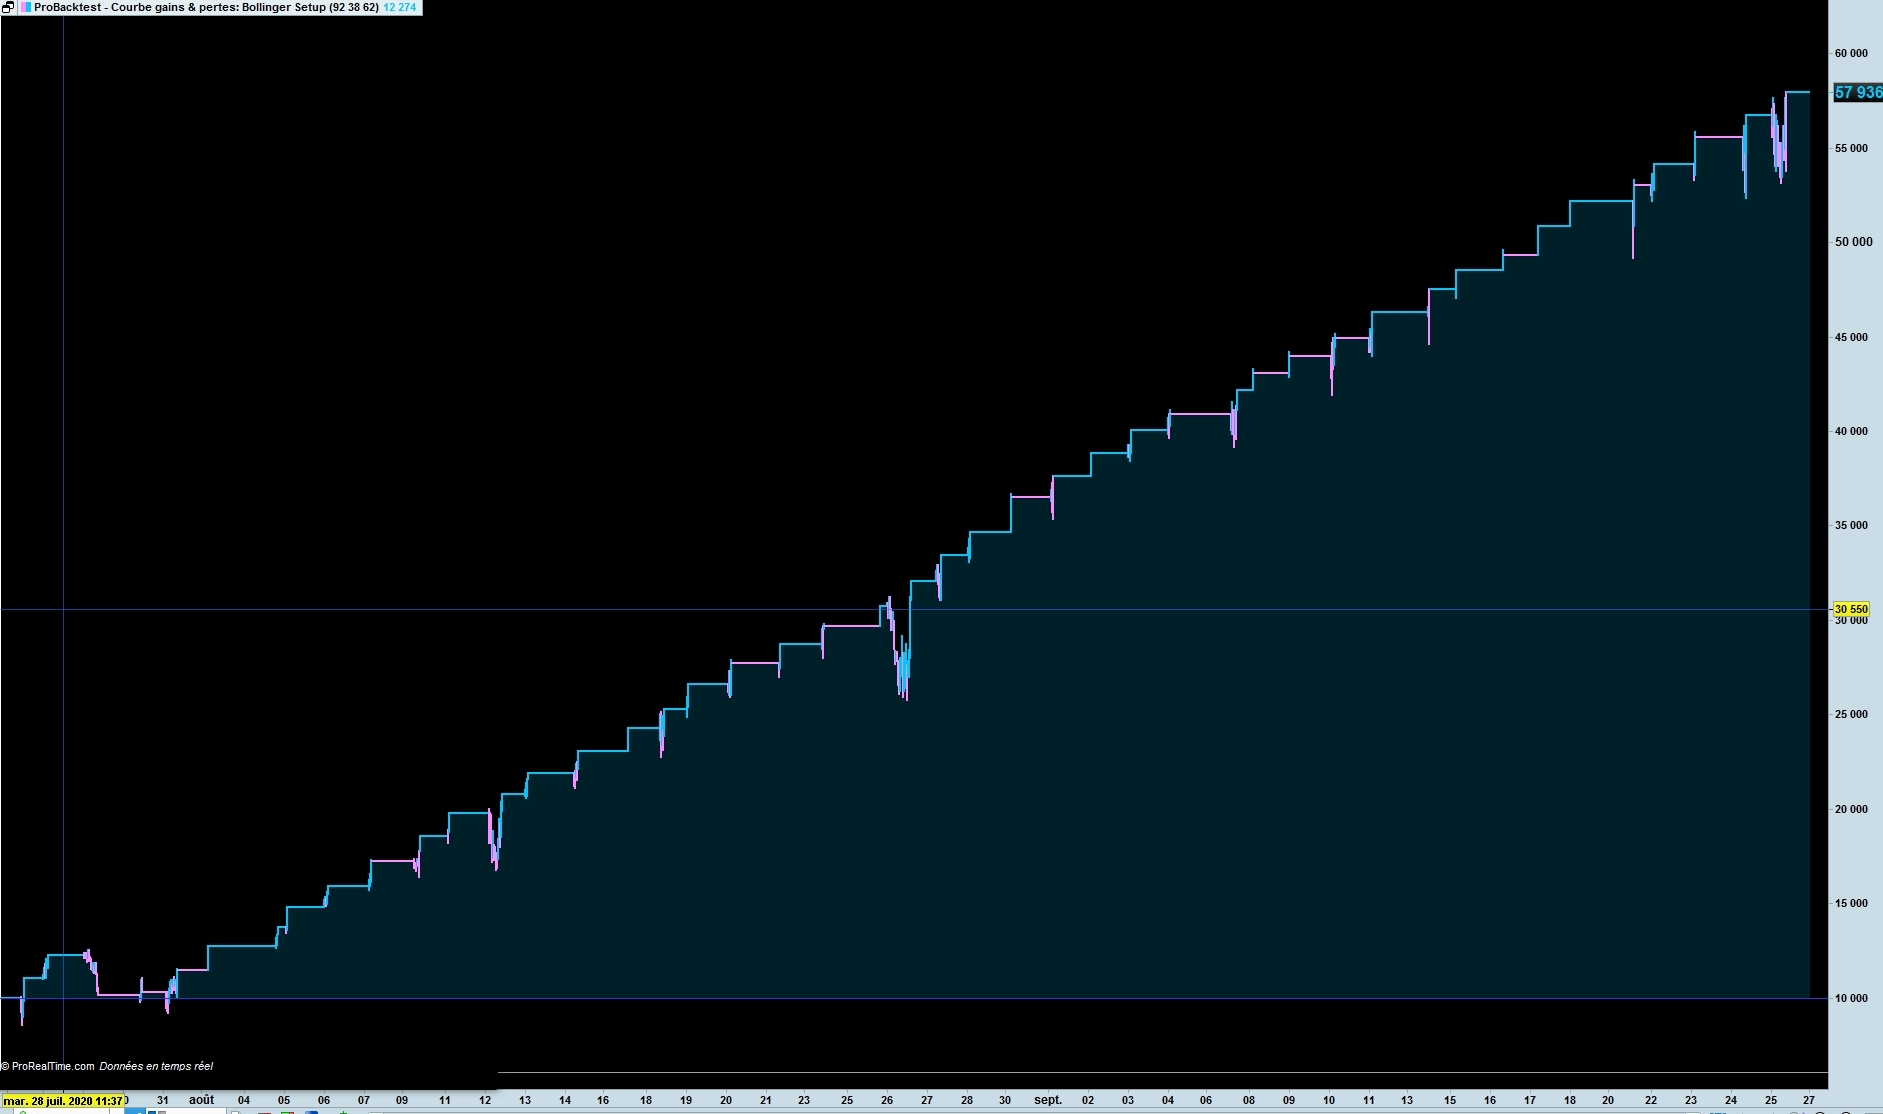
Not sure what picture you want to with dates. This one ?
If you want tto another I can post another, no problem
Bye
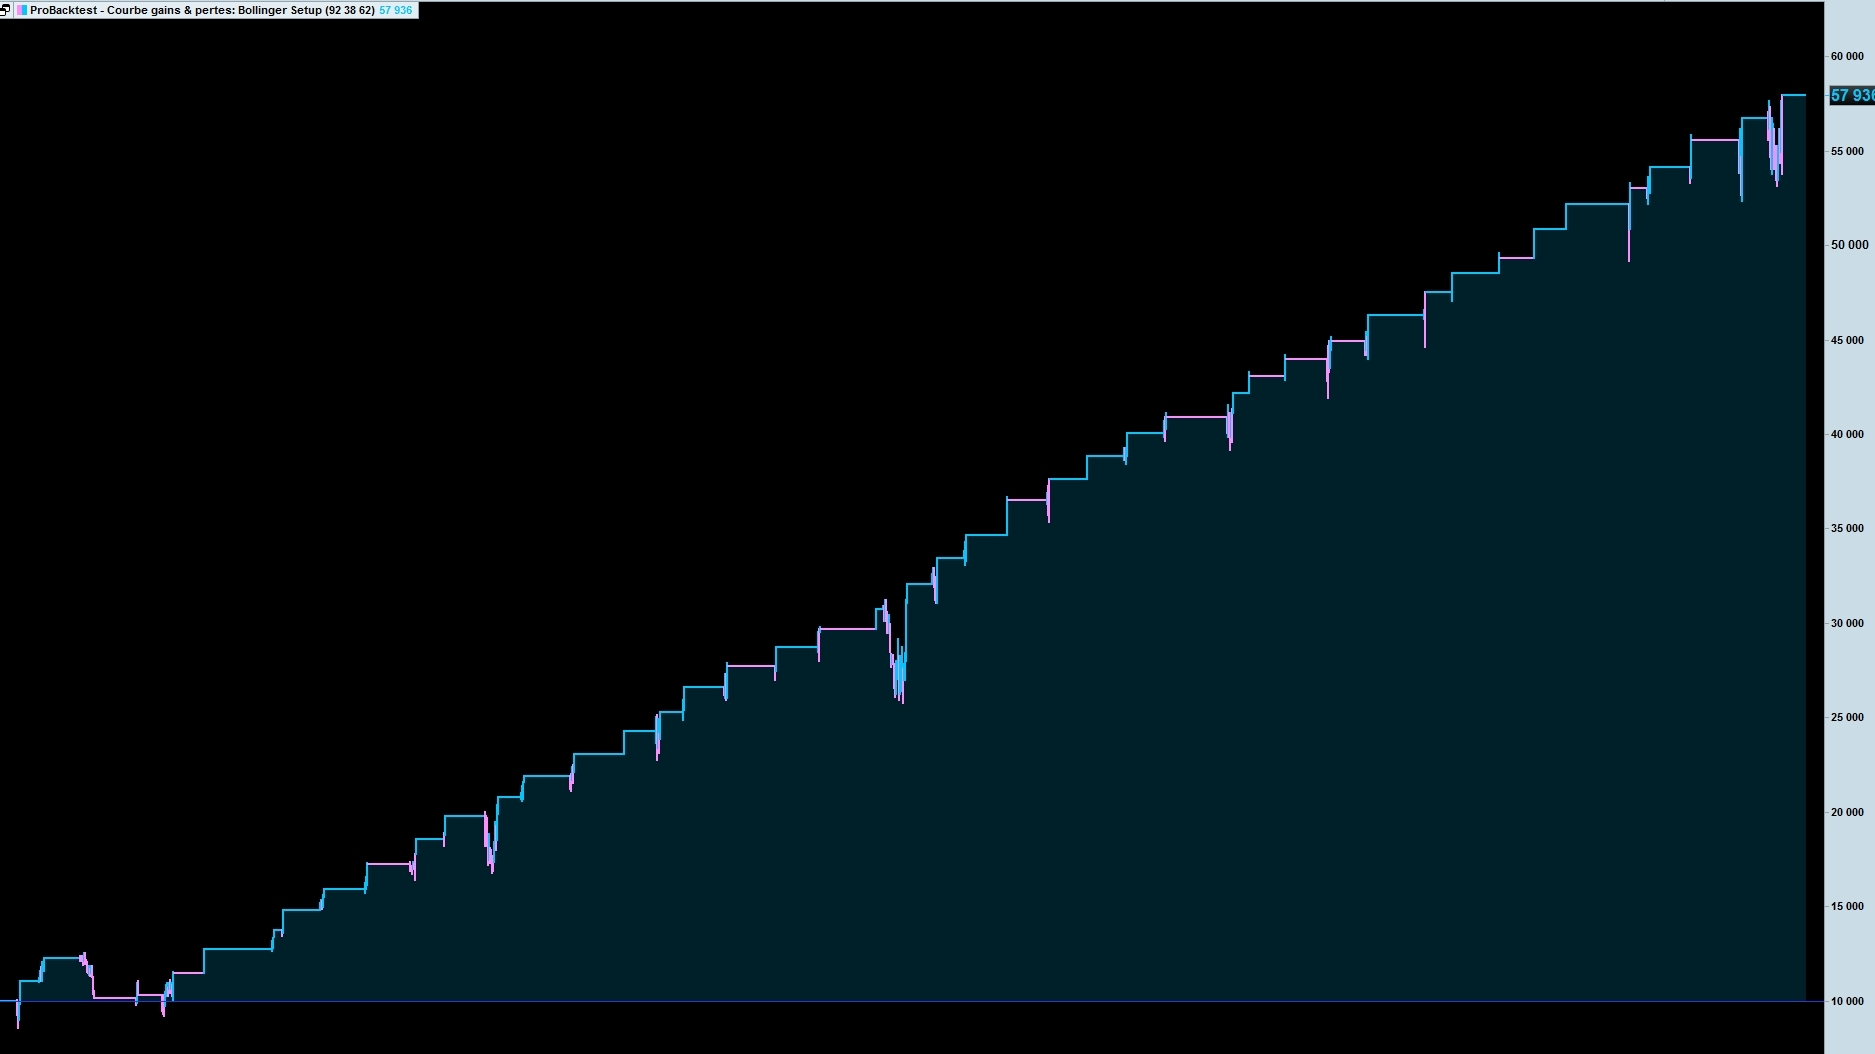
Another graph with dates with the Boll setup
How come you choose not to show us the dates of the equity curve and also the duration of the backtest on the performance screen shot?
I’m with you on this one. It is so much better if everyone posts screenshots with all the data included – dates, time frame, instrument and also position size. My guess is that what you call smoke and mirrors is in fact just some form of averaging down – or catching a falling knife.
Sorry Guys, I don’t understand what you call “form of averaging down – or catching a falling knife.”
No problem to post dates and so on …
Bye
Averaging down is buying more positions as price falls (if long) or shorting more positions as price rises (if short). You average your entry price down and reduce the distance price has to recover to return your position to profit. However sometimes price continues dropping and you run out of money before you can buy enough to save yourself. That’s why it is called ‘catching a falling knife’ – you try to catch it but the knife just keeps goeing through your hand and just keeps falling!
OK thanks @vonasi
I know what it was, but don’t understand the relationship with these algos ?
Whatever
averaging down – or catching a falling knife.
How would averaging down result in the (mostly) staircase rise in equity curve that zilliq shows?
The results would be more conclusive if the Price Curve were shown and also Positions under the equity curve.
Even allowing for a large position size (to give overall gain size) the results zilliq post look impressive.
We should try and reverse engineer his market structure set-ups and money management?? 🙂