Hi Melenova,
I’ve got PRT V10.3 and the code does not work.
Returns just blank window
Thanks a lot melenova for this interesting update.
@RomanPL
Texts and segments colour is light grey, maybe you need a dark background to see them? Did you test on an instrument with Volumes?
Sorry I didn’t make it clear before but this might also be your issue. You need to add ‘n’ as a variable (default ~5). You have to play with that variable to increase/decrease the scale of the wave you want to capture/see.
I have the same problem as RomanPL 😉
Hello,
I’d like to build a screener based on this indicator to be triggered when the value goes from negative to positive, but it doesn’t work. Can you please help me to do so. I used the PRC-Zig version of @melenova.
Here is my code :
indicator1 = CALL “PRC-Zig”
c1 = (indicator1[1] <= 0)
c2 = (indicator1 >= 0)
SCREENER[c1 AND c2] ((close/DClose(1)-1)*100 AS “% Veille”)
Yacine
My PRT level : (very) beginner
@preto73
The indicator melenova has posted don’t return any variable, so you can’t use it like the way you did. Since this indicator is only made of zigzag, your query is only to find peak and trough of this indicator. So this kind of code snippet below should do the trick:
// --- parameters
percentVariation = 5

ww = ZigZag[percentVariation](close)

peak = ww<ww[1] and ww[1]>ww[2]
trough = ww>ww[1] and ww[1]<ww[2]

screener[peak or trough]
Hello Nicolas,
Many thanks for your help.
Regards,
Yacine
Good evening, would it be possible to consider another mode of operation of this indicator other than ZigZag?
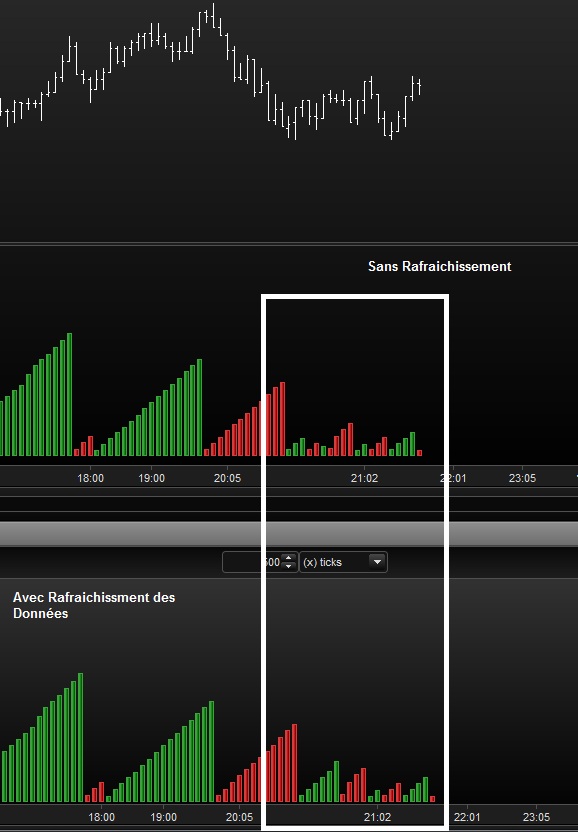
The ZigZag repaints enormously (Image Joint). And this is only a small example because in some trading sessions, without recurring refreshments the indicator becomes completely illegible!
Refresh permanently its graphics, while we receive a stream in real time, it’s a bit annoying anyway 🙂
Considering a real highest high or lowest low means some kind of validation. There are many ways to find peaks and throughs, what are you thinking about?
I do not really have any idea to tell the truth, I counted a little on you …;)
However PRT’s classic ZigZag indicator proposes a version in% and another in units! Could this solve the problem with a cumulative zigzag version Volume in Units ??
Even with units based ZigZag, the information should “repaint”, that’s the default and normal behavior of zigzag!
That’s why I created the now “famous” 😆 Fractals ZigZag indicator, this one needs X bars confirmation before adding new peak or new through.
Here is the version with negative Volumes when the last zigzag was a peak.
1
2
3
4
5
6
7
8
9
10
11
12
13
14
15
16
17
18
19
20
21
22
23
24
25
26
27
28
29
30
31
32
33
34
35
36
37
38
|
//PRC_CumulativeVolume ZigZag | indicator
//17.02.2017
//Sharing ProRealTime knowledge
// — parameters
// percentVariation = 9
zz = ZigZag[percentVariation](close)
peak = zz<zz[1] and zz[1]>zz[2]
tough = zz>zz[1] and zz[1]<zz[2]
if color=1 then
cumV = cumV+volume
else
cumV = cumV–volume
endif
if peak then
text = cumV/1000
drawtext(“#text#K”,barindex[1],cumV[1]+0.17*cumV[1],Dialog,Bold,12) coloured(0,200,0)
drawsegment(barindex[1],cumV[1]+0.20*cumV[1],previousX,previousY)
cumV = –Volume
color = –1
previousX = barindex[1]
previousY = cumV[1]+0.20*cumV[1]
elsif tough then
text = cumV/1000
drawtext(“#text#K”,barindex[1],cumV[1]+0.23*cumV[1],Dialog,Bold,12) coloured(200,0,0)
drawsegment(barindex[1],cumV[1]+0.20*cumV[1],previousX,previousY)
cumV = Volume
color = 1
previousX = barindex[1]
previousY = cumV[1]+0.20*cumV[1]
endif
return cumV coloured by color
|
What’s the meaning of those factors 0.17 and 0.20 that multiply cumV[1]?
Forget previous question (I understand that they are only the x and y coordinates where to write the “text”)
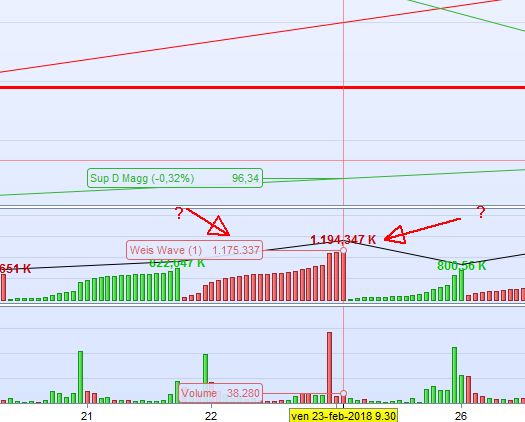
But why does the “text” take into account also the volume of next bar? This leads to a text different from the real cumulated volume (as shown in the attached pic)
Does the ZigZag function retrieve data from the future (as in Metastock) or is it based only on historical data?
If you are referring to the fact that the Zigzag is continuously repainting its last value to correspond perfectly to tops and bottoms, the answer is yes, it acts like this, otherwise it wouldn’t been called a zigzag 😉