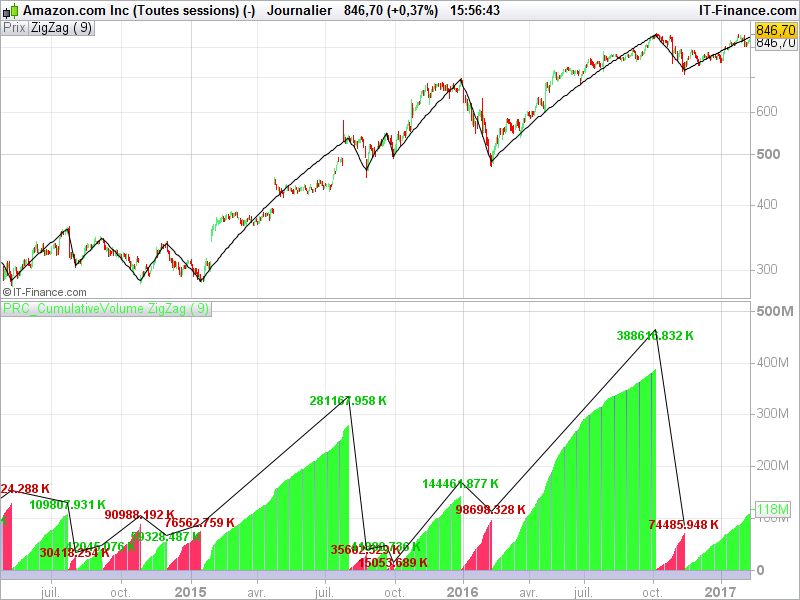
Full indicator with zigzag points and segments in the cumulative volume window has been posted into the code library, you can download it here:
https://www.prorealcode.com/prorealtime-indicators/zigzag-cumulative-volume/
There is still issue with cumulative volume.
in line 6 as it is the sum value is missing first volume after change of direction.
I’ve changed line 6 to:
cumV =cumV+volume[1] than the sum is missing last volume before direction change
How to fix this?
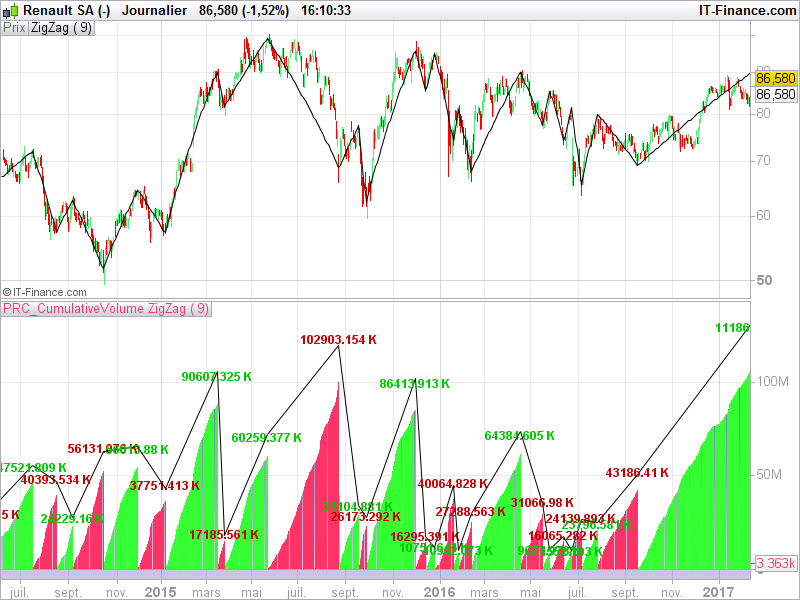
Did you test the version of the code Library? I made change since the one from this thread.
It works now, my mistake.
Thank for your help!
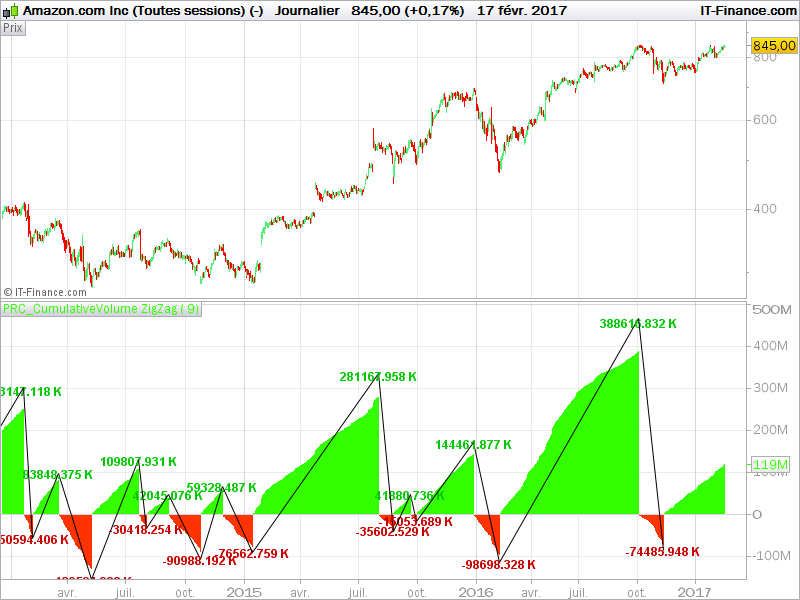
Is it possible to make a version of this indicator with the “green” histogram >0 and the red histogram <0 (but to keep the volume values )
Here is the version with negative Volumes when the last zigzag was a peak.
//PRC_CumulativeVolume ZigZag | indicator
//17.02.2017
//Nicolas @ www.prorealcode.com
//Sharing ProRealTime knowledge

// --- parameters
// percentVariation = 9

zz = ZigZag[percentVariation](close)

peak = zz<zz[1] and zz[1]>zz[2]
tough = zz>zz[1] and zz[1]<zz[2]

if color=1 then
cumV = cumV+volume
else
cumV = cumV-volume
endif

if peak then
text = cumV/1000
drawtext("#text#K",barindex[1],cumV[1]+0.17*cumV[1],Dialog,Bold,12) coloured(0,200,0)
drawsegment(barindex[1],cumV[1]+0.20*cumV[1],previousX,previousY)
cumV = -Volume
color = -1
previousX = barindex[1]
previousY = cumV[1]+0.20*cumV[1]
elsif tough then
text = cumV/1000
drawtext("#text#K",barindex[1],cumV[1]+0.23*cumV[1],Dialog,Bold,12) coloured(200,0,0)
drawsegment(barindex[1],cumV[1]+0.20*cumV[1],previousX,previousY)
cumV = Volume
color = 1
previousX = barindex[1]
previousY = cumV[1]+0.20*cumV[1]
endif

return cumV coloured by color
IG Markets just updated PRT to:
v10.3-1.8.0_45 and I’m able to display the ZigZag text.
For some reason the ZigZag graph shows correct value but the “Text” value is wrong?
This is constant across all the codes posted
What’s wrong with the text value? The Volume is cumulated each bar since the last peak or tough and then reset at next ones.
Just fly over with the cursor and you see that the value taken from the chart (correct) is different to the value shown by text(incorrect)
Actually the Text value is bigger by the next volume bar.
Yes, it’s my mistake, text variables must be changed with this code instead:
text = cumV[1]/1000
Because the peak or tough occurred 1 bar ago of course .. sorry.
Thanks it works!
do’t be sorry …….I own you a good drink!
does it repaints ? lika all other zig zags ….
@Paris yes of course, you will never know if the actual lowest low or highest high will remain in the next candlesticks. But finding the peak and tough of price is not the real purpose of this indicator.
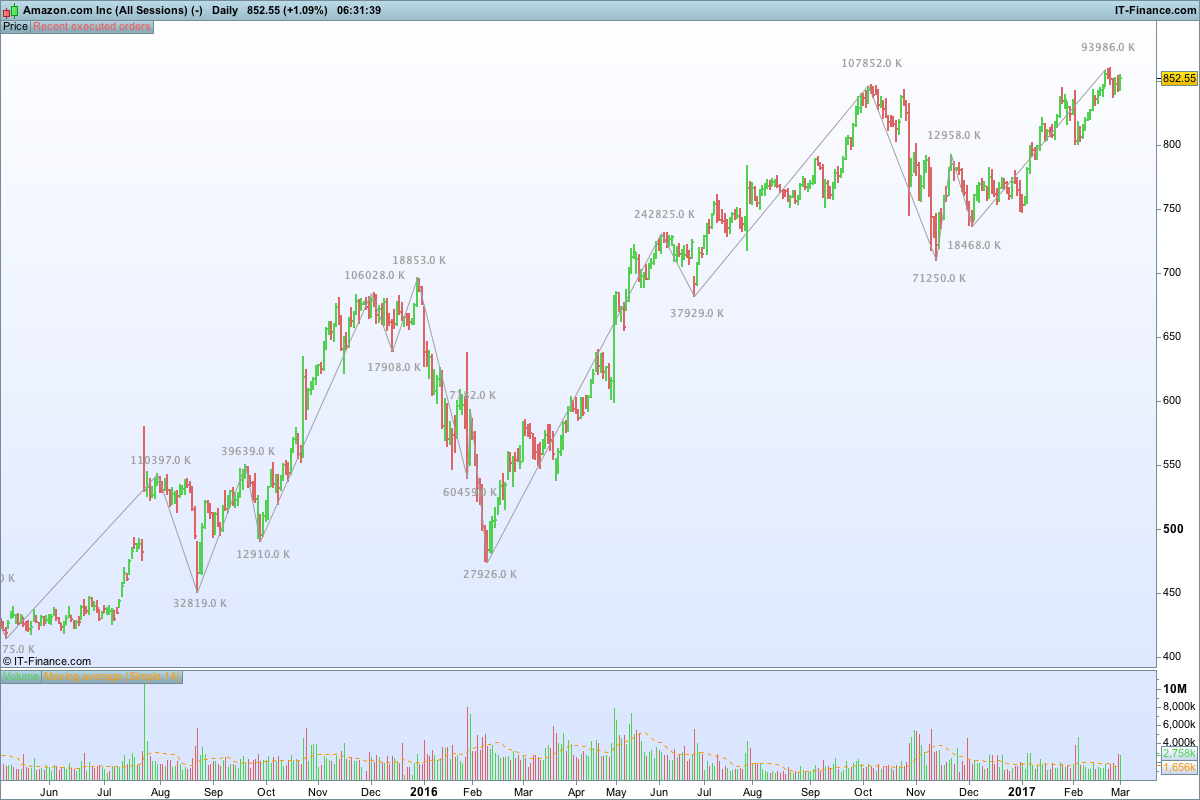
Thanks for your contributions Nicolas. I’ve been benefitting a lot from it so I thought I should make a small contribution. Here is my edit of the code in this thread to give an alternate display of the WeisWave indicator.
//Weis Wave

// --- parameters
percentVariation = n

ww = ZigZag[percentVariation](close)

peak = ww<ww[1] and ww[1]>ww[2]
trough = ww>ww[1] and ww[1]<ww[2]

cumV = cumV+volume


if peak then
text = Round(cumV[1]/1000)
drawtext("#text#K",barindex,1.02*highest[2],Dialog,Bold,10) coloured(160,160,160)
drawsegment(barindex[1],highest[2],previousX,previousY) coloured(160,160,160)
cumV = Volume
previousX = barindex[1]
previousY = highest[2]
elsif trough then
text = Round(cumV[1]/1000)
drawtext("#text#K",barindex,0.98*lowest[2],Dialog,Bold,10) coloured(160,160,160)
drawsegment(barindex[1],lowest[2],previousX,previousY) coloured(160,160,160)
cumV = Volume
previousX = barindex[1]
previousY = lowest[2]
endif

return