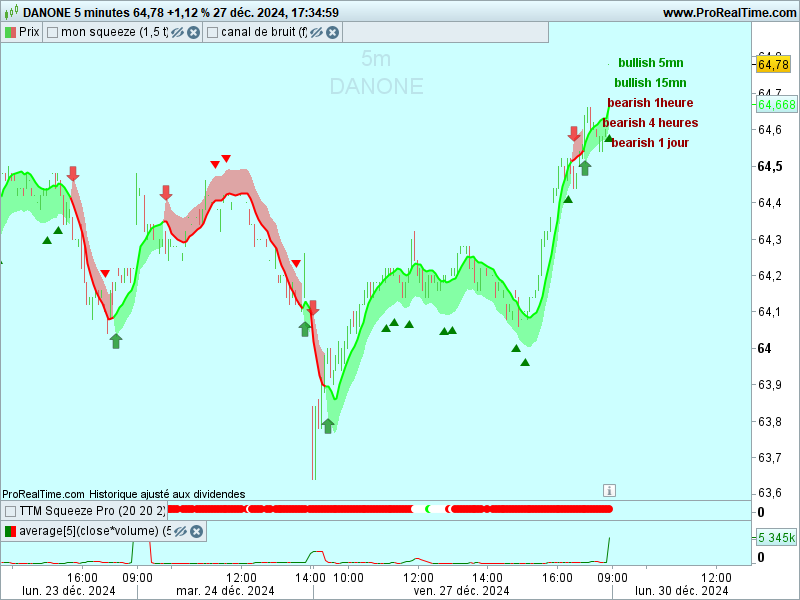
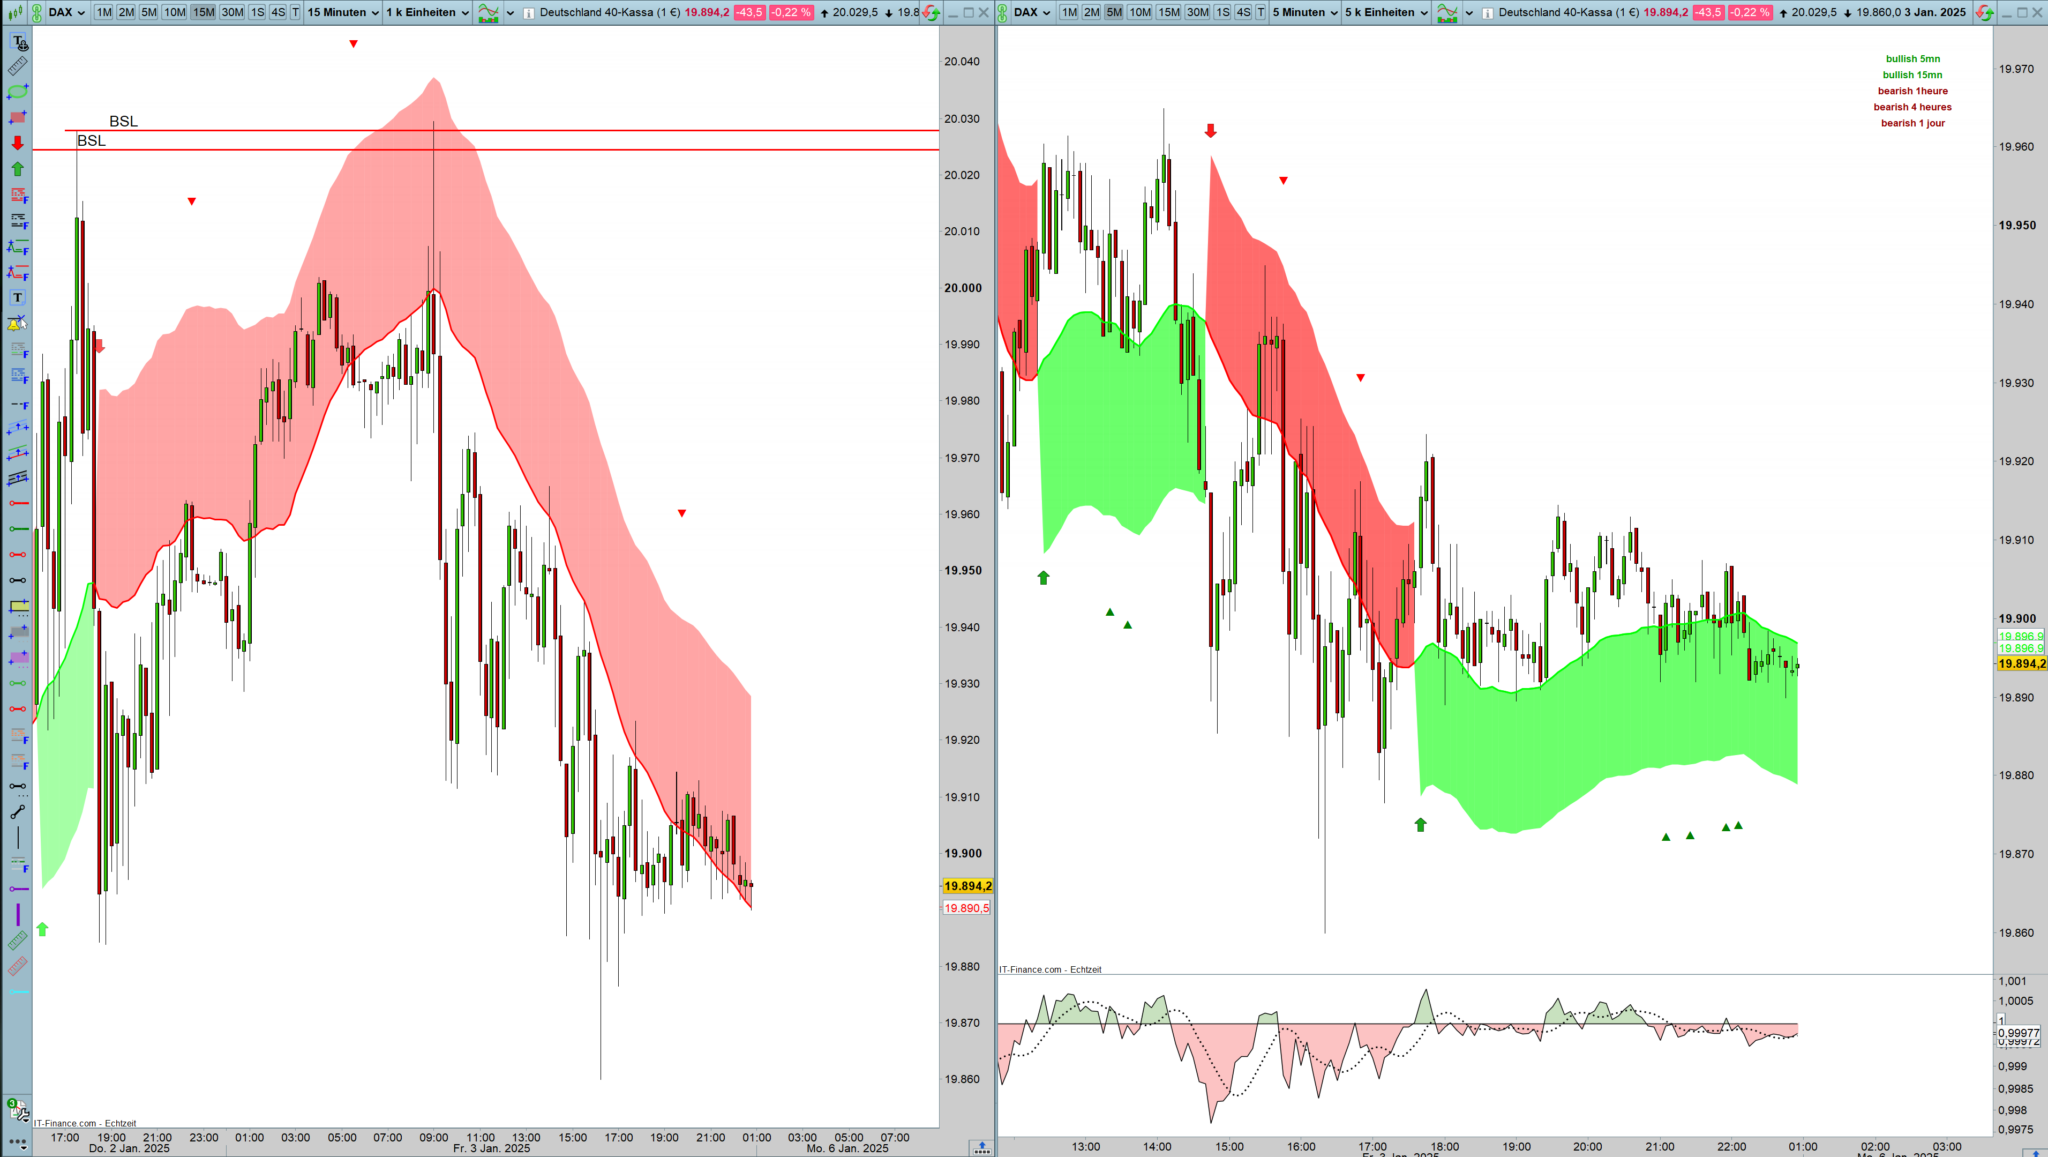
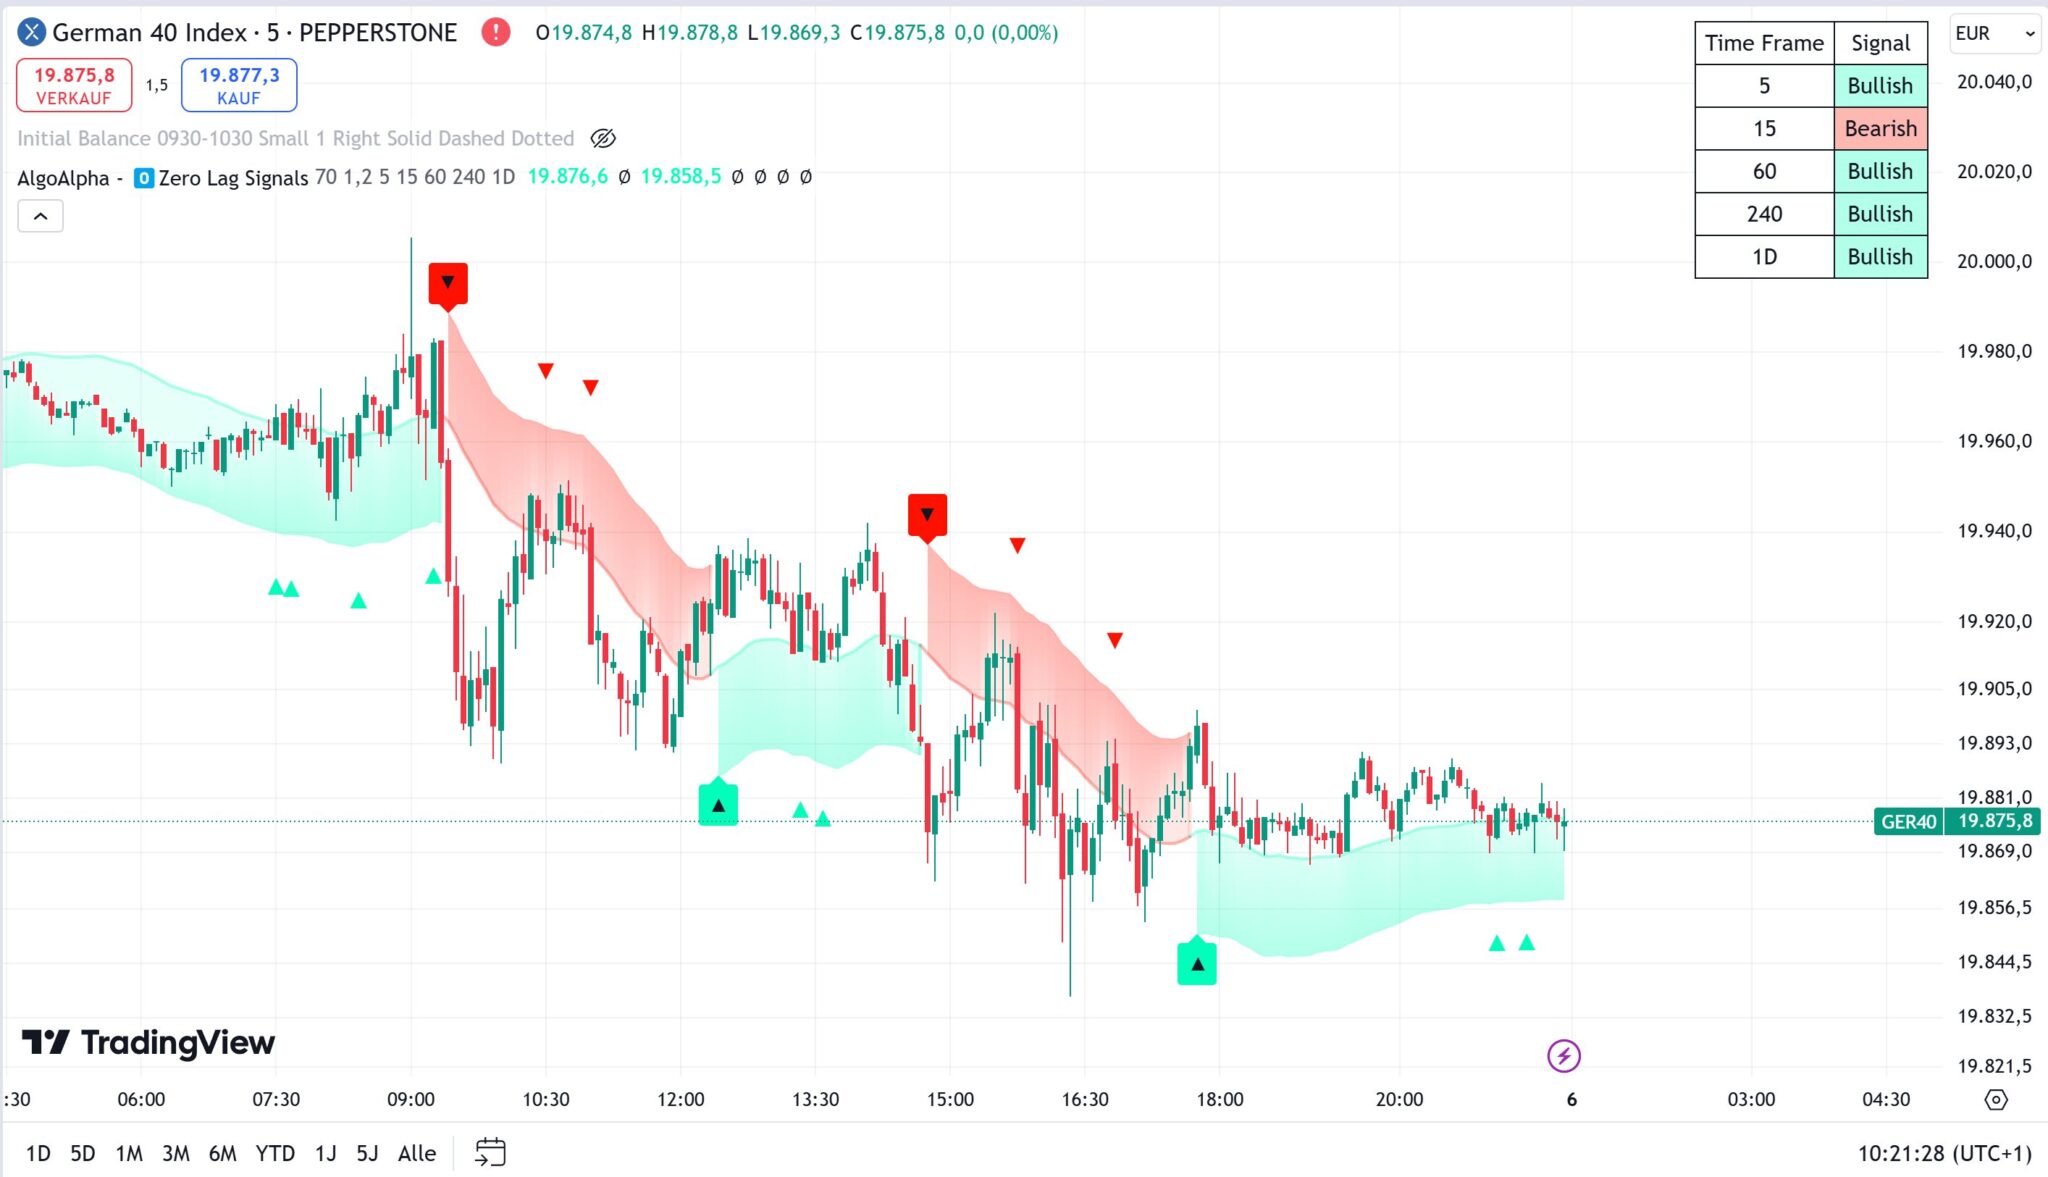
here is the indicator with the table as described in the video. it informs you if the trend is bullish or bearish on 4 different timeframes .
be careful you must use it in time units of 5 minutes
//PRC_Zero Lag Trend Signals
timeframe(5mn)
length=70
mult=1.2
src=close
lag=floor((length-1)/2)
myzlema=average[length,1](src+(src-src[lag]))
atr=averagetruerange[length](close)
volatil=highest[length*3](atr)*mult
once trend=0
if close crosses over myzlema+volatil then
trend=1
r=0
g=255
elsif close crosses under myzlema-volatil then
trend=-1
r=255
g=0
endif
if trend=-1 then
upper=myzlema+volatil
alpha1=90
lower=myzlema
alpha2=0
if trend<>trend[1] then
drawarrowdown(barindex,upper+0.25*atr)coloured(r,g,0,175)
endif
else
upper=myzlema
alpha1=0
lower=myzlema-volatil
alpha2=90
if trend<>trend[1] then
drawarrowup(barindex,lower-0.25*atr)coloured(0,128,0,175)
endif
endif
if close crosses over myzlema and trend=1 and trend[1]=1 then
drawtext(“▲”,barindex,myzlema-volatil*1.5)coloured(“green”)
elsif close crosses under myzlema and trend=-1 and trend[1]=-1 then
drawtext(“▼”,barindex,myzlema+volatil*1.5)coloured(“red”)
endif
if barindex > 4*length then
colorbetween(myzlema,upper,r,g,0,alpha1)
colorbetween(myzlema,lower,r,g,0,alpha2)
endif
if islastbarupdate then
if trend=1 then
DRAWTEXT(“bullish 5mn”,-100,-40,dialog,bold,12)coloured(0,150,0)anchor(topright,xshift,yshift)
else
DRAWTEXT(“bearish 5mn”,-100,-40,dialog,bold,12)coloured(150,0,0)anchor(topright,xshift,yshift)
endif
endif
timeframe (15mn)
myzlema15mn=average[length,1](src+(src-src[lag]))
atr15mn=averagetruerange[length](close)
volatil15mn=highest[length*3](atr15mn)*mult
once trend15mn=0
if close crosses over myzlema15mn+volatil15mn then
trend15mn=1
elsif close crosses under myzlema15mn-volatil15mn then
trend15mn=-1
endif
if islastbarupdate then
if trend15mn=1 then
DRAWTEXT(“bullish 15mn”,-100,-60,dialog,bold,12)coloured(0,150,0)anchor(topright,xshift,yshift)
else
DRAWTEXT(“bearish 15mn”,-100,-60,dialog,bold,12)coloured(150,0,0)anchor(topright,xshift,yshift)
endif
endif
timeframe (1h)
myzlema60mn=average[length,1](src+(src-src[lag]))
atr60mn=averagetruerange[length](close)
volatil60mn=highest[length*3](atr60mn)*mult
once trend60mn=0
if close crosses over myzlema60mn+volatil60mn then
trend60mn=1
elsif close crosses under myzlema60mn-volatil60mn then
trend60mn=-1
endif
if islastbarupdate then
if trend60mn=1 then
DRAWTEXT(“bullish 1heure”,-100,-80,dialog,bold,12)coloured(0,150,0)anchor(topright,xshift,yshift)
else
DRAWTEXT(“bearish 1heure”,-100,-80,dialog,bold,12)coloured(150,0,0)anchor(topright,xshift,yshift)
endif
endif
timeframe (4h)
myzlema240mn=average[length,1](src+(src-src[lag]))
atr240mn=averagetruerange[length](close)
volatil240mn=highest[length*3](atr240mn)*mult
once trend240mn=0
if close crosses over myzlema240mn+volatil240mn then
trend240mn=1
elsif close crosses under myzlema240mn-volatil240mn then
trend240mn=-1
endif
if islastbarupdate then
if trend240mn=1 then
DRAWTEXT(“bullish 4 heures”,-100,-100,dialog,bold,12)coloured(0,150,0)anchor(topright,xshift,yshift)
else
DRAWTEXT(“bearish 4 heures”,-100,-100,dialog,bold,12)coloured(150,0,0)anchor(topright,xshift,yshift)
endif
endif
timeframe (daily)
myzlema510mn=average[length,1](src+(src-src[lag]))
atr510mn=averagetruerange[length](close)
volatil510mn=highest[length*3](atr510mn)*mult
once trend510mn=0
if close crosses over myzlema510mn+volatil510mn then
trend510mn=1
elsif close crosses under myzlema510mn-volatil510mn then
trend510mn=-1
endif
if islastbarupdate then
if trend510mn=1 then
DRAWTEXT(“bullish 1 jour”,-100,-120,dialog,bold,12)coloured(0,150,0)anchor(topright,xshift,yshift)
else
DRAWTEXT(“bearish 1 jour”,-100,-120,dialog,bold,12)coloured(150,0,0)anchor(topright,xshift,yshift)
endif
endif
return myzlema as “Zero Lag Trends Signals”style(line,2)coloured(r,g,0)