Zero Lag Trend Signals Indicator by AlgoAlpha

Viewing 5 posts - 16 through 20 (of 20 total)
  • Author
    Posts
  • #242177 quote
    jacquesgermainjacquesgermain
    Participant
    Veteran

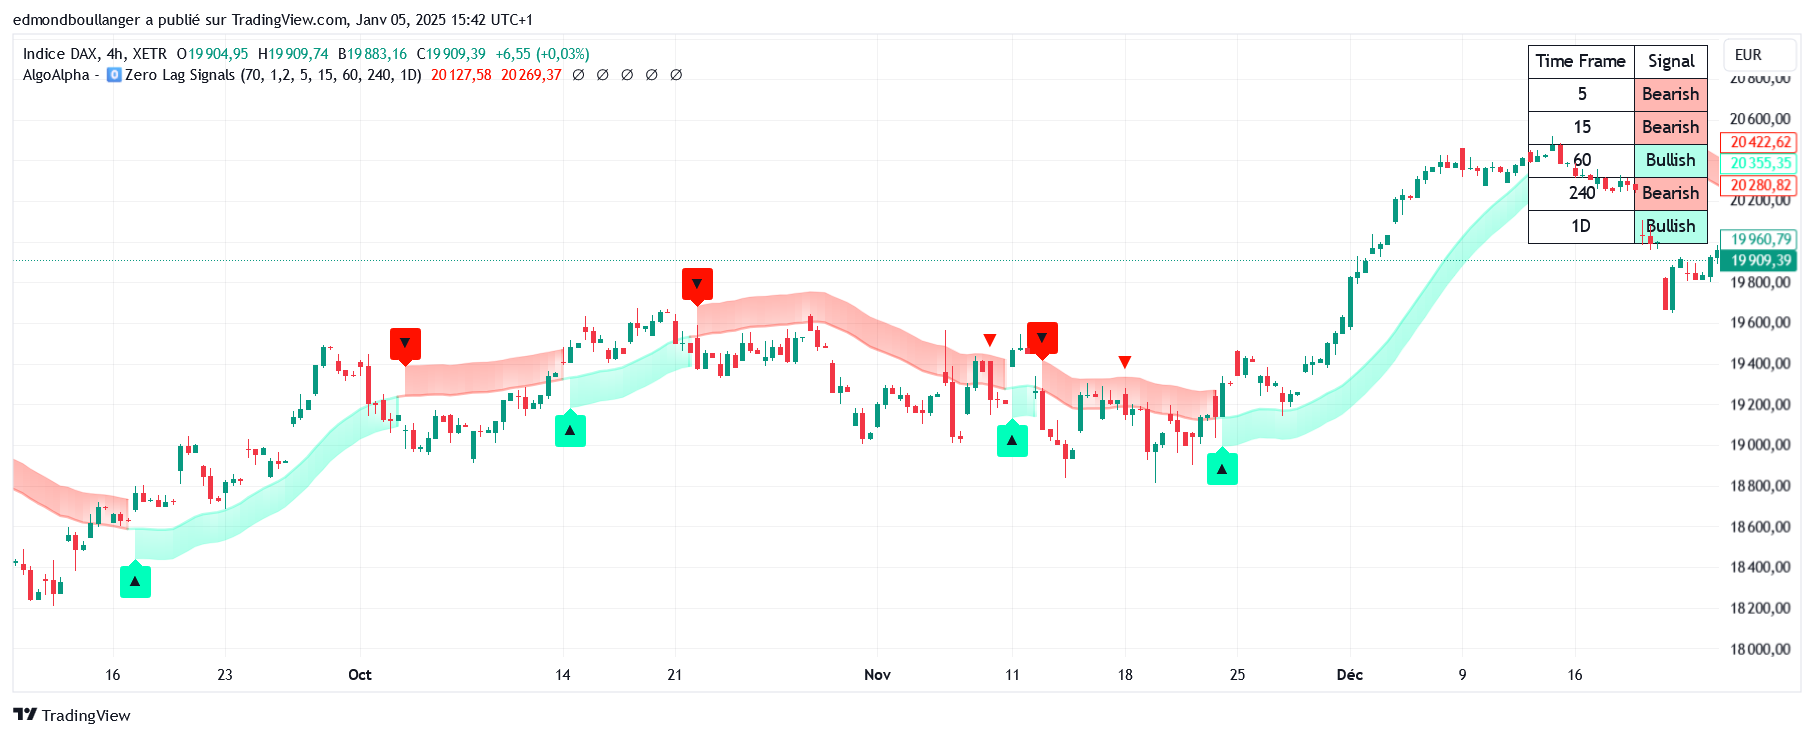
    Bonjour le close de votre comparaison  Tradingview/19875 n’étant pas le même que le close prt/19906 cela pose Problème.

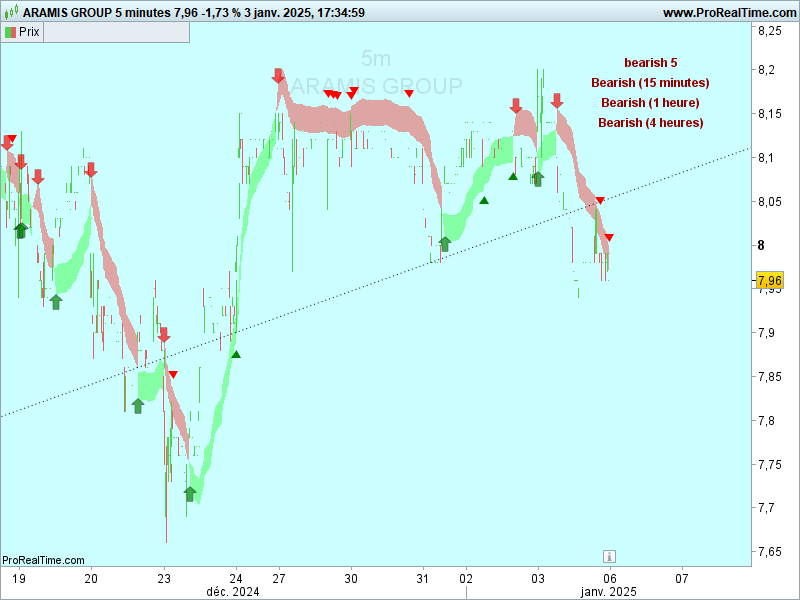
    ma dernière révision MULTIFRAME fonctionne à l’identque de tradingview mais malheureusement avec un multiframe 5mn/15mn/4/day et une période de 70 il est trop long à caculer pour prt ! ‘pour calculer en jour en 5’il faut pour highest1j[length*3] : 70*3*(1440/5)=60480 bar cela fonctionne  mais c’est long à charger… l’astuce est donc de lancer ma dernière révision 5mn/15mn/4/ (en 5minutes avec 10800 barres  puis de voir sur l’indicateur sans multiframe,

    defparam CALCULATEONLASTBARS=10800
    //révision du 05/01/2025 par jacquesgermain
    // PRC_Zero Lag Trend Signals multiframe à lancer en période 5 minutes et 11000 unités
    // Configuration pour le timeframe 5 minutes
    timeframe(5 mn )
    length = 70
    mult = 1.2
    myzlema = ZLEMA[length](close)
    atr = averagetruerange[length](close)
    volatil = highest[length*3](atr)*mult
    once trendy = 0
    if close crosses over myzlema + volatil then
    trendy=1
    r = 0
    g = 255
    elsif close crosses under myzlema – volatil then
    trendy=-1
    r = 255
    g = 0
    endif
    // Affichage des flèches
    if trendy = -1 then
    upper = myzlema + volatil
    alpha1 = 90
    lower = myzlema
    alpha2 = 0
    if trendy <> trendy[1] then
    drawarrowdown(barindex, upper + 0.25 * atr) coloured(r, g, 0, 175)
    endif
    else
    upper = myzlema
    alpha1 = 0
    lower = myzlema-volatil
    alpha2 = 90
    if trendy <> trendy[1] then
    drawarrowup(barindex, lower – 0.25 * atr) coloured(0, 128, 0, 175)
    endif
    endif
    if close crosses over myzlema and trendy = 1 and trendy[1] = 1 then
    drawtext(“▲”, barindex, myzlema – volatil * 1.5) coloured(“green”)
    elsif close crosses under myzlema and trendy = -1 and trendy[1] = -1 then
    drawtext(“▼”, barindex, myzlema + volatil * 1.5) coloured(“red”)
    endif
    if barindex > 4 * length then
    colorbetween(myzlema, upper, r, g, 0, alpha1)
    colorbetween(myzlema, lower, r, g, 0, alpha2)
    endif
    once trendy = 0
    if close crosses over myzlema + volatil then
    trendy=1
    elsif close crosses under myzlema – volatil then
    trendy=-1
    endif
    once trend = 0
    if close > myzlema – volatil then
    trend = 1
    elsif close < myzlema + volatil then
    trend = -1
    endif
    if islastbarupdate then
    if trend = 1 and trendy=1 then
    DRAWTEXT(“bullish 5”, -100, -40, dialog, bold, 12) coloured(0, 150, 0) anchor(topright, xshift, yshift)
    else
    DRAWTEXT(“bearish 5”, -100, -40, dialog, bold, 12) coloured(150, 0, 0) anchor(topright, xshift, yshift)
    endif
    endif
    timeframe(15 mn )
    length15 = 70
    mult15 = 1.2
    myzlema15 = ZLEMA[length15](close)
    atr15 = averagetruerange[length15](close)
    volatil15 = highest[length15*3](atr15) * mult15
    once trendy15 = 0
    if close crosses over myzlema15 + volatil15 then
    trendy15=1
    elsif close crosses under myzlema15 – volatil15 then
    trendy15=-1
    endif
    once trend15 = 0
    if close > myzlema15 – volatil15 then
    trend15 = 1
    elsif close < myzlema15 + volatil15 then
    trend15 = -1
    endif
    if islastbarupdate then
    if trend15 = 1 and trendy15=1 then
    DRAWTEXT(“Bullish (15 minutes)”, -100, -60, dialog, bold, 12) coloured(0, 150, 0) anchor(topright, xshift, yshift)
    else
    DRAWTEXT(“Bearish (15 minutes)”, -100, -60, dialog, bold, 12) coloured(150, 0, 0) anchor(topright, xshift, yshift)
    endif
    endif
    timeframe(60 mn)
    length60 = 70
    mult60 = 1.2
    myzlema60 =ZLEMA[length60](close)
    atr60 = averagetruerange[length60](close)
    volatil60 = highest[length60*3](atr60)*mult60
    once trendy60 = 0
    if close crosses over myzlema60 + volatil60 then
    trendy60=1
    elsif close crosses under myzlema60 – volatil60 then
    trendy60=-1
    endif
    once trend60 = 0
    if close> myzlema60-volatil60 then
    trend60 = 1
    elsif close< myzlema60+volatil60 then
    trend60 = -1
    endif
    if islastbarupdate then
    if trend60 = 1 and trendy60=1 then
    DRAWTEXT(“Bullish (1 heure)”, -100, -80, dialog, bold, 12) coloured(0, 150, 0) anchor(topright, xshift, yshift)
    else
    DRAWTEXT(“Bearish (1 heure)”, -100, -80, dialog, bold, 12) coloured(150, 0, 0) anchor(topright, xshift, yshift)
    endif
    endif
    timeframe(240 mn)
    length240 =70
    mult240 = 1.2
    //src=close
    myzlema240 =ZLEMA[length240](close)
    atr240 = averagetruerange[length240](close)
    volatil240 = highest[length240*3](atr240)*mult240
    once trendy240 = 0
    if close crosses over myzlema240 + volatil240 then
    trendy240=1
    elsif close crosses under myzlema240 – volatil240 then
    trendy240=-1
    endif
    once trend240 = 0
    if close > myzlema240 – volatil240 then
    trend240 = 1
    elsif close < myzlema240 + volatil240 then
    trend240 = -1
    endif
    if islastbarupdate then
    if trend240 = 1 and trendy240=1 then
    DRAWTEXT(“Bullish (4 heures)”, -100, -100, dialog, bold, 12) coloured(0, 150, 0) anchor(topright, xshift, yshift)
    else
    DRAWTEXT(“Bearish (4 heures)”, -100, -100, dialog, bold, 12) coloured(150, 0, 0) anchor(topright, xshift, yshift)
    endif
    endif
    timeframe(default)
    return

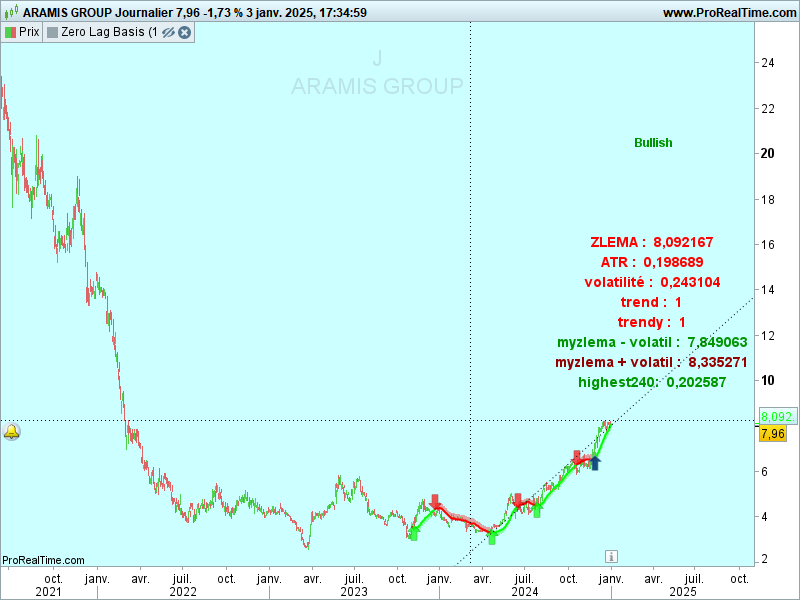
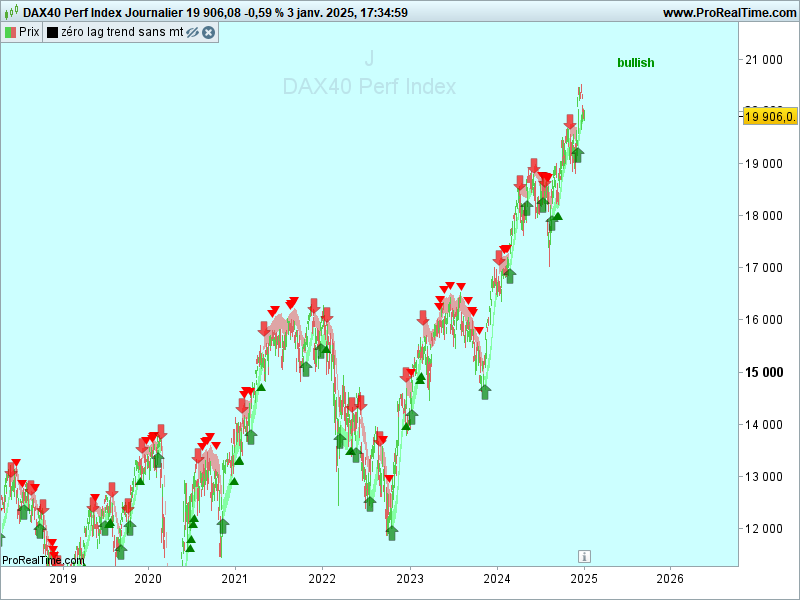
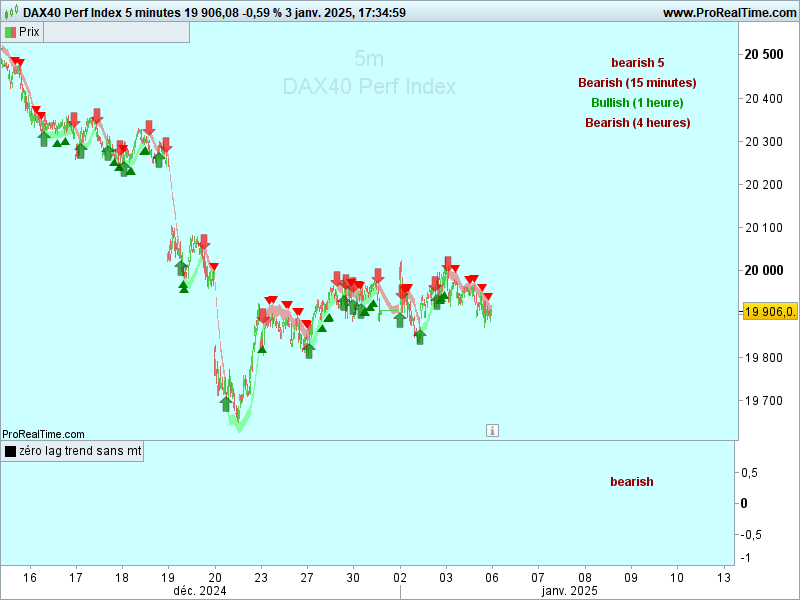
    ARAMI-5-minutes.png ARAMI-5-minutes.png ARAMI-Journalier-1.png ARAMI-Journalier-1.png
    #242184 quote
    jacquesgermainjacquesgermain
    Participant
    Veteran

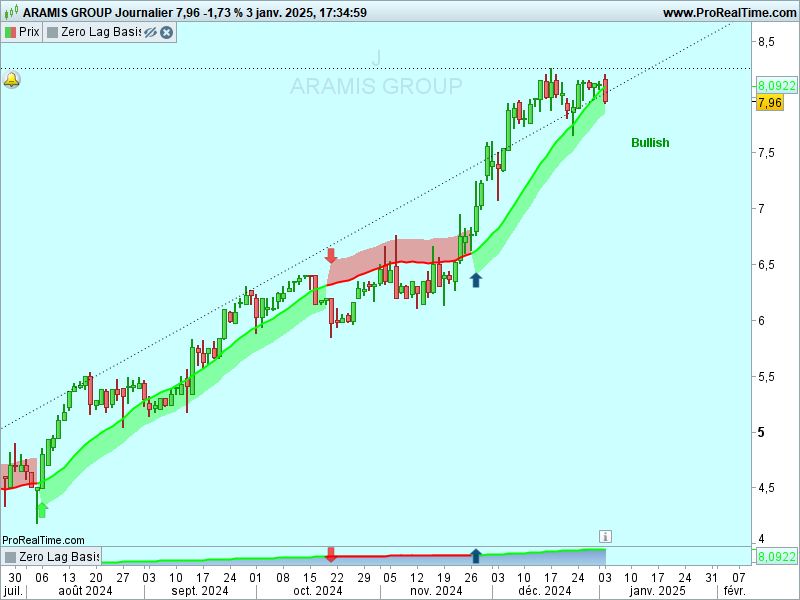
    et voici la dernière révision du zéro lag trend sans multiframe révision jacques germain 05/01/25 :

    //———————-zéro lag trend sans multiframe révision jacques germain 05/01/25—————//
    //—Inputs
    //————————————-//
    length=70
    mult=1.2
    src=close
    //————————————-//
    // Zlema calculation
    //————————————-//
    myzlema = ZLEMA[length](close) //Average[Length](close + (close – close[lag]))
    //————————————-//
    // Volatility calculation
    //————————————-//
    atr=averagetruerange[length](close)
    volatil=highest[length*3](atr)*mult
    //————————————-//
    // Trend condition
    //————————————-//
    once trend=0
    if close crosses over myzlema+volatil then
    trend=1
    r=0
    g=255
    elsif close crosses under myzlema-volatil then
    trend=-1
    r=255
    g=0
    endif
    //————————————-//
    // Signals and colors
    //————————————-//
    if trend=-1 then
    upper=myzlema+volatil
    alpha1=90
    lower=myzlema
    alpha2=0
    if trend<>trend[1] then
    drawarrowdown(barindex,upper+0.25*atr)coloured(r,g,0,175)
    endif
    else
    upper=myzlema
    alpha1=0
    lower=myzlema-volatil
    alpha2=90
    if trend<>trend[1] then
    drawarrowup(barindex,lower-0.25*atr)coloured(r,g,0,175)
    endif
    endif
    // if close crosses over myzlema and trendbis=1 and trendbis[1]=1 then
    //drawtext(“▲”,barindex,myzlema-volatil*1.5)coloured(“green”)
    //elsif close crosses under myzlema and trendbis=-1 and trendbis[1]=-1 then
    //drawtext(“▼”,barindex,myzlema+volatil*1.5)coloured(“red”)
    //endif
    if barindex > 4*length then
    colorbetween(myzlema,upper,r,g,0,alpha1)
    colorbetween(myzlema,lower,r,g,0,alpha2)
    endif
    //————————————-//
    if trend<>trend[1] and momentumUpBias>boundary then
    drawarrowup(barindex,lower-0.25*atr)coloured(0,0,150,175)
    endif

    once trendy = 0
    if close > myzlema – volatil then
    trendy= 1
    elsif close < myzlema+ volatil then
    trendy= -1
    endif
    if islastbarupdate then
    if trend=1 and trendy=1 then
    DRAWTEXT(“Bullish”, -100, -120, dialog, bold, 12) coloured(0, 150, 0) anchor(topright, xshift, yshift)
    else
    DRAWTEXT(“Bearish”, -100, -120, dialog, bold, 12) coloured(150, 0, 0) anchor(topright, xshift, yshift)
    endif
    endif

    return myzlema as “Zero Lag Basis”style(line,2)coloured(r,g,0)

    ARAMI-Jourr.png ARAMI-Jourr.png
    #242191 quote
    jacquesgermainjacquesgermain
    Participant
    Veteran

    dernière version de l’indicateur avec les triangles verts et rouges

    defparam CALCULATEONLASTBARS=10800
    //révision du 05/01/2025 par jacquesgermain
    // PRC_Zero Lag Trend Signals multiframe à lancer en période 5 minutes et 11000 unités
    // Configuration pour le timeframe 5 minutes
    timeframe(5 mn )
    length = 70
    mult = 1.2
    myzlema = ZLEMA[length](close)
    atr = averagetruerange[length](close)
    volatil = highest[length*3](atr)*mult
    once trendy = 0
    if close crosses over myzlema + volatil then
    trendy=1
    r = 0
    g = 255
    elsif close crosses under myzlema – volatil then
    trendy=-1
    r = 255
    g = 0
    endif
    // Affichage des flèches
    if trendy = -1 then
    upper = myzlema + volatil
    alpha1 = 90
    lower = myzlema
    alpha2 = 0
    if trendy <> trendy[1] then
    drawarrowdown(barindex, upper + 0.25 * atr) coloured(r, g, 0, 175)
    endif
    else
    upper = myzlema
    alpha1 = 0
    lower = myzlema-volatil
    alpha2 = 90
    if trendy <> trendy[1] then
    drawarrowup(barindex, lower – 0.25 * atr) coloured(0, 128, 0, 175)
    endif
    endif
    if close crosses over myzlema and trendy = 1 and trendy[1] = 1 then
    drawtext(“▲”, barindex, myzlema – volatil * 1.5) coloured(“green”)
    elsif close crosses under myzlema and trendy = -1 and trendy[1] = -1 then
    drawtext(“▼”, barindex, myzlema + volatil * 1.5) coloured(“red”)
    endif
    if barindex > 4 * length then
    colorbetween(myzlema, upper, r, g, 0, alpha1)
    colorbetween(myzlema, lower, r, g, 0, alpha2)
    endif
    once trendy = 0
    if close crosses over myzlema + volatil then
    trendy=1
    elsif close crosses under myzlema – volatil then
    trendy=-1
    endif
    once trend = 0
    if close > myzlema – volatil then
    trend = 1
    elsif close < myzlema + volatil then
    trend = -1
    endif
    if islastbarupdate then
    if trend = 1 and trendy=1 then
    DRAWTEXT(“bullish 5”, -100, -40, dialog, bold, 12) coloured(0, 150, 0) anchor(topright, xshift, yshift)
    else
    DRAWTEXT(“bearish 5”, -100, -40, dialog, bold, 12) coloured(150, 0, 0) anchor(topright, xshift, yshift)
    endif
    endif

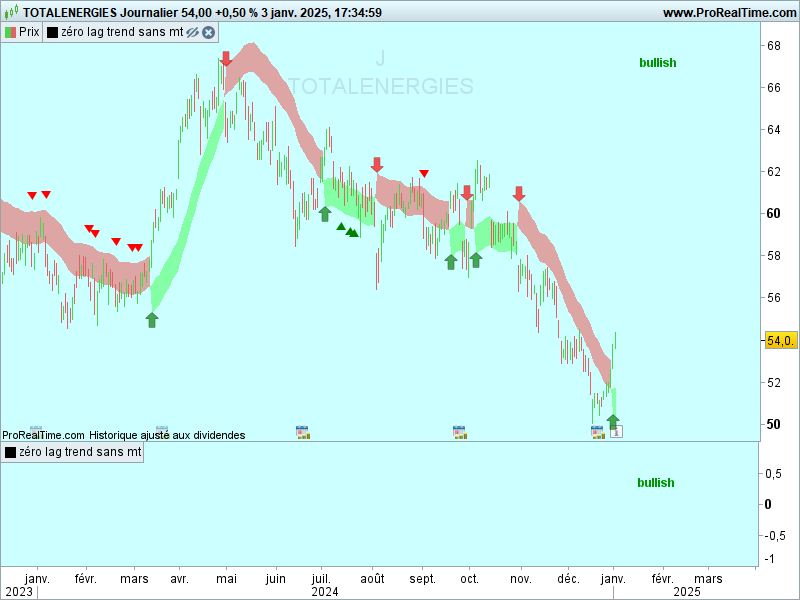
    TTE-Journalier.png TTE-Journalier.png
    #242196 quote
    jacquesgermainjacquesgermain
    Participant
    Veteran

    avec comparaison de ces indices DAX le résultat est correct

    DAX-Journalier.png DAX-Journalier.png DAX-5-minutes.png DAX-5-minutes.png DAX_2025-01-05_15-42-50.png DAX_2025-01-05_15-42-50.png
    #262868 quote
    E Nithi B ChristopherE Nithi B Christopher
    Participant
    New

    It is possible to share chartink filter for zero lag trend signals by Algoalpha having all the values in the table as bullish

Viewing 5 posts - 16 through 20 (of 20 total)
  • You must be logged in to reply to this topic.
ProRealAI ProRealAI New

Stuck on this ProBuilder code?

Describe what this topic is trying to build, in plain English, and ProRealAI writes the ProRealTime™ indicator, screener or system for you.

Available in 7 languages
Try ProRealAI

Zero Lag Trend Signals Indicator by AlgoAlpha


ProBuilder: Indicators & Custom Tools

New Reply
Author
author-avatar
adeelq79 @adeelq79 Participant
Summary

This topic contains 19 replies,
has 8 voices, and was last updated by E Nithi B ChristopherE Nithi B Christopher
1 month, 3 weeks ago.

Topic Details
Forum: ProBuilder: Indicators & Custom Tools
Language: English
Started: 11/13/2024
Status: Active
Attachments: 11 files
ProRealCode ProRealCode
Loading...