Why it is so difficult to create a strategy that works forever

Forums ProRealTime English forum General trading discussions Why it is so difficult to create a strategy that works forever

Viewing 15 posts - 1 through 15 (of 20 total)
  • #106738

    I was doing some analysis to see what effect the size of a bars range compared to an average and its colour had on the outcome of the next candle so I coded two indicators to do this. One returned the percentage of times after a certain size or larger candle that the next candle was red or green and compared it to a datum of every candle. The second indicator returned equity curves for each outcome.

    I decided to test it on the DJI daily chart.

    The first indicator showed that there had clearly been a % of probability benefits of going long after either a red or green candle if it had a true range over a certain size but it was the equity indicator that was of more interest as far as this subject is concerned.

    The image shows the equity curves (without spread) for going long after a bar with a range bigger than the average true range of the last 20 bars.

    We can see that prior to the invention of the computer going long after a green bar with a bigger than average range was the thing to do. Then this slowly stops working after the computer comes along. We then go into a bear market and it definitely stops working but what is interesting is that at the bottom of the bear market suddenly going long on a bigger than average red candle suddenly becomes the thing to do. Our market has transformed from a trending market into a mean reversal market! Then along comes another bear market but our mean reverting market just carries on through it almost as if nothing changed. Perhaps all the computers got more intelligent and the banks had a big previous bear market after a trending market to use as an example and they decided that trending markets were dangerous and buying on dips was a safer thing to do perhaps.

    Anyway the point is that markets can change and have changed so if we are trying to create a strategy that has worked though out all of history then we are trying to achieve the impossible. If we are out of sample testing a strategy on a sample of history when the market was a totally different market then our tests are pointless.

    If this is just the daily chart then imagine how complicated it gets if we try to get something to work on faster time frame charts that are probably regularly changing their market structure.

    At the moment going long on big range red candles is still working on the DJI but for how long? Will it change tomorrow or maybe it will never change and the DJI will be a mean reverting market for ever more. We just can’t know so all we can do is do what has most recently worked and keep our fingers crossed. It is called ‘betting’ the market for a reason!

    So all this I think is why it is impossible to get a strategy to work forever. Throw in curve fitting and data mining on top and then throw in big spreads and we are really up against it.


    5 users thanked author for this post.
    #106741

    Extending the test out a little further we can see that if a bars true range is greater than 1.5 times the average range of the last 20 bars then as a mean reversal strategy it has been working since around when  computers started to be used for trading. It has been a rather bumpy ride but profitable all the same (if no spread). The conclusion then is that on the DJI daily the bigger a range is the more likely you will be to make profit going long on the next bar.

    #107036

    Until you can input Trumps tweets or decipher Powells ramble onto an automatic strategy any attempt is futile in my opinion, not to mention the “market makers” know what everyone is trading, stop loss positions etc

    #107171

    I wanna insert my own 2 cents into this.

    Since forever, there has been one or more major events going on in the world. Some of these events cause financial meltdowns and bear markets, some of these events create short-term chaos, high volatility, low volatility and everything in between, short, medium, long term.

    I think that you cant really say that “Trump tweets” or “Brexit”, or FED meetings or really whatever it is that your looking at actually matters when creating systems. There will always be crazy things you cant expect or obvious crazy things that gives you the opposite effect of what you thought.

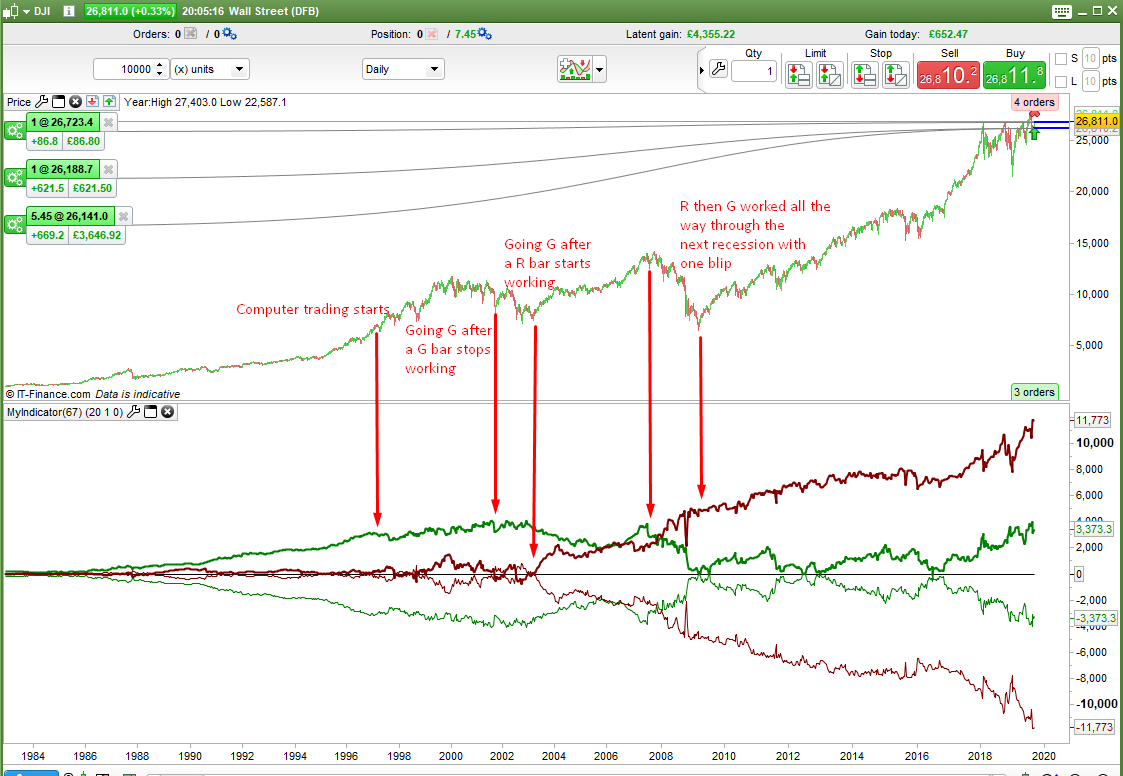
    I honestly only belive in numbers and maths and statistics when creating systems. I know there will be a rough bear market some time in the future, maybe in 2 months or maybe in 2 years, maybe in 20 years… who knows.. The only thing i know is that whenever “it” happens, my systems will only react to whats going on with the price, not whats going on with a spesific country or decision. If price falls, i wanna be short or no trades. When price is rising i wanna be Long. This is the truth that i trade on. Creating systems only to shut them off because of X, Y and/or Z is a fallacy in my opinion. You cant predict the outcome of an event, if you could you’d be all in and rich after the event happens.

    You could make the argument that an event will create volatility, but if your systems cannot handle a volatile market then its not a very good system. Of course a system might underperform during high volatile times, but thats to be expected. A system might also see its all time best trade during these volatile times, so its best to have the system activated at all times, just make sure you can backtest it thru some volatile times and make sure its not going to go bust.


    The only true thing that has changed and will continue to change, are the ranges of the bars, and if you have like ” 50 pip stop loss” when an index is at 10.000 its not going to work as well when the market is at 20.000 and your numbers might need to be revisited. That being said the core of the system (depending on how the system works obviously, if range is a big part of it, its gonna need changes) should not be changed because of the bars range.


    These are of course only based on my experience and thoughts.


    Edit: also wanna add couple of cents on the “market movers know where your stop loss is”: yea,. no shit, i think 9/10 people can point on a chart and say where the majority of stop losses will be for any given trade, because they would all place the stop loss at the same area there as well. Just a little bit under/over the last high/low.. For me, when i optimize stop losses and trailing stops, i find that my stops are now placed (by the systems) more or less “a little bit under the recent support/resistance/highs/lows. But with a couple of extra pips. This has been optimized. Some times these stops are juuuust right, price might drop to 49 pips and my stop is at 50 and then price reverses. Some times the price will drop to 51 pips and my stop will be 50, then price reverses.

    In the majority of my trades however, my stop loss placement is not what makes or breaks my trades. Its usually either a clear winning trade or a loosing trade in the majority of trades.

    I think alot of people (me included in the past) get into this conspiracy thinking of “they know, they just want my money then price is going to reverse. it happens every time!” And yea, it does happen here and there, but in my opinion, its just you and your systems “not doing it right”.. My early days of trading was a stop loss massacre, done over 1000 trades systematic now tho, and stop loss is basicly just a “Oh im on the wrong side of this trade, lets get out” rather than before when it was more “omg price is 5 pips away from my stop loss, maybe i should move it/do something” and it dosnt really matter if you move your stop or not, its most likely going to end up bad and your going to feel bad about it and its very easy to blame “the market movers” who are indeed real and hunting for stop losses.


    3 users thanked author for this post.
    #107176

    My 2p worth!

    It really does not matter where you or I think the obvious stop loss levels are at because the banks know exactly where all the actual stop losses are at – especially on Forex. They can see all the orders on the market and decide whether to take them or leave them. If there is a whole bunch of orders at x price then the banks can take the few orders between where they are now and x price and then gobble up all the orders at x price. When they are all gone they just start taking orders back the way they just came to gobble up the orders at the next place where a whole bunch of orders are. They are just buying and selling and making a profit either way – in GBP one way and USD the other way or whatever forex they are trading. Sometimes they might even influence a market to make it look like it is breaking out in one direction just to get a whole new bunch of stop loss orders set in the opposite direction. Then when there are enough orders they reverse the market by absorbing all the orders between where they are and where all the stop loss orders are and gobble them up.

    We do not have the info the banks have so we must just try to think like banks and do the opposite of what we think we should be doing if we were thinking like Joe Bloggs retail trader. The banks trading style is why most forex markets are mean reversing markets and trading a breakout expecting a trend is not a good idea. Big markets such as the DJI and SP500 are mean reversing markets in reality for exactly the same reasons – even if those big long up and down trends make you think otherwise.

    1 user thanked author for this post.
    #111536

    Thanks to all for sharing insight and stimulating discussion on a subject that is central to finding edge in the market! My own philosophy is relatively simple. Market prices are a tug of war between fear and greed. These two human traits give rise to price patterns that are exploitable for profit, such as momentum/trend-following and mean reversion. These two effects are present in varying degrees in most markets and timeframes. The trick to finding sustainable edge is how to identify when one regime dominates the other. We are all merely trying to define conditions where one condition dominates the other and then trying to harvest as much available alpha as possible during that regime before it switches back or until harvesting becomes unprofitable due to noise. Noise is such an important phenomenon, at least in intraday patterns, that I focus on. So we also need to filter for when noise dominates. If we can consistently identify times when one of the harvestable effects dominate the other (and noise), we have taken the first step towards profitability.

    What banks are doing is merely (trying to) exploiting the knowledge of customer flows large enough to move markets together with knowledge of resting retail order levels. Btw these levels are now publicly available through eg positioning data shared by eg. Oanda.

    #184376

    it is impossible to get a strategy to work forever

    I totally agree, In fact it seems to me any strategy opening buying orders during a uptrend (opening selling orders during a downtrend) will be failed, the same to be expected during range. On the oppositte,  quite”any” strategy opening buying order during a uptrend (opening selling orders during a downtrend) will resut in profits. So the main point for me in any estrategy It should be to ensured wether we have properly detected one real solid and profitable trend and when it’s becoming to be exhausted,  better than focusing on the particular trigger we choose to open/close our positions inside this trend. [In order just buying in solid uptrends, just selling in solid downtrends]. So the main problem should be how can we define one really solid profitable trend? as we programming ProOrders instructions to create any profitable strategy.  Don’t you think so?

    #208981
    Maz

    This topic question made me smile

    Financial markets are complex and chaotic systems that mutate – they are the very embodiment of fluidity. They do exhibit recurring patterns, similar to weather patterns, but these patterns can change gradually or abruptly over time due to shifts in market participants and their behaviors and reactions. It is not appropriate to apply constants upon and expect a constant outcome from complex chaotic systems, as this is like trying to fit a straight line into a curve.

    To discover a strategy that lasts longer, one shold first look beyond charts and study human behavior. Another point is that any long lasting strategy should refrain from embodying commonnly used algorithms whose effectivness comes and goes in waves) It is also crucial to acknowledge that being a retail trader in the algo trading world puts you at a disadvantage, as you will have limited access to information and the worst quotes in the business.

    Understanding behavior, anticipating and reacting to market shifts are the keys to successful trading. Adapting strategies accordingly, is crucial for traders who aim for consistent profits. Additionally the rate of mutation is ever increasing as the availability of infomration by man and machine increases through technology. Where are a strategy may last for months or years, several decades ago, it will be effective for only weeks today.

    If you subscribe to the idea that “fear and greed” are a constant and that “human behaviour has not shifted significantly in the last 100 years”, these are your best starting points for decyhering longer lasting strategy. But such constants are observable mostly in the macro view (think longer time horizons, less trades). Traders here obviously want to see many transactions a day making them a consistent profit – something that isn’t really realistic on a retail platform.

    Further reading:
    – Strategy adaption (strategies become less effective with wider use)
    – Chaos theory
    – Curve fitting and (over)-optimization
    – Business cycles
    – Boom/Bust cycles
    – Volatility shifts / predicting volatility


    2 users thanked author for this post.
    #208986

    A very best post …

    #209022

    first look beyond charts and study human behavior

    This is what Technical Analysis Patterns were made for in the first hand, to simplify chart reading by gathering the investors behavior in the price.

    For examples: a symmetrical triangle means that there is  the same proportion of buyers and sellers, a ascending triangle means that there are fewer and fewer buyers.. etc.

    In this type of representation, we don’t care about the time or the price, only the behavior of the market participants are visible, via geometric shapes.
    To this has been added various other forms of analysis such as harmonic patterns for instance.

    3 users thanked author for this post.
    #209023

    Skynet AS We found this to be an interesting topic to which we don't have much to add. Sometimes users have asked us for backtests of 1M bars. We have repeatedly explained that such a long-term backtest is absolutely useless, but some still do not understand it. In fact, we've always suggested that between the years 2018-2019 "something" happened, and the markets since then have behaved differently, and that's just one example of anything we could discuss . Cheers!

    #209036

    Interesting indicators by Vonasi , just one comment : Computer trading started much earlier than 1997 (like he assumes in the first and second post). In fact one of the alleged reasons for the crash of 87 was the computer trading getting out of control and selling at once at that time. Great post anyway!

    #209134

    This would have to be the best thread ever for retail algo traders. Thanks.

    I only have 6 months live experience on lower time frames for algos but it’s given amazing insight to my manual trading. Profitable still since day once but not the way I’d like to put size on. Way way too soon.

    For sure the first thing I learnt building them was identifying indices that favour trend vs mean reverting. That’s a good first lesson.

    Second main thing I learnt was yes, absolutely make money long in a downtrend and short in an uptrend was overwhelmingly the case!

    Third is that cluster wins and cluster losses happen waaay more often that I’d anticipated. Gee they are no fun, even the wins because you now know you are statistically due for a draw down. Which takes me to now…

    The current lesson I have shoved in my face is the reason this thread was created in the first place! As I don’t have the live sample size to make the decisions to turn things off prematurely, I am forced to look at this through MTF higher trend filters. This turns things on/off to not over trade (must be a common approach I would think).

    Moving forward I will run all 30 strategies though a 4hr/daily DPO price cycle filter that I use as part of my breadth analysis for intraday swing and scalping bias. See what comes here.

    All this said, yep human emotions are a constant but my early bird experience says we need to build intelligent systems that self optimise at least mildly (eg. vol over 20wma) but seems more about range and price cycles so using % based indicators should keep us in favour for long enough to buy time to adapt.

    Profitable algos are not free money!

    Keep it coming this is an important open topic.

    #209135

    identifying indices that favour trend vs mean reverting.

    Any examples? Not doubting, just interested! 🙂

    make money long in a downtrend and short in an uptrend was overwhelmingly the case

    Wow, that seems counter-intuitive as most say ‘Trade the Trend’?

    PS

    (If we keep this up we may even coax Vonasi ‘out of hiding’ … he’s not been seen in these parts for 12 months or so, or is it longer?) 

    1 user thanked author for this post.
    #209136

    Just to be clear, it is very important when reading somebodies posts to know what time frame they operate from to understand their perspective. I just took a ‘forever’ title and dwindled it to a 1 min perspective. But just because I trade a 1 min strategy doesn’t mean the trades run 10 times a day. Sometimes just twice per month, hence my sample size issue for decision making.

    Surely as retailers the  best chance we have is to produce A+B strategy combos to balance drawdowns and the end result becomes our edge? Doesn’t necessarily mean Long/Short. Could be mixed TF’s etc.

    Is the whole point not to create a portfolio Meta system that rides the ebbs and flows?

    I don’t agree it can’t be done. That is a very limiting paradigm to have. Some people think day traders don’t make money and I know that’s not true. If you don’t make money you’re doin it wrong.

    Same goes for benchmark performance. One has to set a benchmark, usually index returns. But who here is trying to beat 10%? Really. We do this looking for 1000% being the carrot in front of the donkey surely?

    The real and only benchmark that matters is our own performance in any case. After all, trading is us versus ourselves and the market is just a vehicle to facilitate that be it auto or otherwise.

    2 users thanked author for this post.
Viewing 15 posts - 1 through 15 (of 20 total)

Create your free account now and post your request to benefit from the help of the community
Register or Login