I coded a simple strategy on the daily chart that buys or sells and then closes the position at the next open. All was looking good so I thought that I would just try a simple bit of position sizing adjustment to see how it effected performance. Quite simply if the day is a winning day then position size is the maximum allowed but if it is a losing day then position size is reduced by 1 down to a minimum of 1.
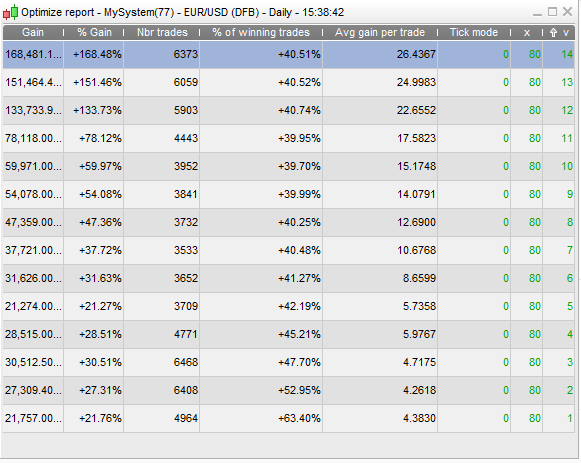
All very simple but when I tested it suddenly I get a totally different number of trades and win rate depending on what the maximum allowed position size is. The trade count and win rate should not change as nothing but position size is different in the strategy! The first image is the results with a max starting position size from 1 to 14.
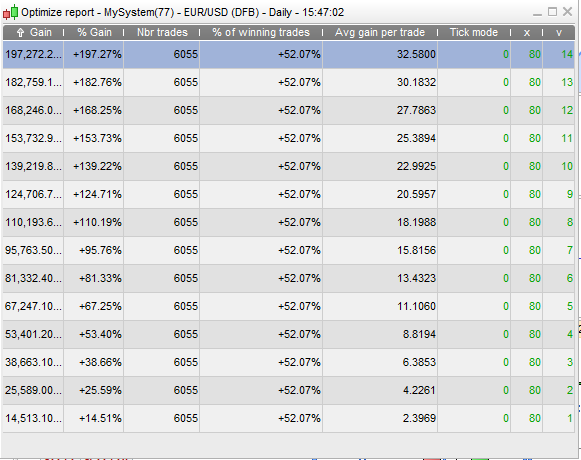
So then I thought I’d throw in a DEFPARAM CUMULATEORDERS = FALSE and this fixed the problem but created another which has been highlighted before as it only allows trades in the same direction on every other day. Second image is the results table for that.
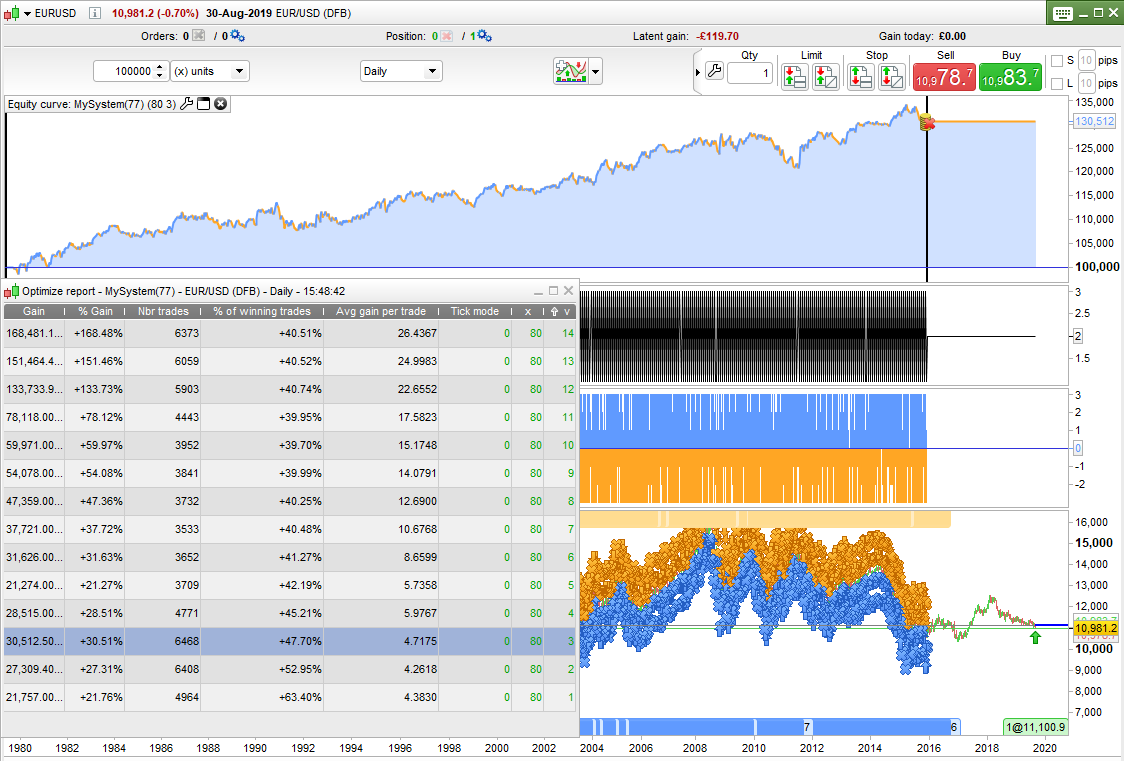
So I went back to the first results and started looking at the charts and found that on anything above a maximum position size of 2 the equity curve was showing the strategy as having run out of money. How can it have run out of money having won so much and starting with a capital of 100k and having a maximum position size of only 3 at any time? It would seem to me that the back test is thinking that it has more positions open than it actually does. See third image.
Or am I missing something?
Here is the code but I have removed my ‘secret indicator’ – just replace it in line 24 with one of your choice. It simply has to be something that is rising or falling!
//defparam cumulateorders = false

x = 80
positionsizing = 1 //positionsizing on or off

if positionsizing then
once ps = v

//return to maximum stake if a win
if longonmarket and positionperf > positionperf(1) or shortonmarket and positionperf > positionperf(1) then
ps = v //reset to maximum size
endif

//reduce stake by 1 if a loss
if longonmarket and positionperf < positionperf(1) or shortonmarket and positionperf < positionperf(1) then
ps = max(1,ps - 1)//reduce stake size by 1 down to minimum 1
endif
else
ps = 1//level stakes
endif

if barindex >= x then
indicator = (rising or falling indicator of your choice)

red = close < open
green = close > open

indicatorup = indicator > indicator[1] and green
indicatordown = indicator < indicator[1] and red

//close all trades at start of day
if onmarket then
sell at market
exitshort at market
endif

//long entry
if indicatordown then
buy ps contract at market
endif

//short entry
if indicatorup then
sellshort ps contract at market
endif
endif

//graph ps
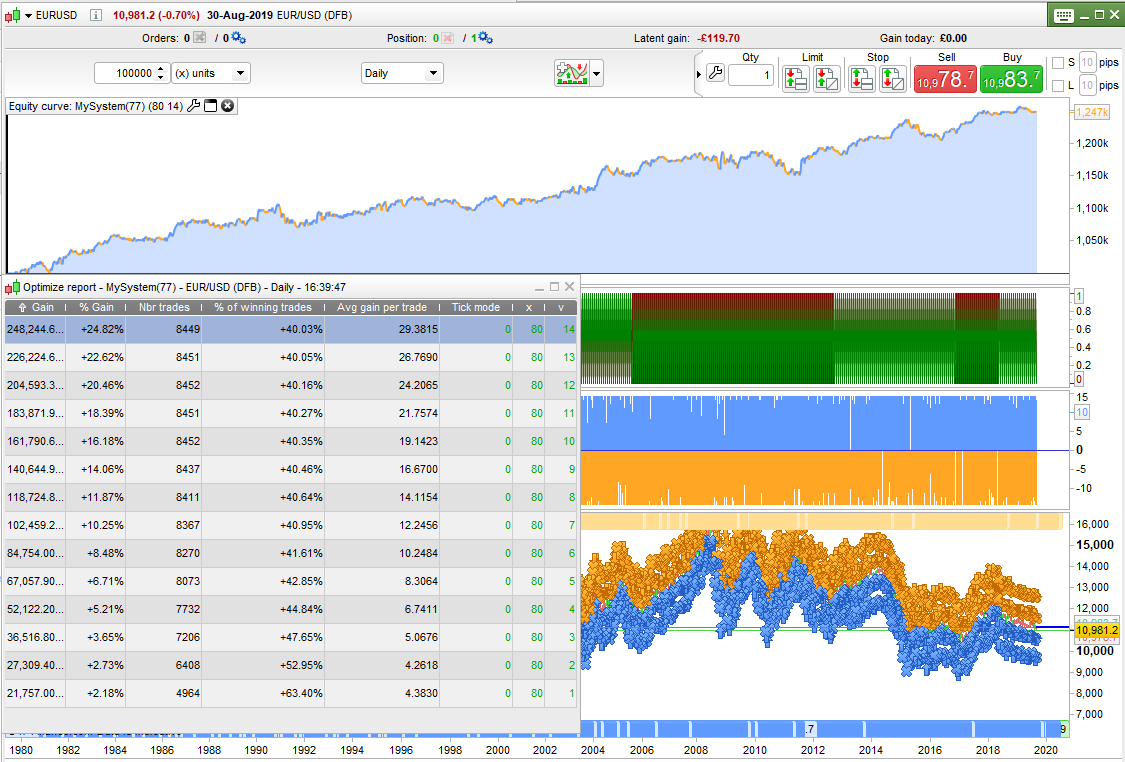
If I increase my starting capital to 1000000 then I can get all optimisation tests to run through with out running out of money. It seems like the back test thinks it has positions on the market that it doesn’t when it comes to calculating available equity. A possible bug?
I still don’t understand the trade count and win rate difference.
Mmm sounds worrying and as you say maybe another bug that had never shown itself due to not all conditions having been exhaustively tested.
PRT would do well to get you on their UAT Team Vonasi … even if they only paid you with … mmm?? 🙂
How to make a million by trading – get paid a dollar for every bug you find!
Jokes aside I think the reason for the different number of trades is that the back tests counts a change of position as a trade so if I place a 14 point bet and then conditions are still true but I am down then the strategy says sell 14 and buy 13 but in reality it sells 1 and calls it a trade. If however that happens thirteen times in a row then it says sell 1 and buy 1 but in reality does nothing and so that is not a trade. If you start with a max position of 2 then you get a lot more 1 to 1 non trades and a lot less 3 to 2 and 2 to 1 actual trades.
I think that somewhere some of the trades are not getting closed out in the ‘you’ve gone bust’ calculation.
Topic moved to the Platform forum as I think this is now more of a platform issue rather than a ProOrder coding issue.
I just had a news about this, the problem is identified and should be quickly fixed (just wait for the next patch).
I dont know if it’s because of your birthday Vonasi, but this weird problem is now fixed in the actual version of the indicator 🙂