A request from someone yesterday for a bit of code to avoid trading in the first two weeks of the year got me thinking about seasonality again – so I wrote a strategy that when applied to a weekly chart worked out which week number it was and then calculated what the profit and loss would be for that week number if every year you bought a position at the beginning of the week and then did any of the following:
- Just closed the position at the end of the week.
- Closed the position if the weeks close was higher than the previous weeks high.
- Closed the position if the weeks close was higher than the previous weeks high or the weeks close was higher than the position price.
Here is the code:
[attachment file=”Weekly analysis Long.itf”]
//WeekNumber = 1 //Set from 1 to 52 to test that number week.
JustClose = 0 //Set to 1 for close at end of week
High1 = 0 //Set to 1 to close if close > high[1]
PosPriceAndHigh1 = 1 //Set to 1 to close if close > high[1] or close > positionprice

if openyear > openyear[1] then
wk = 0
endif

wk = wk + 1

if JustClose and onmarket then
sell at market
endif

if high1 and onmarket and close > high[1] then
sell at market
endif

if PosPriceAndHigh1 and onmarket and (close > positionprice or close > high[1]) then
sell at market
endif

if wk = weeknumber then
buy 1 contract at market
endif
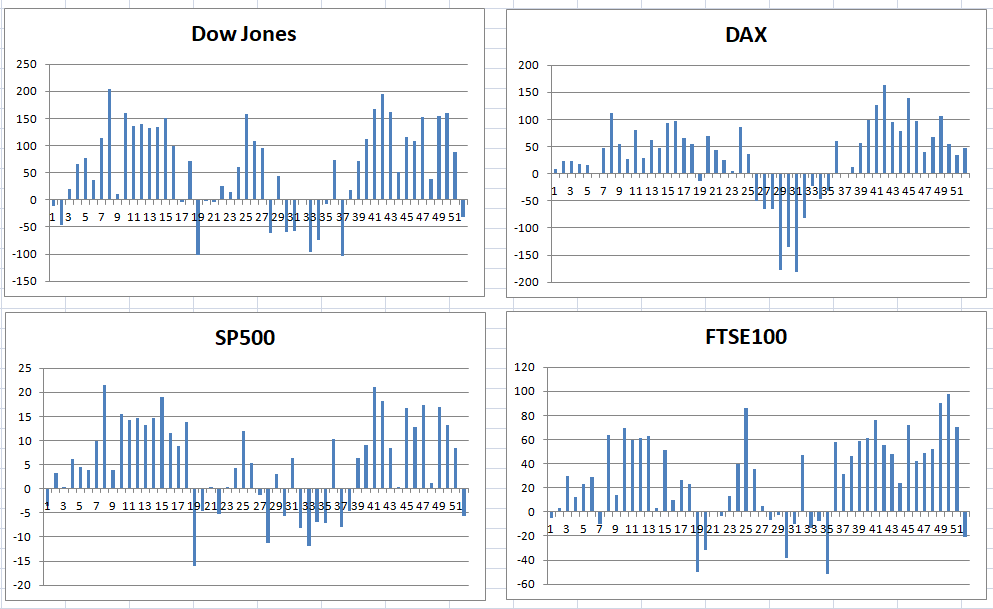
I tested four major markets from the start of 1995 to the present day. The results were quite interesting with some weeks showing very lovely equity curves and others not so nice. I then plotted as charts the results of the trades closed if close > high[1] or close > positionprice to see whether the good and bad weeks were evenly distributed or whether there was any sort of seasonality that would show periods of the year that were better times to be going long or better times to avoid the market. I used spreads matching what you would currently get if opening trades at end of week – so pretty big spreads. The results I think speak for themselves:
[attachment file=84422]
It seems that avoiding summer trading as per the old sell in May and go away theory when going long the major indices might actually have some merit.
If I can find time then I may try to code something that provides a rolling indication of only the most recent years as I feel that this used as a filter may have some merit to improve a strategy.
 Leo
LeoParticipant
Veteran
That sort of analysis makes me think about how can we implement machine learning technics.
That sort of analysis makes me think about how can we implement machine learning technics.
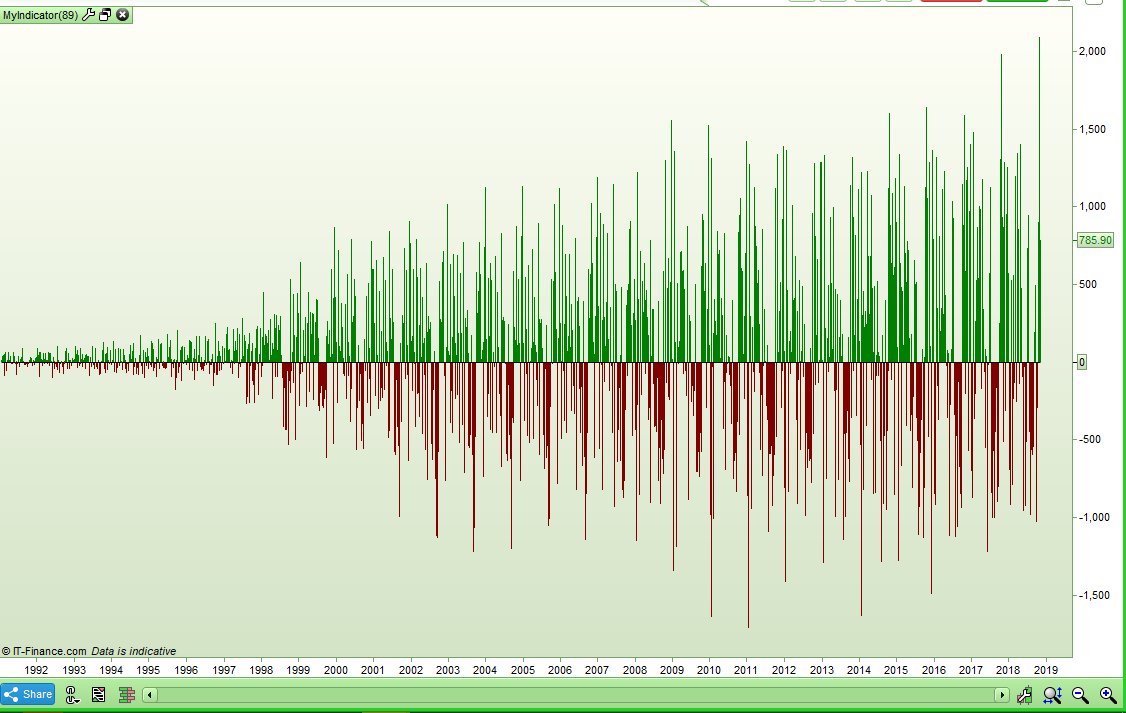
At the moment I am working on a rolling look back period weekly equity and the code is very long and repetitive without arrays. The results look promising and I think it would be interesting to base a strategy on the results – especially if the results of many different look back periods are compared. This would hopefully take the data mining aspect out of seasonality and give us some way to predict the higher probability of an up week. I fear the code would be massive without arrays though as just to calculate the rolling last 20 years is 1367 lines of code!
Here is the first test of my indicator with a 20 year look back period on the DAX:
[attachment file=84437]
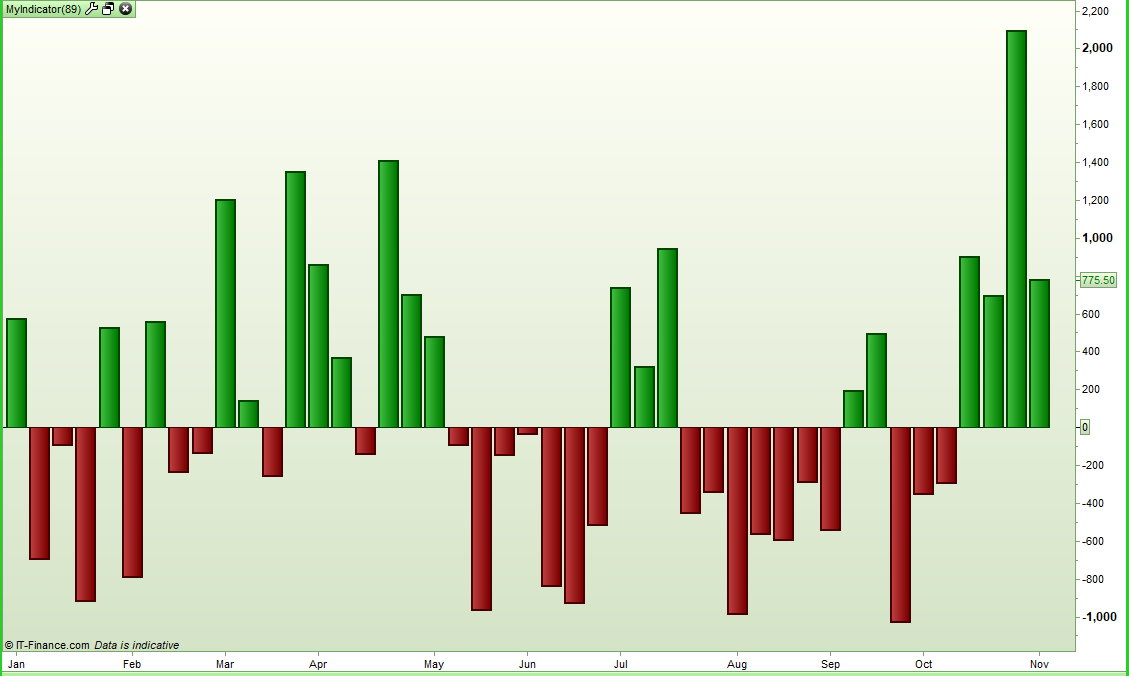
..and zoomed in on the latest results for 2018:
[attachment file=84438]
LeoParticipant
Veteran
Great job Vonasi, thanks for sharing it.
how to extract the relevant info from that data and how to predict next week?
Great job Vonasi, thanks for sharing it.
how to extract the relevant info from that data and how to predict next week?
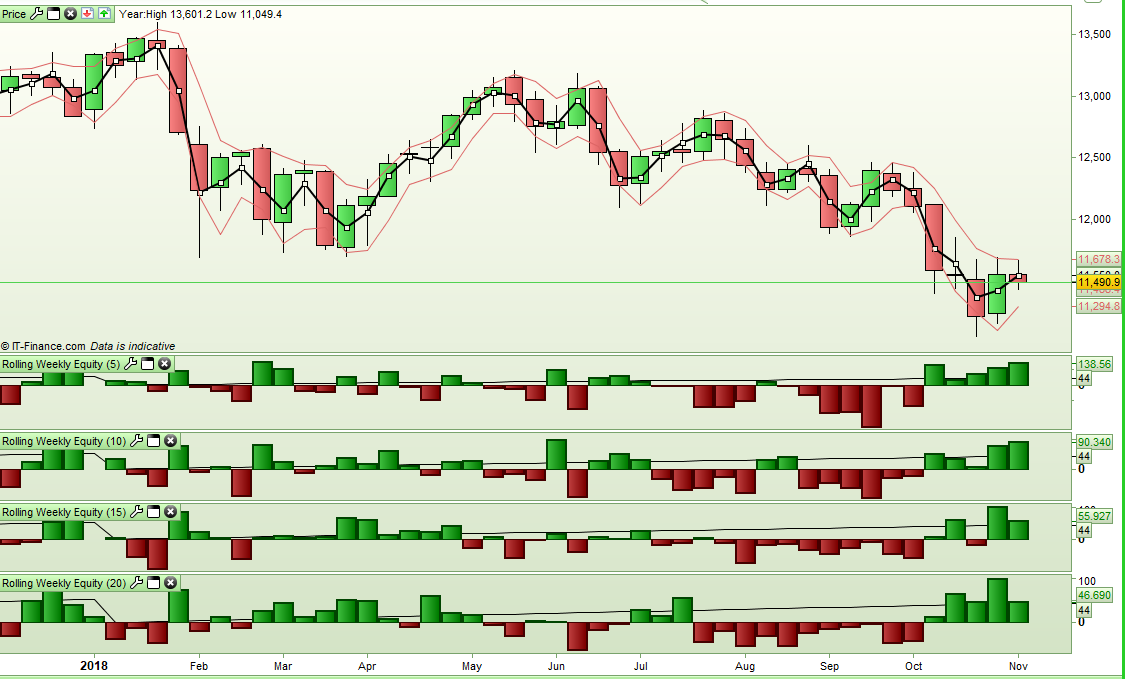
That is the 24 million dollar question. Last night I adapted the code so that it could draw histograms for rolling weekly equity for look back periods of 5, 10, 15 and 20 years. The results are shown as average gain per week.
[attachment file=84462]
At the moment this is all just an idea with no certain direction of how the information should be analysed. I hope to do rolling periods of 20, 19, 18, 17 all the way down to 1 and then maybe give weight to each years result depending on age. My ultimate intention is to turn it into both a strategy to test and a filter to apply to current strategies to see if it improves them.
At the moment I guess the simple analysis is that if the rolling 5, 10, 15 and 20 year look backs are all positive then it has historically been a very good time to go long and the more recent shorter look back periods results can be used to confirm whether this is a reducing seasonality effect or not.
In the image shown the histogram bar is shown directly under the candle of the week it represents. Fine for intraday traders but it will need shifting left if someone wants to know this week what the analysis of next week is.
Hopefully I will post something in the indicator library when I am done with it.
LeoParticipant
Veteran
Hi Vonasi.
Today I publicade my code for the Neural Network.
You can only choose 4 variable to learn from.
If you change the classifier to spot long or short months with a long movement. And chose 4 variable like: Distance to SMA 20 periods or RSI or Stochastics.
Then the neural network learns from that data and we can extract a relevance information.
Hope in awakes your interest.
Cheers
LeoParticipant
Veteran
Hi,
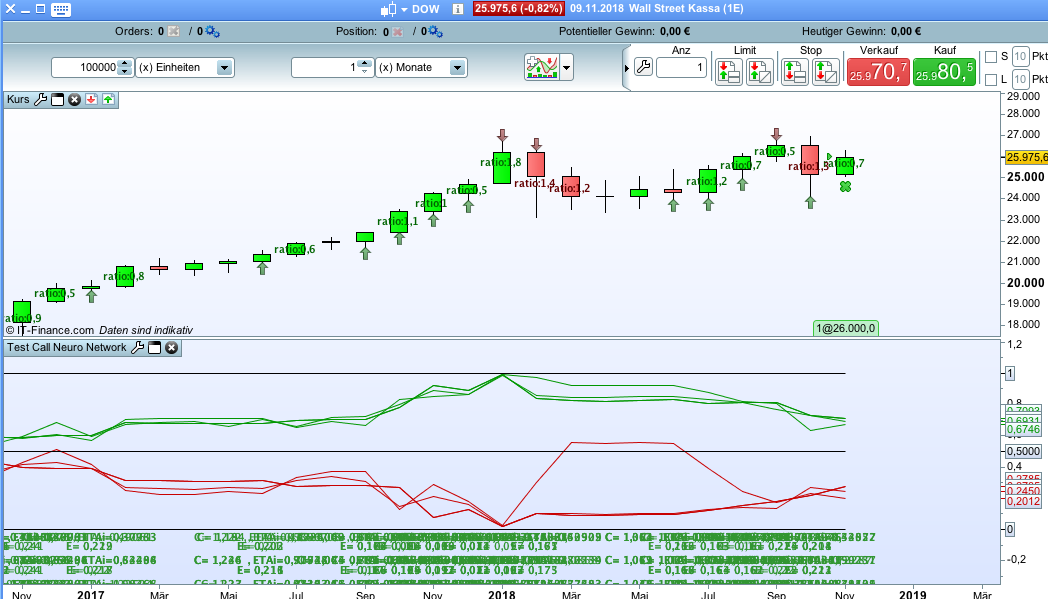
I customise a Neural Network for monthly data
- Clasiffier is very simple, If the body of the candle is longer that a average of an average (an so one) of the range.
- The set of parameter to be chosen. What I think is important for predict the next month
- Due to the lack of bars it is very hard to learn ( until we fix the memory loop problem)
- Classifier indicator is for loaded with the price graph, the Network is for loaded separately
Hope you like it, found it useful and find a way to improve it.
Hello Leo, really excellent (neural network sesonality v1.0)
Very good result for short term trading
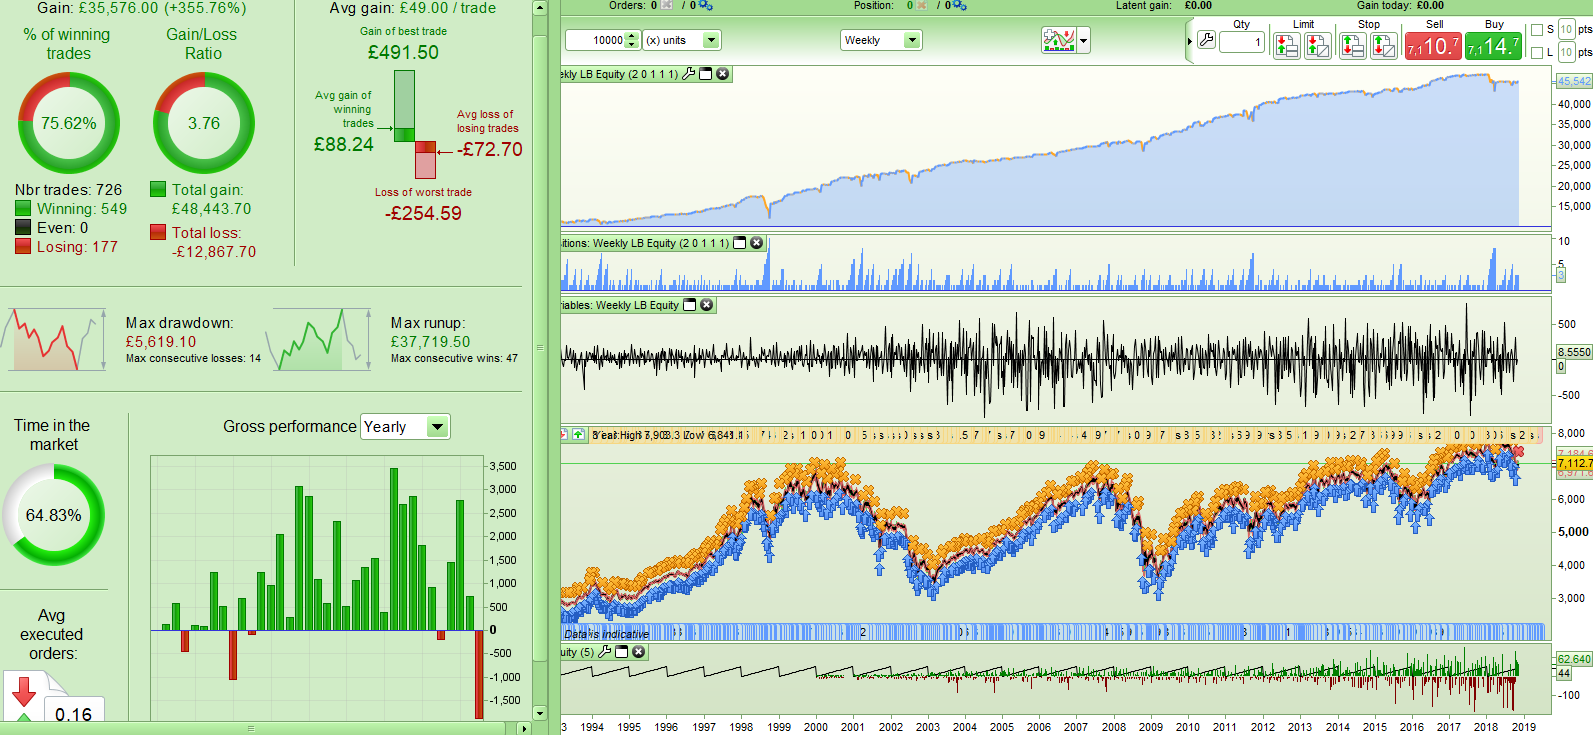
I coded a little 2463 line strategy that analysed the market and kept a record of whether holding each week over a 20, 15, 10 and 5 year rolling periods was profitable. I then ran various tests on various markets with various filters such as only buying if close > low[51], averaging down, buying if 20, 15 ,10, and 5 years look backs were all profitable, combining each years returns and only entering if the result was above zero, giving weight to different look back periods etc etc. It seems that simple is best and that was confirmed across a variety of markets. Below is the results for the FTSE100 when only buying at the end of a week if the following week had been profitable in 20, 15, 10 and 5 year rolling look back periods and then selling if the close was greater than position price or the last weeks high.
Spread = 5
[attachment file=84642]
So far in back test it has been my most consistent strategy to date across a variety of markets but still I have to question the fact that on the FTSE100 the performance this year has been really bad. This has been a weird year on all markets so it kind of highlights the fact that we are curve fitting to the past and the future markets have no interest in the past.
LeoParticipant
Veteran
Interesting analisys Vonasi, thanks.
Meanwhile I test if it is possible use the function call for the neural network I posted here… and it works.
What I have done is an indicator calling the different set of variables for learning.
I’ve not had much time to play with my weekly seasonality analysis today but I thought I would post this as it seems to be a good example of a simple analysis of seasonality that appears to give seasonality as a filter some merit.
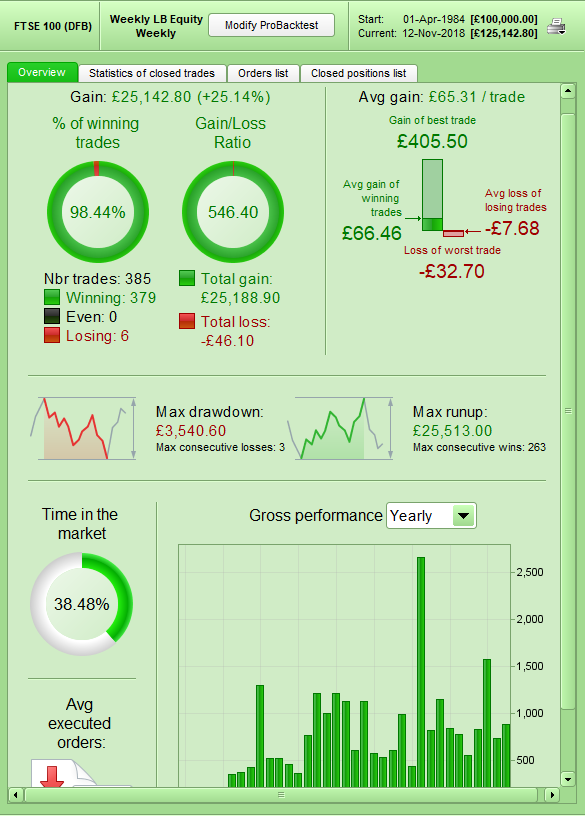
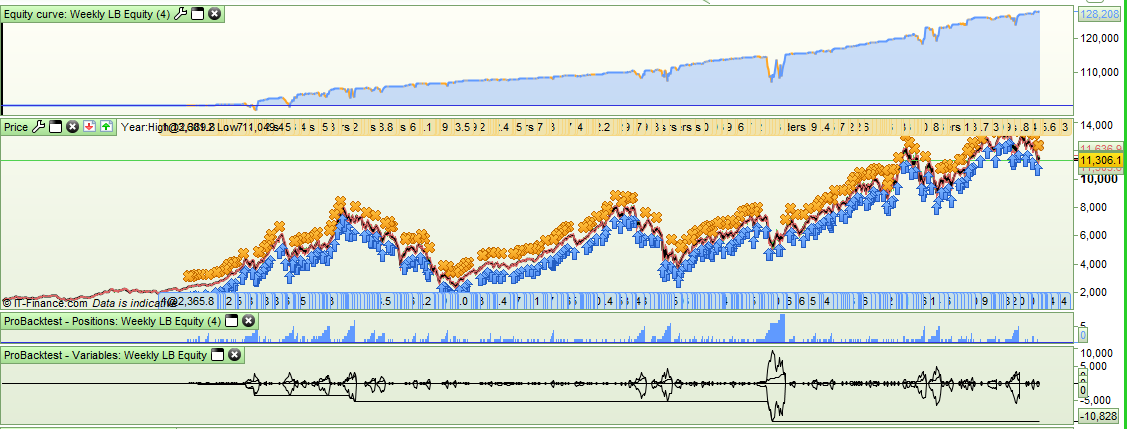
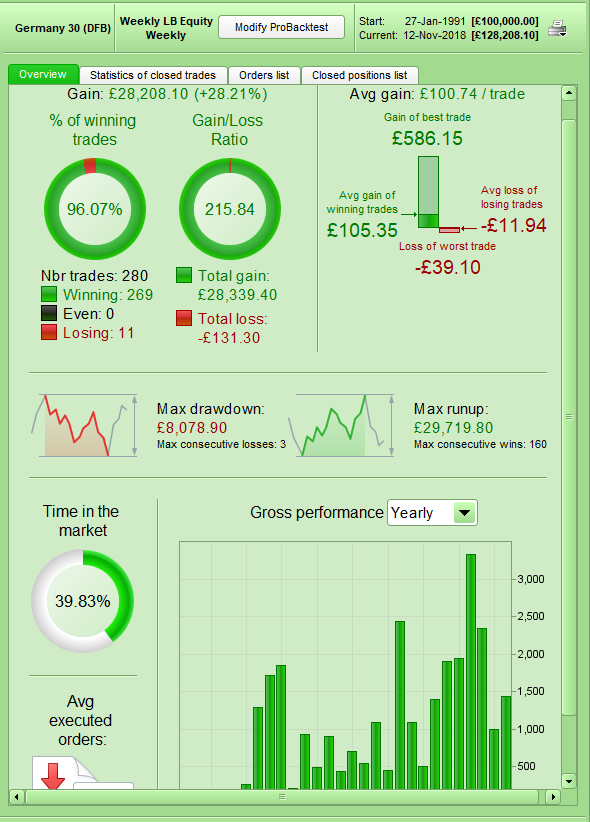
The following image is a strategy that buys the FTSE100 if the rolling 20, 15, 10 and 5 year total equity look back periods for any week have all been positive. It then simply sells if the total position at the end of any week is in profit. So basically buy at the start of weeks that have historically been profitable and hold and take a profit if there ever is one.
I chose the FTSE100 because it is not a market that I have ever had much luck writing strategies for – so a tough test.
[attachment file=84724]
The interesting thing for me is the fact that equity has been increasing at a steady rate even in the major downturns. There have been none of the usual averaging down catching a falling knife scenarios that you would expect with a strategy that keeps buying until a profit is hit.
The graphed line shows margin and the maximum required at the current (ridiculous) rates of 5% would have been a maximum of £5065 and the maximum draw down would have been £3540 with a position size of 1 and a spread of 4.
[attachment file=84725]
Possibly it is still curve fitted hell but initial impressions are positive.
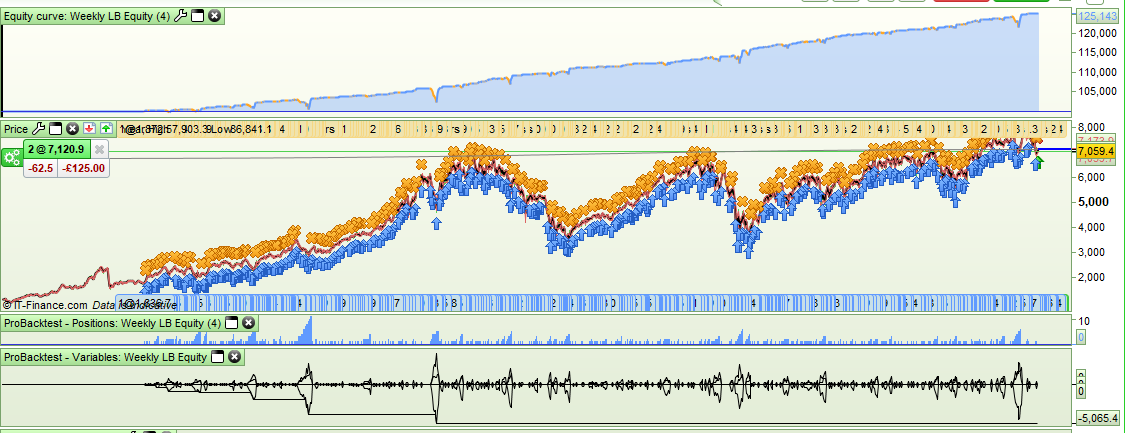
The same strategy on the DAX with a spread of 5. Bigger margin and bigger draw down but still interesting to see the relatively good performance during the major market corrections.
[attachment file=84728]
[attachment file=84729]
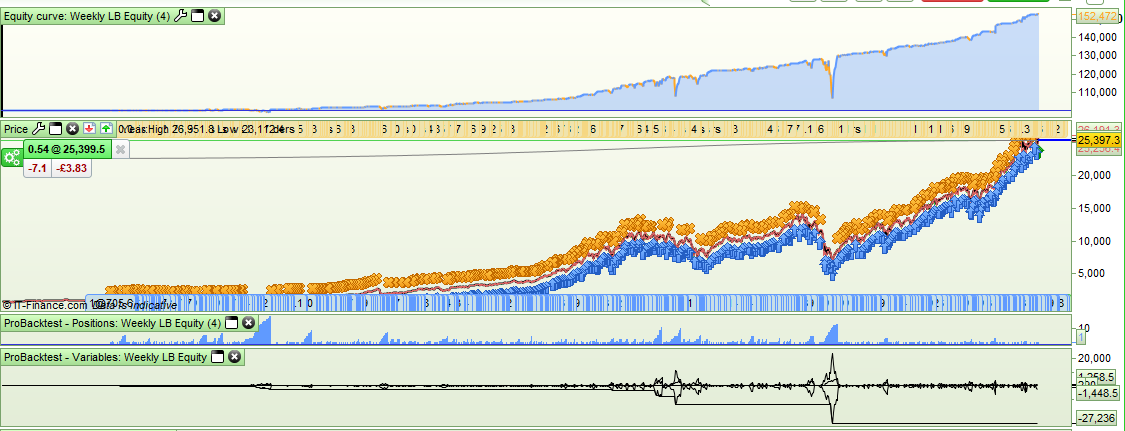
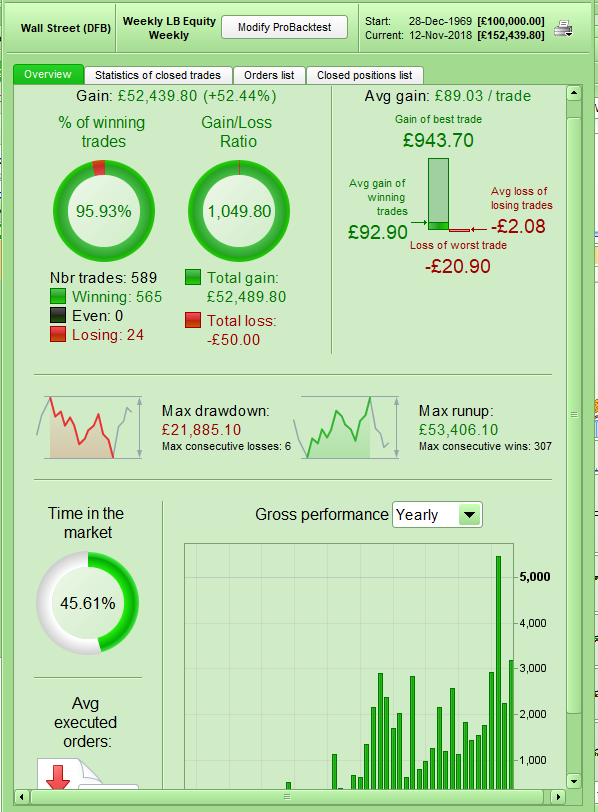
…and on the DJI with a spread of 3.8.
[attachment file=84732]
[attachment file=84733]
You need to halve the results as it was with a position size of 1 and generally the DJI is a position size of 0.5. The margin and draw down are much bigger during the 2008 downturn. I think this result highlights the fact that in a market such as the DJI that has been a consistent riser if you use a seasonality filter then when a downturn comes you may find yourself placing trades in many weeks that were previously positive but are now suddenly negative and the filter will lag while it re-discovers that those weeks are now negative.
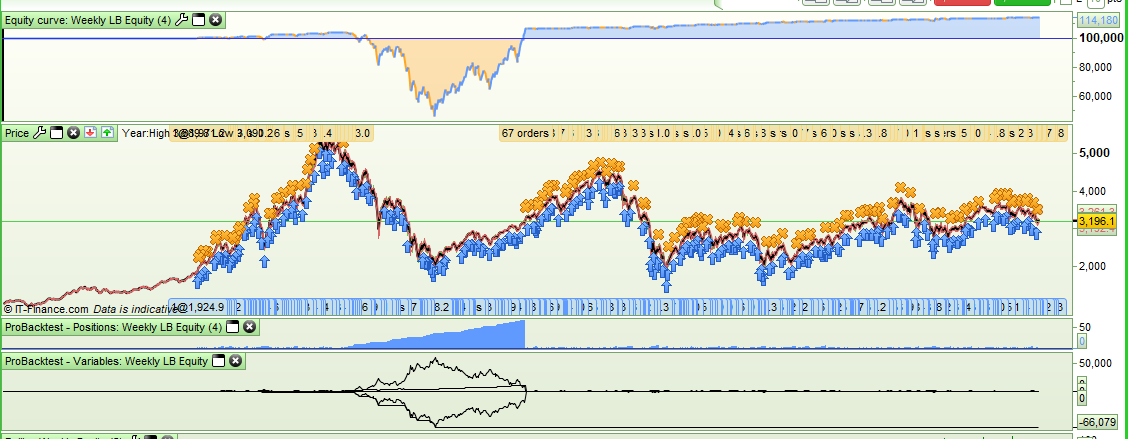
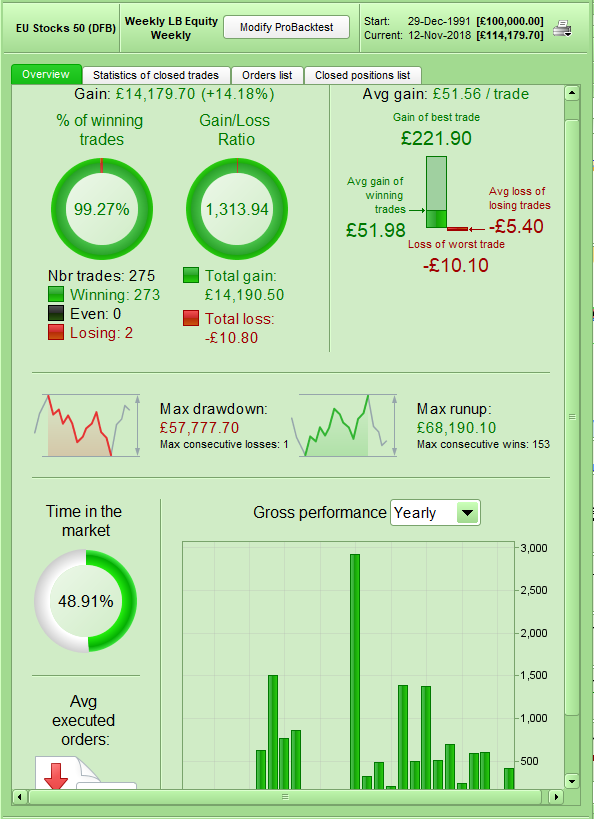
…and now an example of the dangers of an averaging down strategy based purely on buying in historically good weeks. I present to you the EU50 with a spread of 3. The last ten years has been great but you would have needed very big spherical objects and deep pockets before that.
[attachment file=84736]
[attachment file=84737]
A version of my rolling look back weekly analysis indicator has now been posted in the library and can be found here:
Rolling Weekly Seasonality % and Gain