Hello Roberto and all,
May I have the following snippet of code at your best convenience please:
- Low Month Previous
- High Month Previous
- Low Week Previous
- High Week Preivous
Thank you.
Damien
// calculate daily high/low
dailyHigh = dHigh(1)
dailyLow = dLow(1)
// calculate weekly high/low
if dayOfWeek < dayOfWeek[1] then
weeklyHigh = Highest[BarIndex – lastWeekBarIndex](dailyHigh)
weeklyLow = Lowest[BarIndex – lastWeekBarIndex](dailyLow)
lastWeekBarIndex = BarIndex
endif
// calculate monthly high/low
if month <> month[1] then
monthlyHigh = Highest[BarIndex – lastMonthBarIndex](dailyHigh)
monthlyLow = Lowest[BarIndex – lastMonthBarIndex](dailyLow)
lastMonthBarIndex = BarIndex
endif
Doesn’t the weekly high also work like this?
timeframe(1week, updateonclose)
myhigh = high
Yes. They are two ways of writing the same thing, without and with the multitimeframe.
Thank yo MauroPro. Top.
How would you wright the buying condition to, let’s say buy 1 contract on the low of the month/week?
If monthlyLow then
buy 1 contract?
Thank you very much.
Damien
// Definition of code parameters
DEFPARAM CumulateOrders = False // Cumulating positions deactivated
// calculate daily high/low

dailyHigh = dHigh(1)
dailyLow = dLow(1)
// calculate weekly high/low

if dayOfWeek < dayOfWeek[1] then
weeklyHigh = Highest[BarIndex - lastWeekBarIndex](dailyHigh)
weeklyLow = Lowest[BarIndex - lastWeekBarIndex](dailyLow)
lastWeekBarIndex = BarIndex
endif
// calculate monthly high/low
if month <> month[1] then
monthlyHigh = Highest[BarIndex - lastMonthBarIndex](dailyHigh)
monthlyLow = Lowest[BarIndex - lastMonthBarIndex](dailyLow)
lastMonthBarIndex = BarIndex
endif
// Conditions to enter long positions
c1 = (close  CROSSES UNDER monthlyLow)

IF c1 THEN
BUY 1 SHARES AT MARKET
ENDIF
I do not get any positions with this code…
//Nasdaq CFD H1
// Definition of code parameters
DEFPARAM CumulateOrders = False // Cumulating positions deactivated
// calculate daily high/low
dailyHigh = dHigh(1)
dailyLow = dLow(1)
// calculate weekly high/low
if dayOfWeek < dayOfWeek[1] then
weeklyHigh = Highest[BarIndex – lastWeekBarIndex](dailyHigh)
weeklyLow = Lowest[BarIndex – lastWeekBarIndex](dailyLow)
lastWeekBarIndex = BarIndex
endif
// calculate monthly high/low
if month <> month[1] then
monthlyHigh = Highest[BarIndex – lastMonthBarIndex](dailyHigh)
monthlyLow = Lowest[BarIndex – lastMonthBarIndex](dailyLow)
lastMonthBarIndex = BarIndex
endif
// Conditions to enter long positions
c1 = (close CROSSES UNDER monthlyLow)
IF c1 THEN
BUY 1 SHARES AT MARKET
set stop pLoss 100
set target pProfit 200
ENDIF
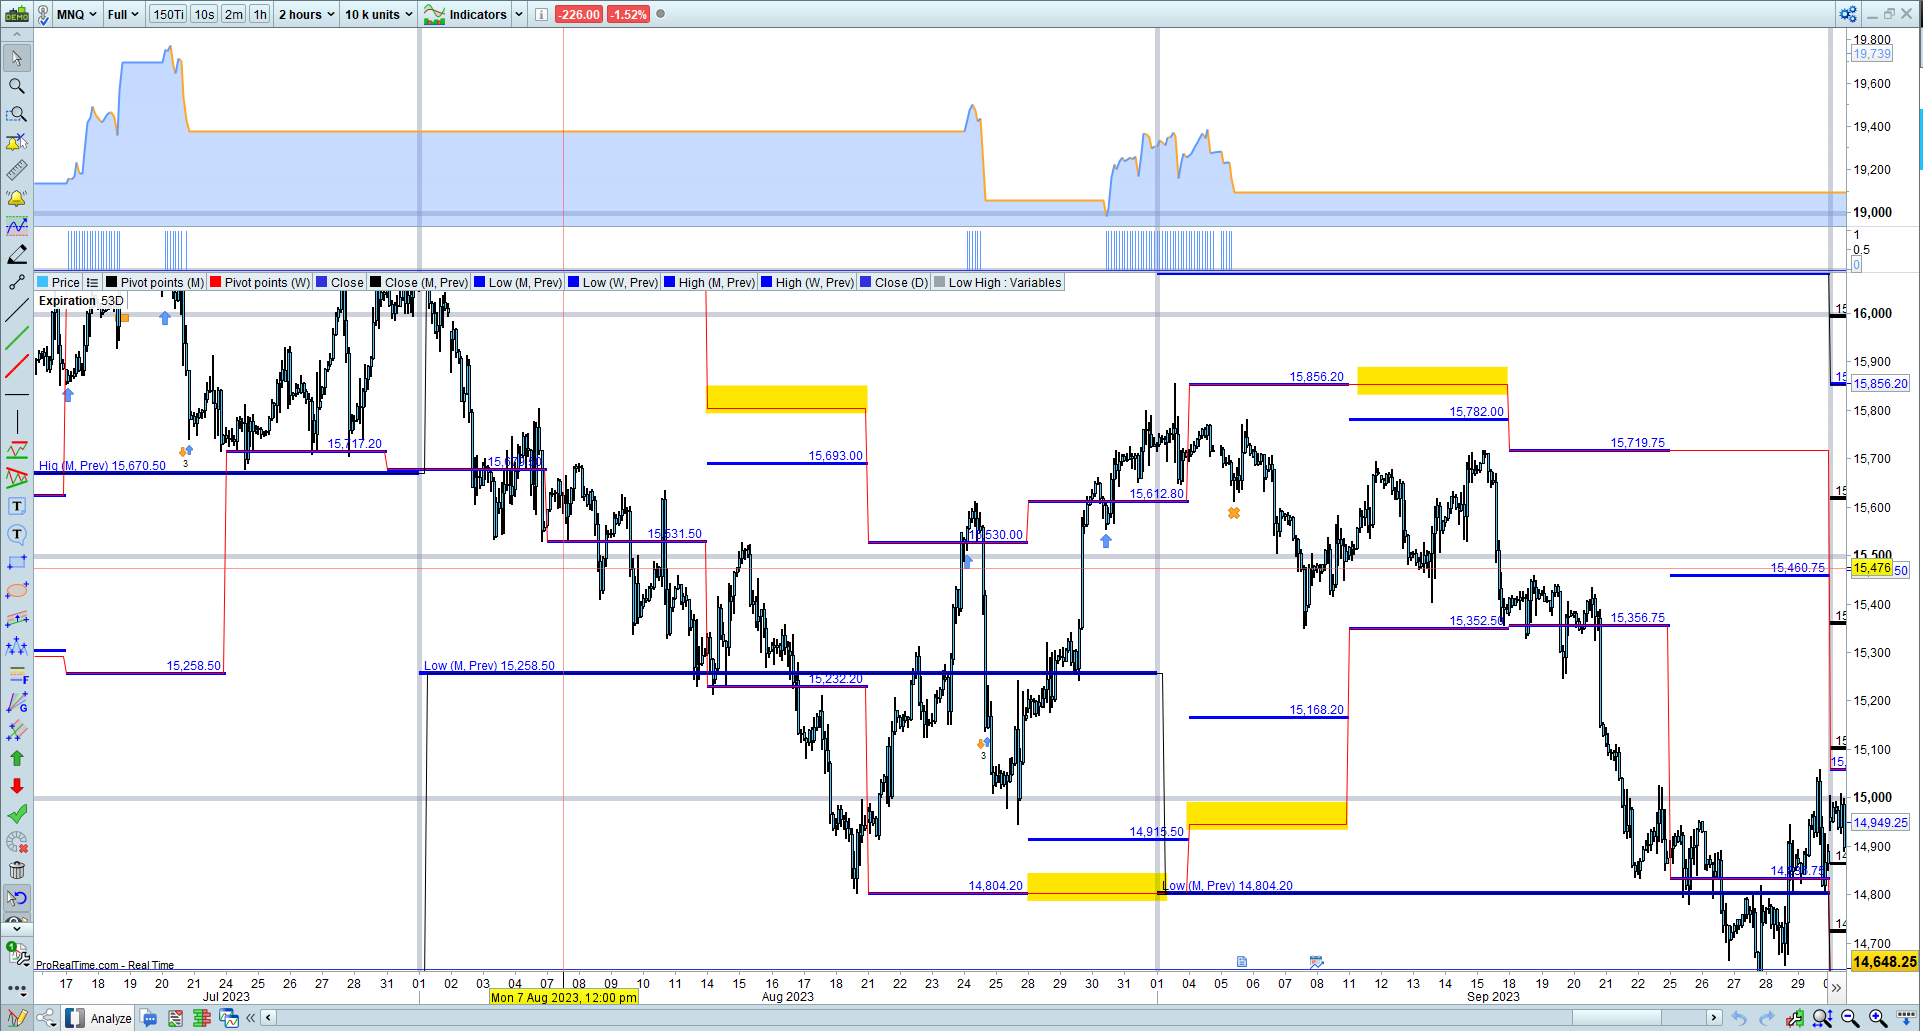
You con use graphOnPrice to see the max-min levels on the chart.
This is just a quick experiment: buy when the price crosses below the weekly maximum (Nasdaq 1 hour).
//Nasdaq TF: H1 [spread = 1]
defParam cumulateOrders = false
defParam preLoadBars = 10000
//——————————
positionSize = 1
//———————————————————————–
// calculate daily high/low
dailyHigh = dHigh(1)
dailyLow = dLow(1)
// calculate weekly high/low
if dayOfWeek < dayOfWeek[1] then
weeklyHigh = Highest[BarIndex – lastWeekBarIndex](dailyHigh)
weeklyLow = Lowest[BarIndex – lastWeekBarIndex](dailyLow)
lastWeekBarIndex = BarIndex
endif
// calculate monthly high/low
if month <> month[1] then
monthlyHigh = Highest[BarIndex – lastMonthBarIndex](dailyHigh)
monthlyLow = Lowest[BarIndex – lastMonthBarIndex](dailyLow)
lastMonthBarIndex = BarIndex
endif
//—————————————————————————-
c1L = close crosses under weeklyHigh
if not onMarket and c1L then
buy positionSize contracts at market
set stop pLoss 80
set target pProfit 280
endif
//—————————————-
pointToReachLong = 150*pointSize
pointToKeepLong = 10*pointSize
If not onMarket then
newSL = 0
endif
If longOnMarket then
If newSL = 0 and high – tradePrice(1) > pointToReachLong then
newSL = tradePrice(1) + pointToKeepLong
endif
If newSL > 0 and close-newSL > pointToReachLong then
newSL = newSL + pointToKeepLong
endif
endif
If newSL > 0 then
sell at newSL STOP
endif
//——————————————————–
graphOnPrice weeklyHigh coloured (189,252,201)
graphOnPrice weeklyLow coloured (255,215,0)
graphOnPrice monthlyHigh coloured (0,205,0)
graphOnPrice monthlyLow coloured (255,0,0)
// https://cloford.com/resources/colours/500col.htm
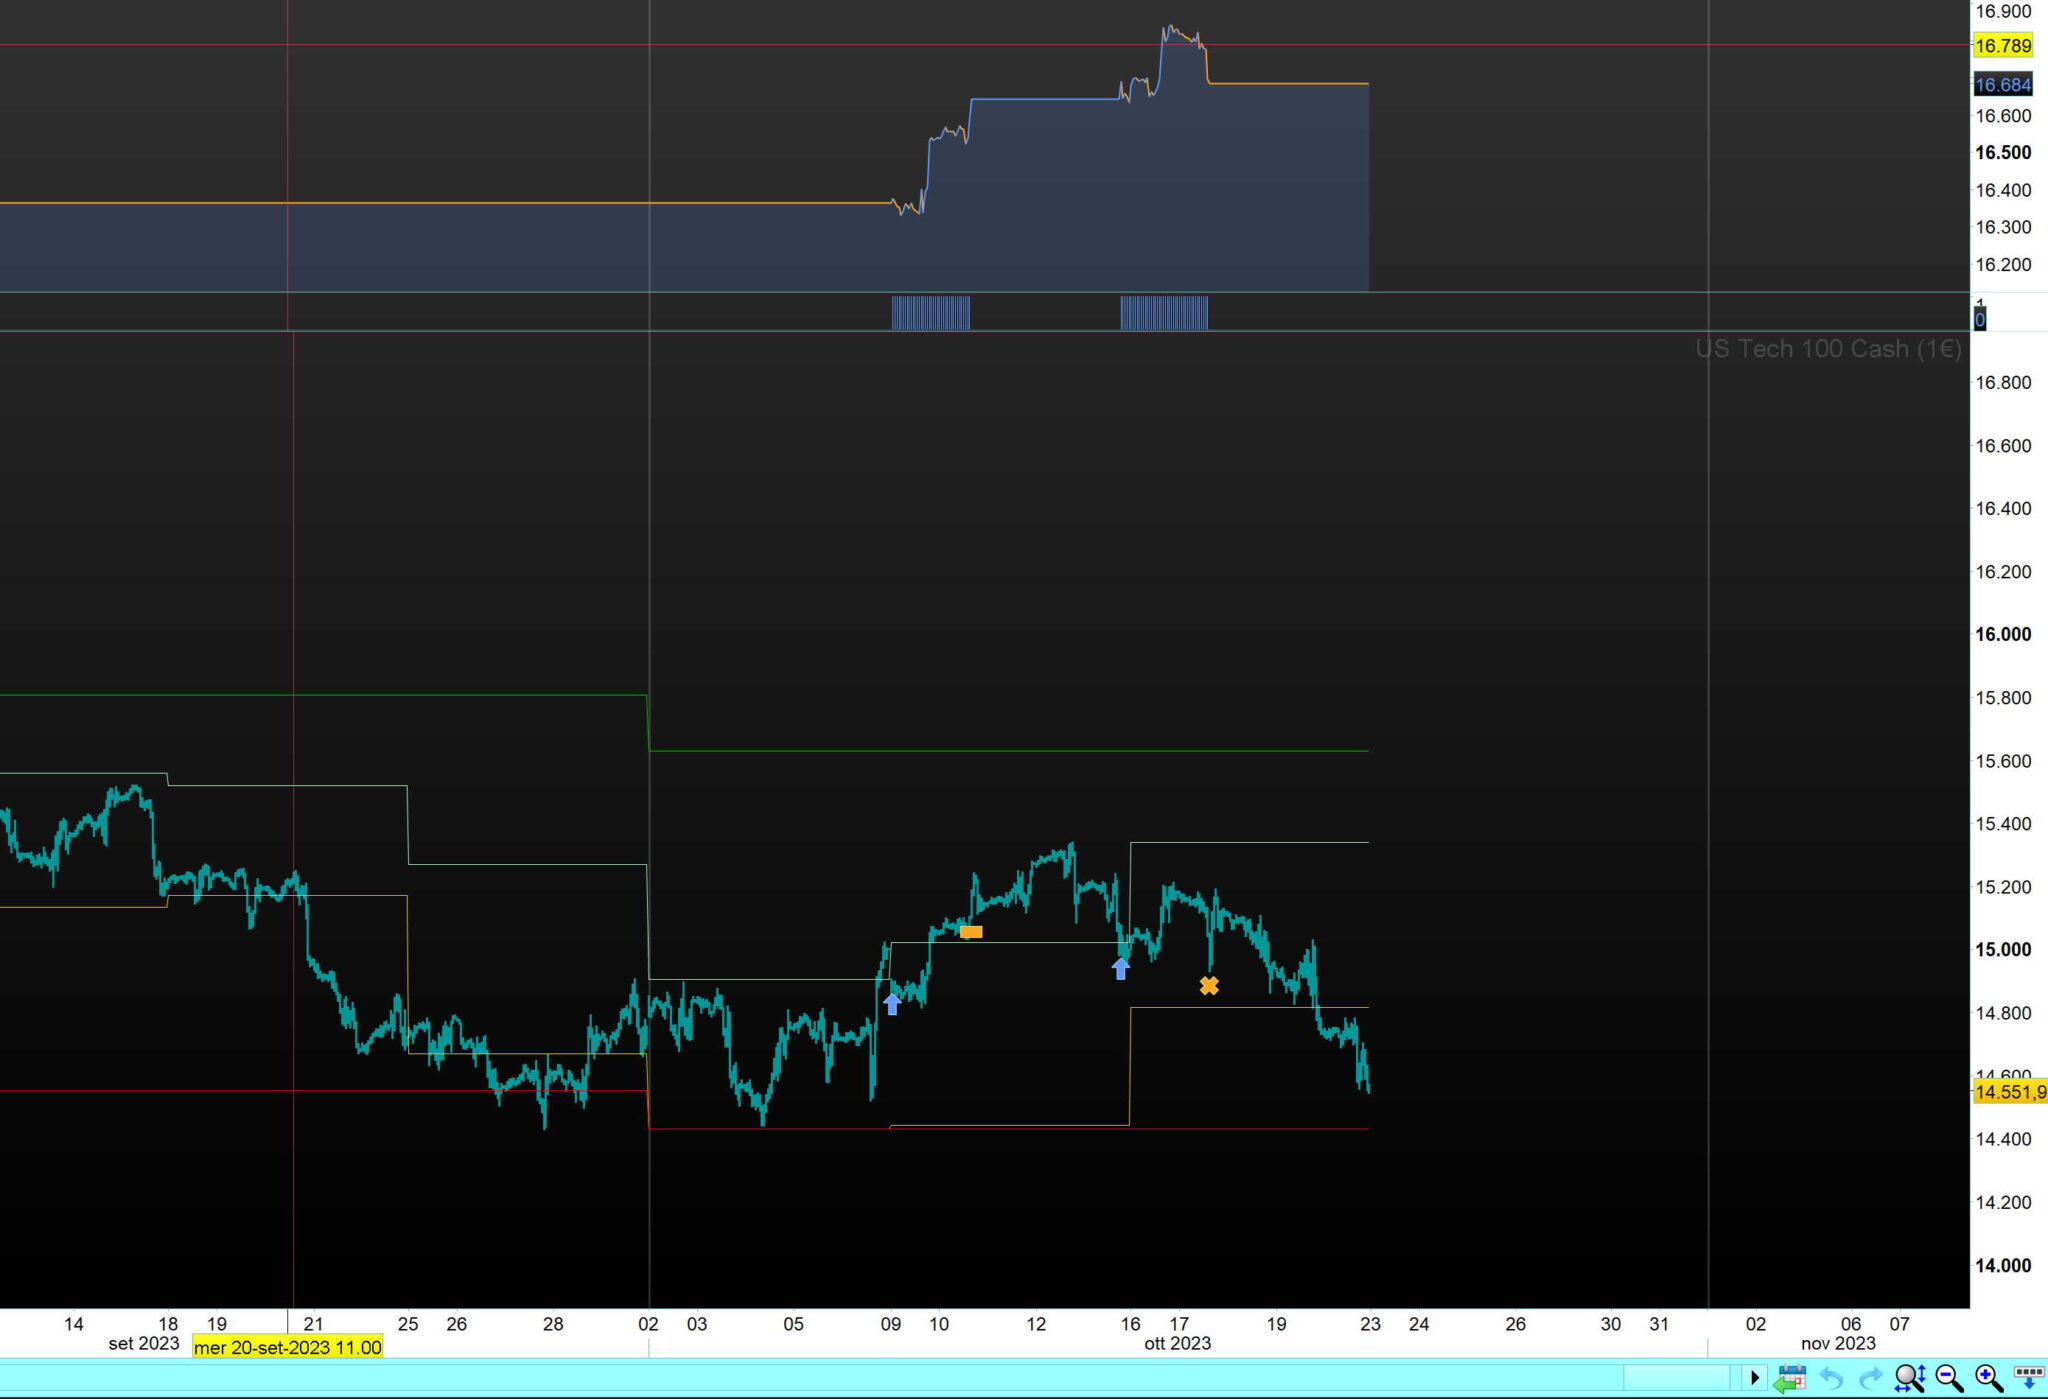
Thank you very much MauroPro.
Works nearly perfectly. Just a little discrepancy highlighted in yellow (between your indicator and the PRT PP). Who’s right ? ;-))
It’s difficult for me to control bcause you use the future that is a bit different from the cfd.
However, from the chart you should understand which data is correct (also consider that pivot are calculated in different ways).