Volume on price/volumeprofile q's
Forums › ProRealTime English forum › ProBuilder support › Volume on price/volumeprofile q's
- This topic has 9 replies, 4 voices, and was last updated 4 years ago by
Vonasi.
-
-
03/23/2018 at 10:18 PM #66219
Been using vol on price for a while, but getting annoyed that I can’t switch sides. Does anyone know if theres a way to get vop to the right side of the chart?
12/17/2018 at 3:01 PM #8729412/17/2018 at 3:09 PM #87299I tried to create something like the Volume on Price indicator but one that only looked at a certain number of candles (a look back period) rather than all that are on the chart. I didn’t manage to get it to work. Do you think that something like this is possible Nicolas?
12/17/2018 at 3:27 PM #87301Yes with a loop starting from the current bar, a good example is this indicator: Bull & Bear Volume-by-Price levels
a recent discussion to make it look at VPOC also: Bull & Bear Volume-by-Price levels modo VPOC
12/17/2018 at 4:30 PM #8730412/17/2018 at 5:27 PM #87310I think it would be interesting to convert your bull/bear volume on price indicator so that it checks which is the highest volume price area at every bar for a look back period and then draws a line on the chart that represents this. The line would represent the recent history of maximum price on volume. I’m not sure if the results would be useful and I suspect it would take forever to draw but it might be interesting.
12/17/2018 at 5:43 PM #87311In fact thinking about it it would need a pair of band lines for where maximum bull volume is and a pair of band lines for where maximum bear volume is and then one pair of bands for where combined maximum volume is. It might get a bit messy. I think it is raining tomorrow so I might give it a look anyway.
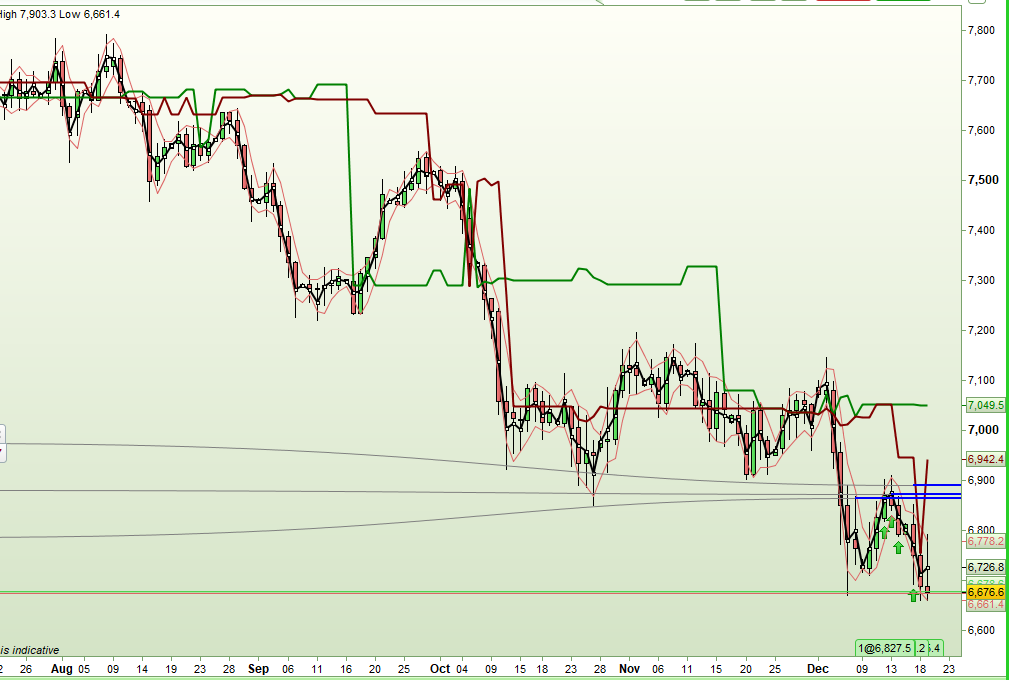
12/19/2018 at 11:19 PM #87497I created the indicator I described above and it was slow to draw and very messy with six price bands on the chart. I adapted it slightly so that it just showed the mid point of each price range if that was where the maximum bull volume or bear volume was. Initial analysis seems to show that it tells us very little about support or resistance levels which kind of means that the standard volume on price indicator doesn’t either.
Here is the code if anyone is interested:
1234567891011121314151617181920212223242526272829303132333435363738394041424344454647defparam calculateonlastbars=200//NbrBars=12//lookback=200hh=highest[lookback](high)ll=lowest[lookback](low)div = (hh-ll)/NbrBarsi=0volsum=summation[lookback](volume)lastbulltotal = 0lastbeartotal = 0while i<NbrBars dolrange=ll+div*ihrange=lrange+divvolbull=0volbear=0for j = 1 to lookback doif close[j]>=lrange and close[j]<=hrange thenif close[j]>open[j] thenvolbull=volbull+volume[j]elsevolbear=volbear+volume[j]endifendifnextbullbar = round((volbull*lookback)/volsum)bearbar = round((volbear*lookback)/volsum)if bullbar > lastbulltotal thenlastbulltotal = bullbarlastbullhrange = hrangelastbulllrange = lrangemidbull = ((lastbullhrange - lastbulllrange)/2 + lastbulllrange)endifif bearbar > lastbeartotal thenlastbeartotal = bearbarlastbearhrange = hrangelastbearlrange = lrangemidbear = ((lastbearhrange - lastbearlrange)/2 + lastbearlrange)endifi=i+1wendreturn midbull coloured(0,128,0) style(line,2), midbear coloured(128,0,0) style(line,2)1 user thanked author for this post.
08/19/2019 at 9:38 PM #10509408/21/2019 at 10:32 AM #105180Hello, does this work with version 10.3 ?
Yes.
-
AuthorPosts
Find exclusive trading pro-tools on 
