Hi all,
I’m looking to write a basic volatility contraction screener. The idea is to find stocks in a trend by looking at the relationships between the various moving average. I would then find those that have moved into a pattern of consolidation by looking for stocks that have moved through the 9 day moving average multiple times over a 2 week period (e.g., the high-low range of 3 daily candles goes through the 9 day MA in a 10 day period). I’ve been trying to write the step that will count the number of times the range passes through the 9 day moving average but keep getting an error. The code I’ve written is as follows.
countdays = 10  //number of days to test
upcrosses = 0   //number of crosses

FOR d = 1 TO countdays DO

IF Low[d]>average[9] AND High[d]<average[9] THEN

upcrosses = upcrosses +1

ENDIF

c1 = upcrosses > 3

screener [c1]
I have had a look through other code where people have used the FOR TO DO but am not sure if I’ve missed some logic in the argument.
Thanks for any assistance,
David
HI,
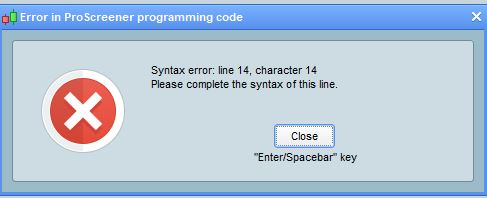
I realised I didn’t actually say what my problem was with the code. Basically, it doesn’t run. I get an error message telling me to complete the syntax of line 14, which is the final line. I’ve spent another hour or so trying to get this code to run, so any suggestions would be appreciated. (I have fixed having the < and > the wrong way around as well). Error message pictured below.
[attachment file=58941]
You need to put a NEXT in your code for the loop to work.
Thanks Vonasi, I had just worked that out and was coming on here to update the post. I have to admit, coming from a very limited programming background, I find this a little slow to get through. The help on these forums has been great though and I do appreciate people taking the time to assist relatively inexperienced people like myself. I will continue to try reading other people’s screeners and the PRT screener manual before bothering people on the forum though 🙂
No problem – the Help > Probuilder language documentation I always find to be a great reference tool with quite a few examples that help clarify things.
Good evening David.
If I understood what you were doing, your idea looks very interesting to detect certain phases of range.
Could you post your code once the problems have been solved ..
Thank you
Hi Alain,
I’m happy to share the code, though it feels simplistic compared to some of the things I’ve seen posted on these forums. I’ve defined an uptrend as any stock that has had the 100 day simple moving average rise each day for 3 months (60 days). I’ve then looked for a contraction of the trend by looking for stocks where the candles have a low that is below the 9 day moving average and a high above the 9 day moving average. The screener requires more than 3 of these crosses to occur in a 10 day period. If you have any experience with coding you can probably easily improve what I’ve written. If you’re new, I have included comments about what each section does so you can modify it to suit your needs.
//Counting candles that span the 9 day moving average for shares in an established uptrend

countdays = 10  //number of days to look back in counting crosses of the 9 day MA
ccrosses = 0
MA9 = average[9]

//count the number of candles spanning the 9 day moving average

FOR d = 1 TO countdays DO

IF Close[d]>MA9 AND Open[d]<MA9 THEN

ccrosses = ccrosses +1

ENDIF

NEXT

c1 = ccrosses > 3  //defines the number of crosses required for the screener

//define an uptrend as the 100 day moving average moving up for 60 days in a row

MA100=average[100]

c2 = summation[60](MA100>MA100[1])=60  //defines the number of days the moving average must be rising

condition = c1 and c2

screener [condition]
I’ve been reasonably happy with what this screener has returned as some of the stocks look like they are setting up and are worth watching.
I am planning to write a similar screener that looks for a contraction in the range of the candles, eg the previous 10 candles have an average range that is perhaps 70% of the 3 month average. I think volatility contraction patterns are interesting but am not sure of the best way to find them without simply looking through lots of charts 🙂
Regards,
David
10 period ATR as percent of 60 period atr and its done , easy screener . Make everything variable to increases versatility
Thanks Brisvegas, that sounds like a good way to do it 🙂
Hello,
Could you share the code for this “10 period ATR as percent of 60 period atr Make everything variable to increases versatility”
Thank you, new and still learning.
Andy
I think that Brisvegas was talking about a code like this:
period1 = 10
period2 = 60

volat = AverageTrueRange[period1]/AverageTrueRange[period2]
The “volat” variable returns the volatility over the last 10 days as a coefficient of the volatility over the last 60 days (periods).