A shocking answer #1 : IG changes things.
I have come to this conclusion since I am now working with IB.
If you continuously compare the charts of IB and IG – and you know that IB is just the normal truth, then you can see how IG does things differently. On the long term average it is the same, but within some bandwidth they change the behavior of their own market. And no System / Strategy can cope with that on the longer term.
Notice that I have the charts of both on my screens for years now.
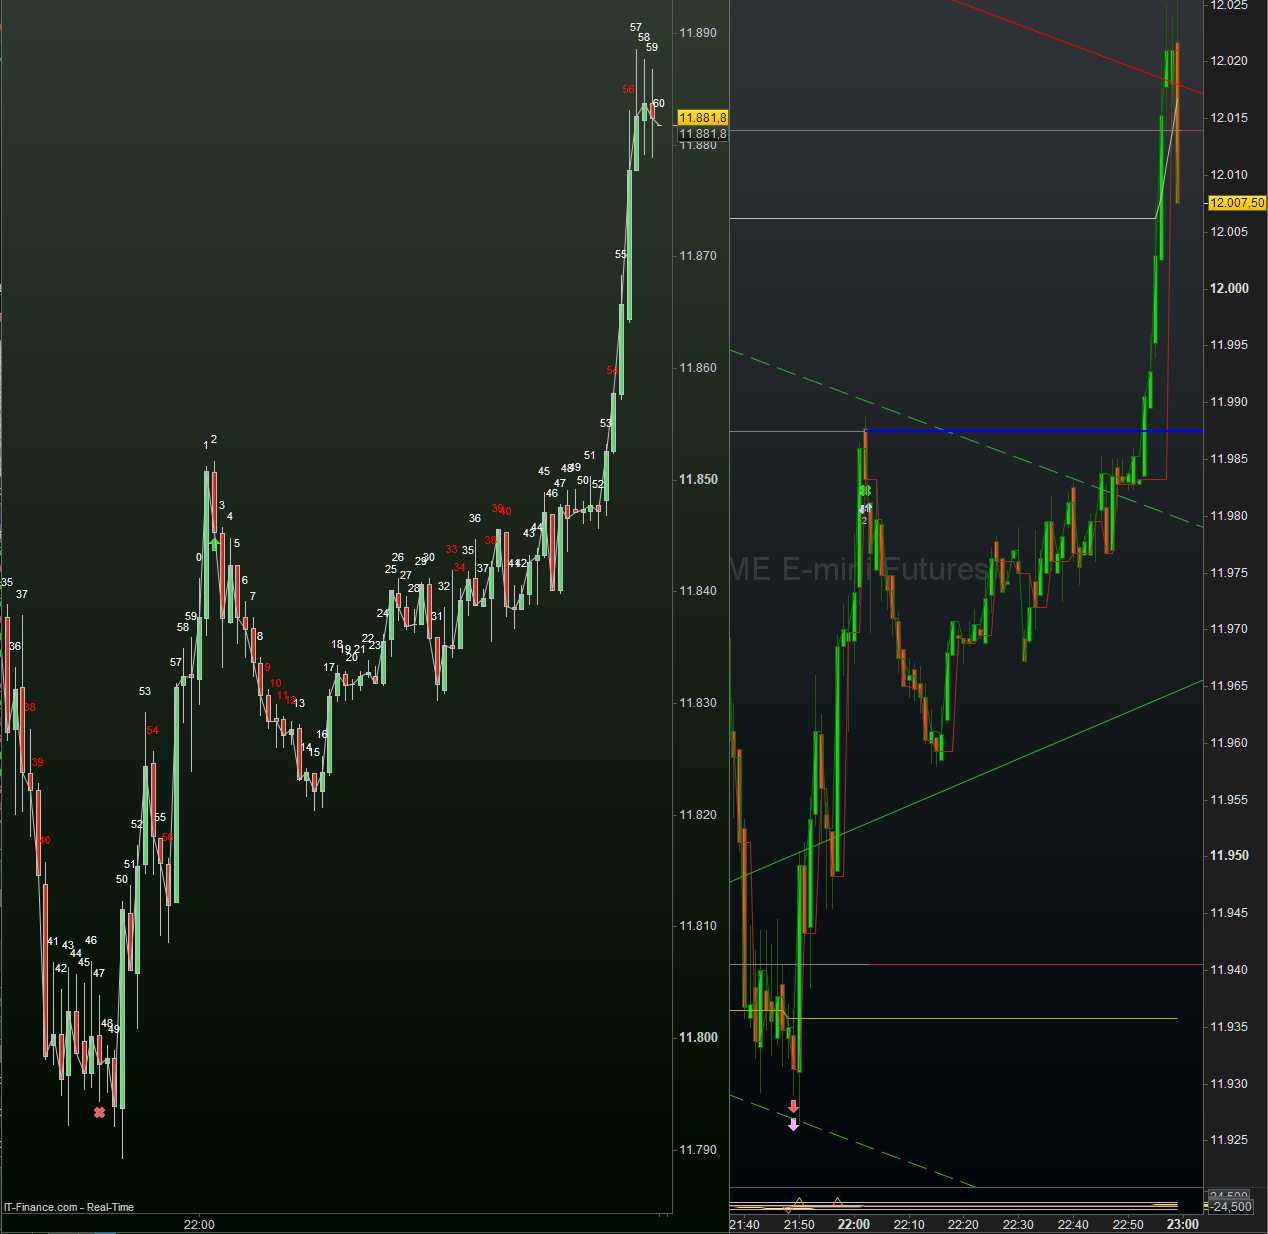
For fun or conspiracy, think like this : there’s a 200 points difference between the two (in screenshot #1 left is IG, right is IB, both Nasdaq). With this 200 points bandwidth IG can play what it wants (maybe 400 if you think above the line of IB as well). Thus, it is not the truth anyway and we can never say “hey, this is not right !” … because
all is not right.
This is just one screenshot from the end of last night. Look at the difference on these 1 minute bars you can see already in this random screenshot. And we know that the right one is the truth.
Somewhere last week I talked about already the Average function no-way is the same for both. Underlaying is a trend determination. There is no single-way I am able to determine the trends equally for both. Now you tell
me what is going on. 🙁
Because I distrusted the Average function in either, I made the Average function myself. And again I could not find a way to make the result equal in both. I also could not tweak one of them to get there. IG just does things completely on its own and it is not the truth.
Anyway understand what I am saying here; I can’t make a decent Entry system based upon shorter term trends. Both IG and IG behave totally different regarding this. Where IB would Enter, IG would Exit. Things like that.
Two-three years ago I spent an afternoon making screenshots of these trend differences – I must have these somewhere. I even filed a ticket for this, of course without any response whatsoever.
Back then I was working with Forex only, and at that time I did not have the experience on market differences (I am not able to see market difference with Forex – you ?). Now I am working with Nasdaq mostly, and all of the others I have on screen for manual trading. And Yes, now we sure have market differences, starting with Trump, then Covid, now the War. With IG I am not able to make one System for all. With IB no issues or at least it is much much easier … How can it be …
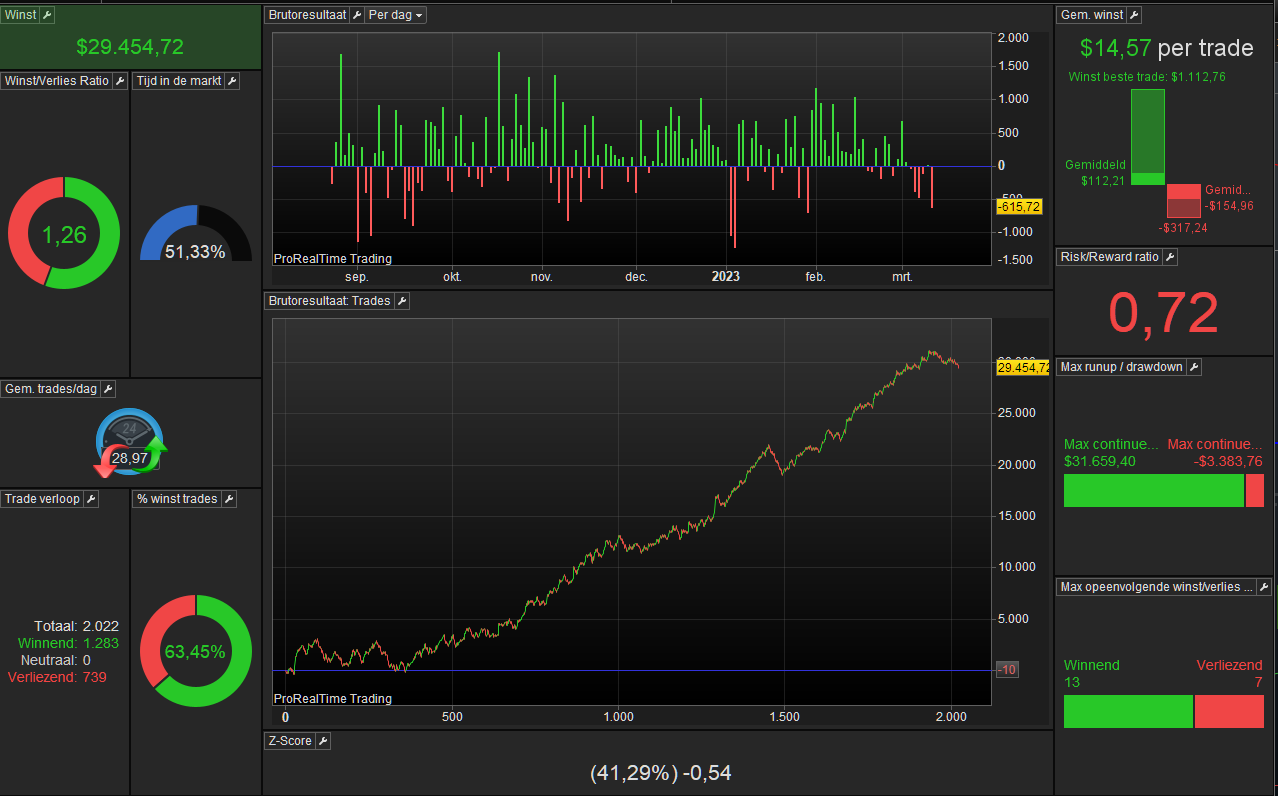
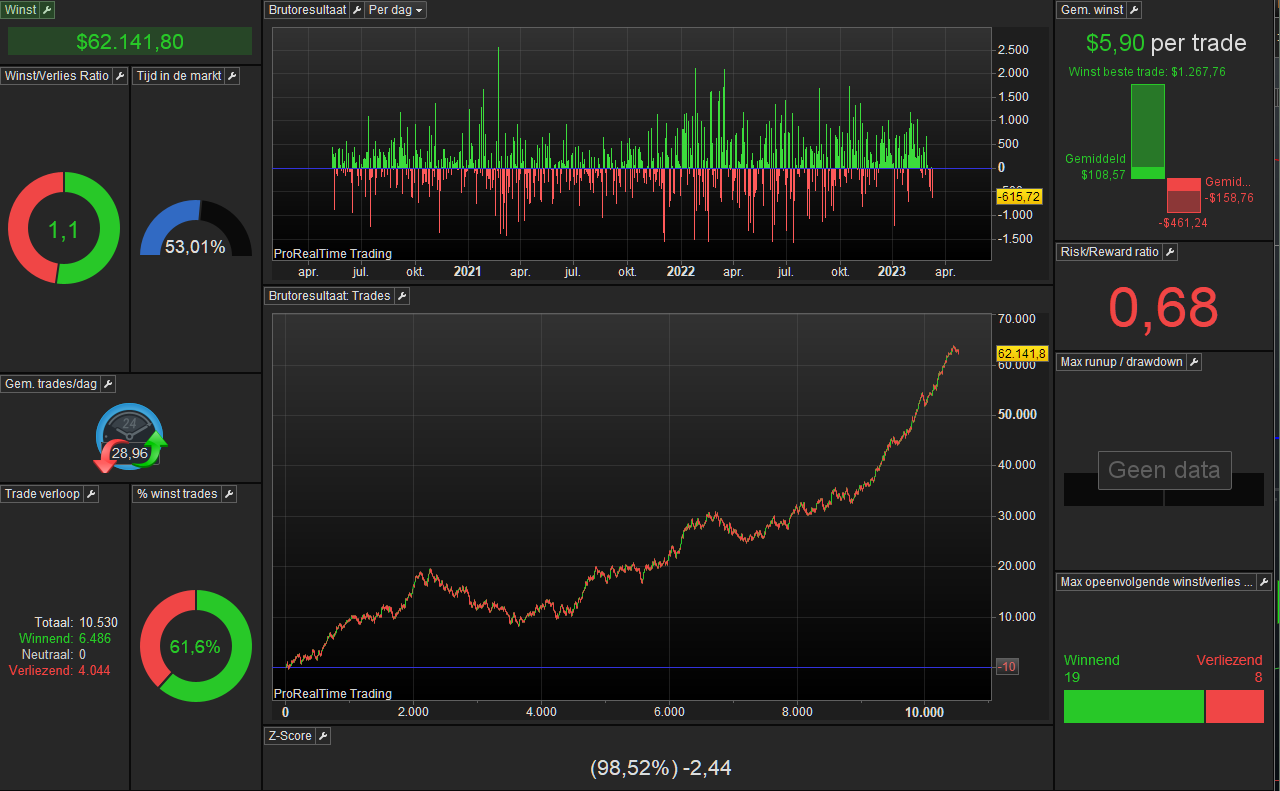
In screenshot 2 and 3 you see a real time (I mean, ran on the spot for the purpose of this post) example of what I just said. #2 is what I am working on on-going. It comprises testing with 200K (1 minute) bars. I started developing this system a year ago. This means it will only have been over-optimized from of September 2021 (200K bars is about 6 months). This is right before the 4000-trades mark you see in #3 – #3 is 1 million bars. It is Live since July last year – this is at the 8000-trades mark in #3. Now, #3 starts at May 13 2020.
There is no single freaking way that I would be able to show this for IG. Wait, we can do that on the spot. … … So there you go in #4.
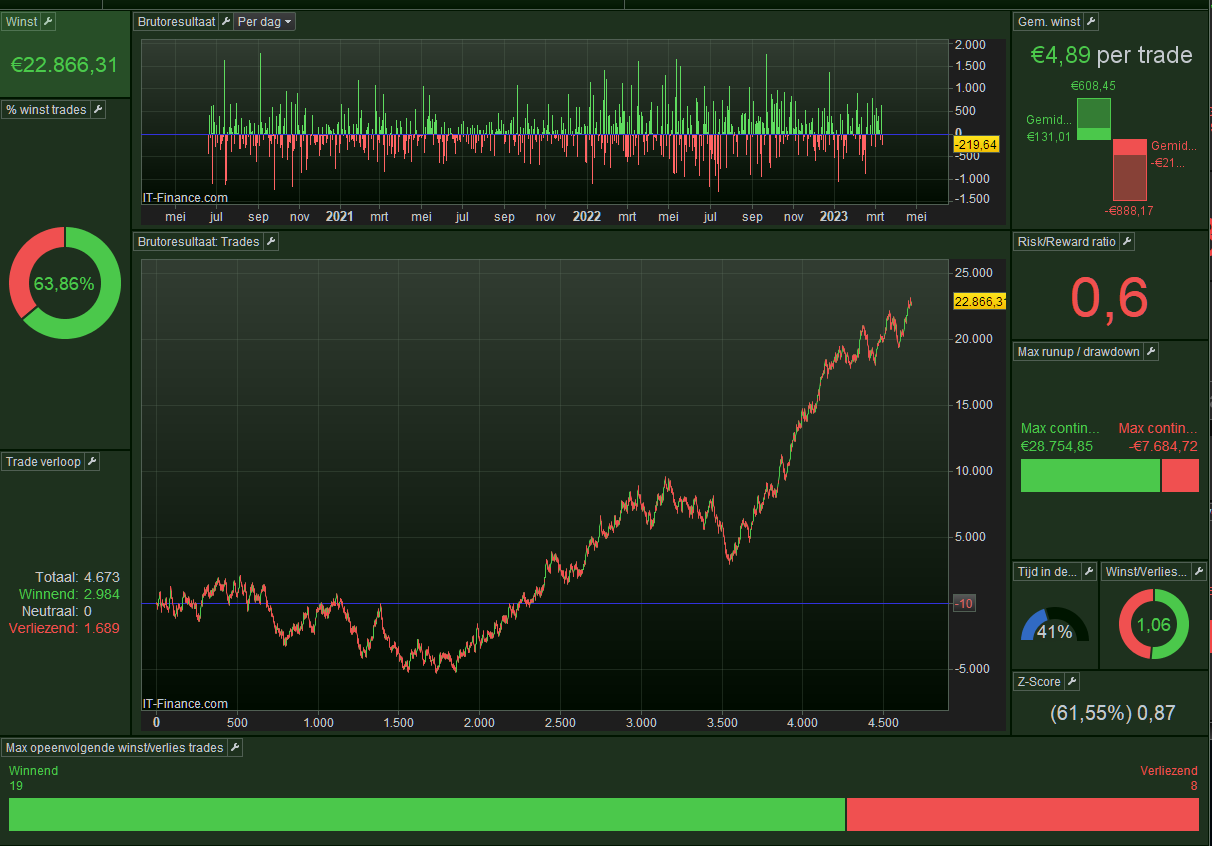
Both IB and IG systems are essentially the same. And worse : It is the IG system running Live since July 2022 with the on-going further development. 2 months ago it was ported to IB (only takes a week because nothing works out the same). But trust me, the functional and technical Strategy is the same in the base. IB runs in live too. You can well say that the IG variant bears half of the trades of the IB one, because the Entries are less well-controlled. And because the SL is deeper than the TP is high, the trades run longer – and thus less of them. Anyway about #4 :
September 2021 (see text above) is at the ~1600-trades mark. Oh wow, what a coincidence (not). The dip just after the 3500-trades mark is July 18 2022 (again see text above). Mind the on-going development, hence one in the x days (say week) I adjust things and put to Live the new version.
The moral should be clear : what I develop today with backtesting data of 6 months, is automatically over-optimized no matter how hard you try to very explicitly not do that (this is not for everybody, but I work like that). Eh … for IG that is. Not so for IB because, well, in IB there’s much less to over-optimize on; it is the market only. In IG we deal with other forces and we cannot control those.
Btw (in #4), the deepest dip – before the 2000-trades mark is November 2021. There all stalled for normal Manual trading (read : I could not manually trade from of that moment – still can’t). Because I started working on this Strategy in March 2022 using backtest data back till September 2021, I know that this Strategy is made for the Sideways market. Also, if I recall correctly, the War started to have its influence at the largest peak you see at the ~3200-trades mark. This is May 20, 2022. There crops from Ukraine started to cease shipping (IIRC !). So without looking it up, those were bear market times, things going down and not sideways. This Strategy can’t cope with that.
Oh. So why can it within IB then ? In IB the same moment occurs at 7400-trades (see #3).
Now you only need to know why the ProRealSentiment functionality exists in PRT-IG (it does not exist in PRT-IB). Investigate what that actually is, and *know* (for a fact – I tell you) that IG uses that herself excessively. Thus, the broker I mean. Now back to the beginning of this post …
Peter