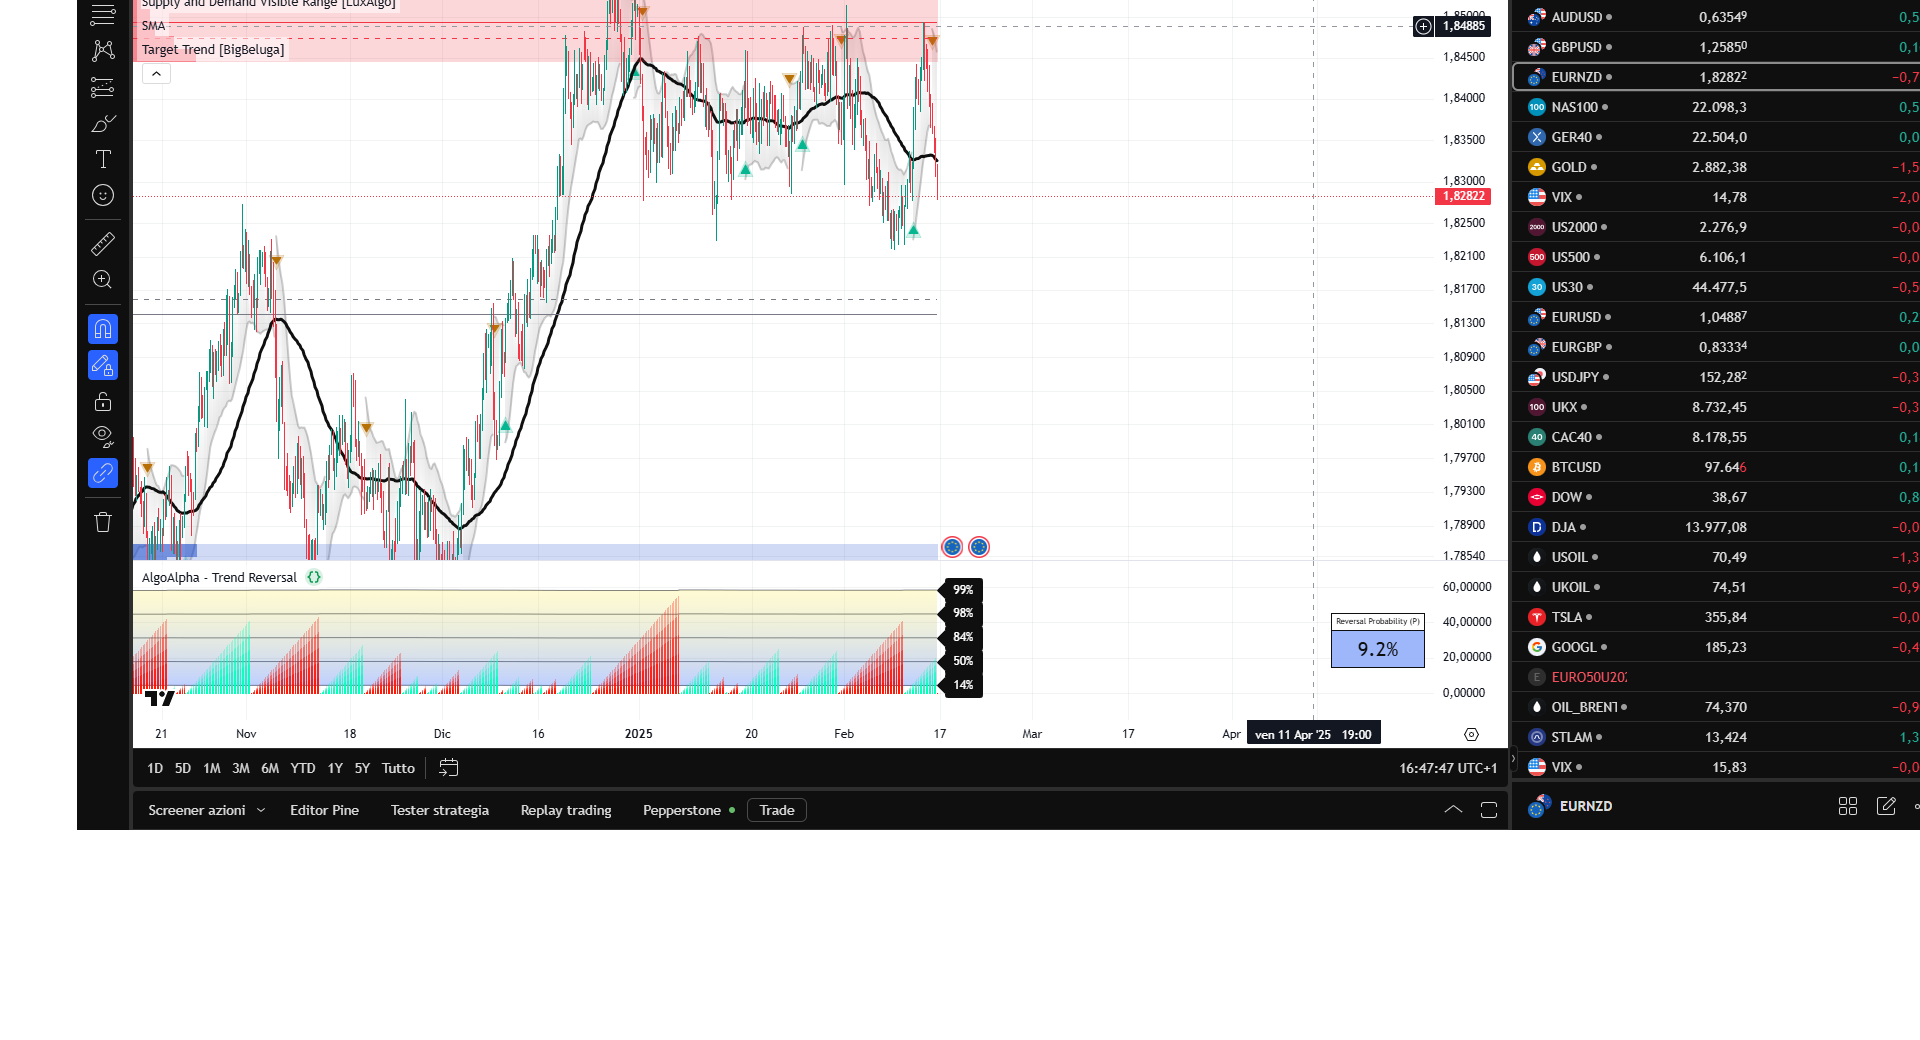
Ciao, ho visto questo indicatore che mi pare interessante e chiedo se può essere tradotto.
Grazie
//@version=6
indicator(“Trend Reversal Probability [Algoalpha]”, “AlgoAlpha – Trend Reversal”, false, explicit_plot_zorder = true)
// Inputs
group1 = “Settings”
oscPeriod = input.int(20, “Oscillator Length”, minval = 1, group=group1, tooltip=”Length for the oscillator calculation”)
lvl = input.bool(true, “Enable Probability Levels”, group=group1, tooltip=”Display probability level lines on the chart”)
group2 = “Colors”
upColor = input.color(#00ffbb, “Up Color”, group=group2, tooltip=”Color for upward trend”)
downColor = input.color(#ff1100, “Down Color”, group=group2, tooltip=”Color for downward trend”)
// Amazing Oscillator Calculation
midpointPrice = hl2
shortSMA = ta.sma(midpointPrice, 5)
longSMA = ta.sma(midpointPrice, 34)
amazingOsc = shortSMA – longSMA
// RSI-like Calculation
rise = ta.rma(math.max(ta.change(amazingOsc), 0), oscPeriod)
fall = ta.rma(-math.min(ta.change(amazingOsc), 0), oscPeriod)
customRSI = (fall == 0 ? 100 : rise == 0 ? 0 : 100 – (100 / (1 + rise / fall))) – 50
opacityLevel = customRSI > 0 and customRSI > customRSI[1] or customRSI < 0 and customRSI < customRSI[1] ? 30 : 80
barColor = customRSI > 0 ? color.new(upColor, opacityLevel) : color.new(downColor, opacityLevel)
// Track the bar counts between crosses of customRSI
var durations = array.new_int()
cut = ta.barssince(ta.cross(customRSI, 0))
if cut == 0 and cut != cut[1]
durations.unshift(cut[1])
basis = durations.avg()
col = customRSI > 0 ? upColor : downColor
avg = plot(basis, title=”Average Duration”, display=lvl ? display.all : display.none, color=color.gray)
upper = plot(basis + durations.stdev(), title=”Upper 1 SD”, display=lvl ? display.all : display.none, color=color.gray)
upper1 = plot(basis + durations.stdev() * 2, title=”Upper 2 SD”, display=lvl ? display.all : display.none, color=color.gray)
upper2 = plot(basis + durations.stdev() * 3, title=”Upper 3 SD”, display=lvl ? display.all : display.none, color=color.gray)
lower = plot(basis – durations.stdev(), title=”Lower 1 SD”, display=lvl ? display.all : display.none, color=color.gray)
fill(lower, upper2, basis + durations.stdev() * 3, basis – durations.stdev(), #ffe6002c, color.new(color.blue, 70))
transpcon1 = 10
chg1 = cut * 0.80
chg2 = cut * 0.60
chg3 = cut * 0.40
chg4 = cut * 0.20
plot(cut, title=”Signal Duration”, color=color.new(col, transpcon1 + 60), style=plot.style_columns, linewidth=4)
plot(chg1, title=”Signal Duration 80%”, color=color.new(col, transpcon1 + 55), style=plot.style_columns, linewidth=4)
plot(chg2, title=”Signal Duration 60%”, color=color.new(col, transpcon1 + 45), style=plot.style_columns, linewidth=4)
plot(chg3, title=”Signal Duration 40%”, color=color.new(col, transpcon1 + 30), style=plot.style_columns, linewidth=4)
plot(chg4, title=”Signal Duration 20%”, color=color.new(col, transpcon1 + 25), style=plot.style_columns, linewidth=4)
var lab = array.new_label()
while lab.size() > 0
lab.shift().delete()
if lvl
lab.push(label.new(bar_index, basis – durations.stdev(), “14%”, color=chart.fg_color, textcolor=chart.bg_color, style=label.style_label_left))
lab.push(label.new(bar_index, basis, “50%”, color=chart.fg_color, textcolor=chart.bg_color, style=label.style_label_left))
lab.push(label.new(bar_index, basis + durations.stdev(), “84%”, color=chart.fg_color, textcolor=chart.bg_color, style=label.style_label_left))
lab.push(label.new(bar_index, basis + durations.stdev() * 2, “98%”, color=chart.fg_color, textcolor=chart.bg_color, style=label.style_label_left))
lab.push(label.new(bar_index, basis + durations.stdev() * 3, “99%”, color=chart.fg_color, textcolor=chart.bg_color, style=label.style_label_left))
volatility = ta.stdev(cut, 100) / 2
plotchar(cut > basis + durations.stdev() * 3 ? cut + volatility : na, title=”Extreme Reversal Probability”, char=”▼”, location=location.absolute, color=color.orange, size=size.tiny)
// Function to approximate cumulative probability using error function
f_cdf(z) =>
a1 = 0.254829592
a2 = -0.284496736
a3 = 1.421413741
a4 = -1.453152027
a5 = 1.061405429
p = 0.3275911
sign = z < 0 ? -1 : 1
x = math.abs(z) / math.sqrt(2)
t = 1 / (1 + p * x)
erf_approx = 1 – (((((a5 * t + a4) * t) + a3) * t + a2) * t + a1) * t * math.exp(-x * x)
0.5 * (1 + sign * erf_approx)
z = (cut – durations.avg()) / durations.stdev()
probability = f_cdf(z)
var data_table = table.new(position=position.middle_right, columns=2, rows=8, bgcolor=color.new(chart.bg_color, 10), border_width=1, border_color=chart.fg_color, frame_color=chart.fg_color, frame_width=1)
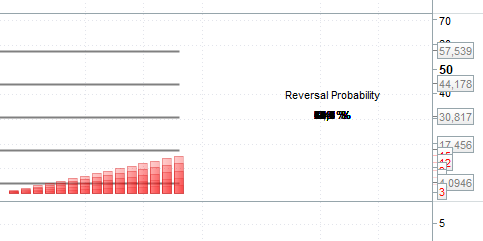
table.cell(data_table, text_halign=text.align_center, column=0, row=0, text=”Reversal Probability (P)”, text_color=chart.fg_color, text_size=size.tiny)
table.merge_cells(data_table, 0, 0, 1, 0)
table.cell(data_table, text_halign=text.align_center, column=0, row=1, text=str.tostring(probability * 100, “#.#”) + “%”, text_color=chart.fg_color, text_size=size.large, bgcolor=color.from_gradient(probability, 0, 1, color.new(color.blue, 50), #ffe6002c))
table.merge_cells(data_table, 0, 1, 1, 7)
// Alerts
alertcondition(probability > 0.84, title=”High Reversal Probability”, message=”Reversal probability crossed 84%”)
alertcondition(probability > 0.98, title=”Extreme Reversal Probability”, message=”Reversal probability crossed 98%”)
alertcondition(probability < 0.14, title=”Low Reversal Probability”, message=”Reversal probability below 14%”)
alertcondition(cut == 0, title=”Probability Reset”, message=”Reversal probability reset”)