Trading without indicators

Viewing 15 posts - 436 through 450 (of 465 total)
  • Author
    Posts
  • #262912 quote
    shugshug
    Participant
    Average

    Incidently when doing that challege thing i did not look at any other timeframes i stayed on a 5 min chart, now i have learned to look at a higher timeframe to see overall what direction price is trending. If im on a 30 sec chart i’ll look at the 5 min, if im on a 5 min ill look at the 15 min if im on the hour chart i’ll look at the 4 hour and if im on the 4 hour ill look at the daily chart.


    Another realisation i had was that time is very important, we only have so much of it, can’t buy it back so thinking about that i realised that if i had a lot of money as some traders do then i’d be on the lower timeframes there is no way id be wasting my precious time sitting looking at screens so that realisation probably strengthens my scalping beliefs.


    Obviously people are living diffrent and some peoples time is used up working so they have to trade higher timeframes and they cant give up there job until they know that what there doing is working for them, been there and got the t-shirt. its not an easy decision and sometimes a happy medium is required.


    I’m just rambling any way good luck !

    #262913 quote
    shugshug
    Participant
    Average

    I used to think, if i could see the screen of one of those good traders screen as they traded i might be able to duplicate that screen and make as much money as they did. I was wrong, id need that information but also id need the information in his/her head along with there confidence and beliefs as well as a good chunk of cash to get the same results or simular. Any trading system is only as good as the time and effort you put into it to convince yourself its worth risking money on or not. The way I do my trials and errors with trading systems is that I go as little a point for as long as it takes to strengthen my beliefs in that system before raising the stakes, if it takes a month it takes a month if it takes a year its a year well spent. I might be able to test the same thing by programming it and letting that go over past data or present data but there could be a posibility that it might get it wrong and give me a faulse sense of security which in turn could be costly. There might be hiden varables the program didnt take into consideration or fees or something else that effects it. The same things apply when using a demo account, no emotion needed, its not real money, its not your hard earned money thats at stake so diffrent decisions will be made. they are good however for learning the trading platform your intent on using. Sounds easy when looking at trading when getting into it, hell, use my index finger to click a mouse while sitting on a nice comfortable chair and make more money in a day than i made carring bricks up a ladder all week. The market has a way of humbling everyone who gets into it esspecially stuborn people who refuse to cut losses and refuse to put a lot of effort into 1 thing long enough.

    Just a thought or 2

    GraHal thanked this post
    #262920 quote
    GraHalGraHal
    Participant
    Legend


    shug wrote: I go as little a point for as long as it takes to strengthen my beliefs in that system before raising the stakes

    I did exactly the same Shug!

    Also after nearly getting wiped out (a few times!) going back on minimum position size requires loads of patience after trading on much bigger sizes.

    #262921 quote
    shugshug
    Participant
    Average

    Its a bit like boxing, you take a few hits but get back up and learn how not to get hit so hard next time LOL

    #262922 quote
    shugshug
    Participant
    Average

    I have been taking some trades on those 30 second charts you have traded on, didnt take much time for me to get into it fast and furious but to me tunning into the 30 second chart isnt that bad, in the past i wouldnt have dreamed about trading 30 second charts but i see the advantages with really tight stops ect

    #262923 quote
    shugshug
    Participant
    Average

    Not sure if things are changing via A.I I have noticed on a few charts big bars appearing random, a lot more random than usual at strange times, i did look at announcements etc to see what was going on but couldnt find anything. Is it manipulation to ‘get retail traders’ i have no idea but i have been trading a lot of years and it just feels like there is a change of some sort, anyone who watches the charts as i do has to have noticed it as well

    #262926 quote
    shugshug
    Participant
    Average

    A question that comes up quite a lot is, how many trades does it take to get enough confidence in ‘the system’. Its not as clear cut to give a direct answer to. There is a number of factors involved in answering that question. 60 trades on a 1 min chart, 5 trades on a 4 hour chart, trading 2 months on a daily timeframe. It isnt clear cut, depends on a lot of factors i have just mentioned a couple. Someone might get confidence quicker than someone else so this is why its a good idea to go lower on your trades to start with and the longer you can do that the better. In order to experience all market conditions it takes time but a lot of people want to make money quickly as possible, a lot of people don’t want to put the effort required in to the game to master it and even when you think you mastered it there is still suprises so it takes effort to adapt to re evaluate, sometimes your better sitting on your hands. Watch it for a time and when you get your confidence back re enter again.

    A number of times I thought thats it i have cracked the code i’m going to be a millionare in no time then the market showed me whos boss LOL


    #262927 quote
    shugshug
    Participant
    Average

    1 more thing id like to mention is expectation, reason i’m saying this is I can recall saying to myself I’d be happy if i made £200 a week, then that changed to 400 a week then a thowsand a week after that id be happy with £5000 a week, I think you people will relate to that. Id suggest not to do it, because unconsciously you are setting yourself up to only get £200 a week, you put an unconscious restriction in your mind and thats all you will end up getting. On the other hand if you start with wanting £5000 a week, depending on your account size and risk appatite, you have an unrealistic goal, esspecially if you have a small account.


    Id suggest to be ambiguios and be thankful if you come out without a loss at the end of the week.

    #263077 quote
    shugshug
    Participant
    Average

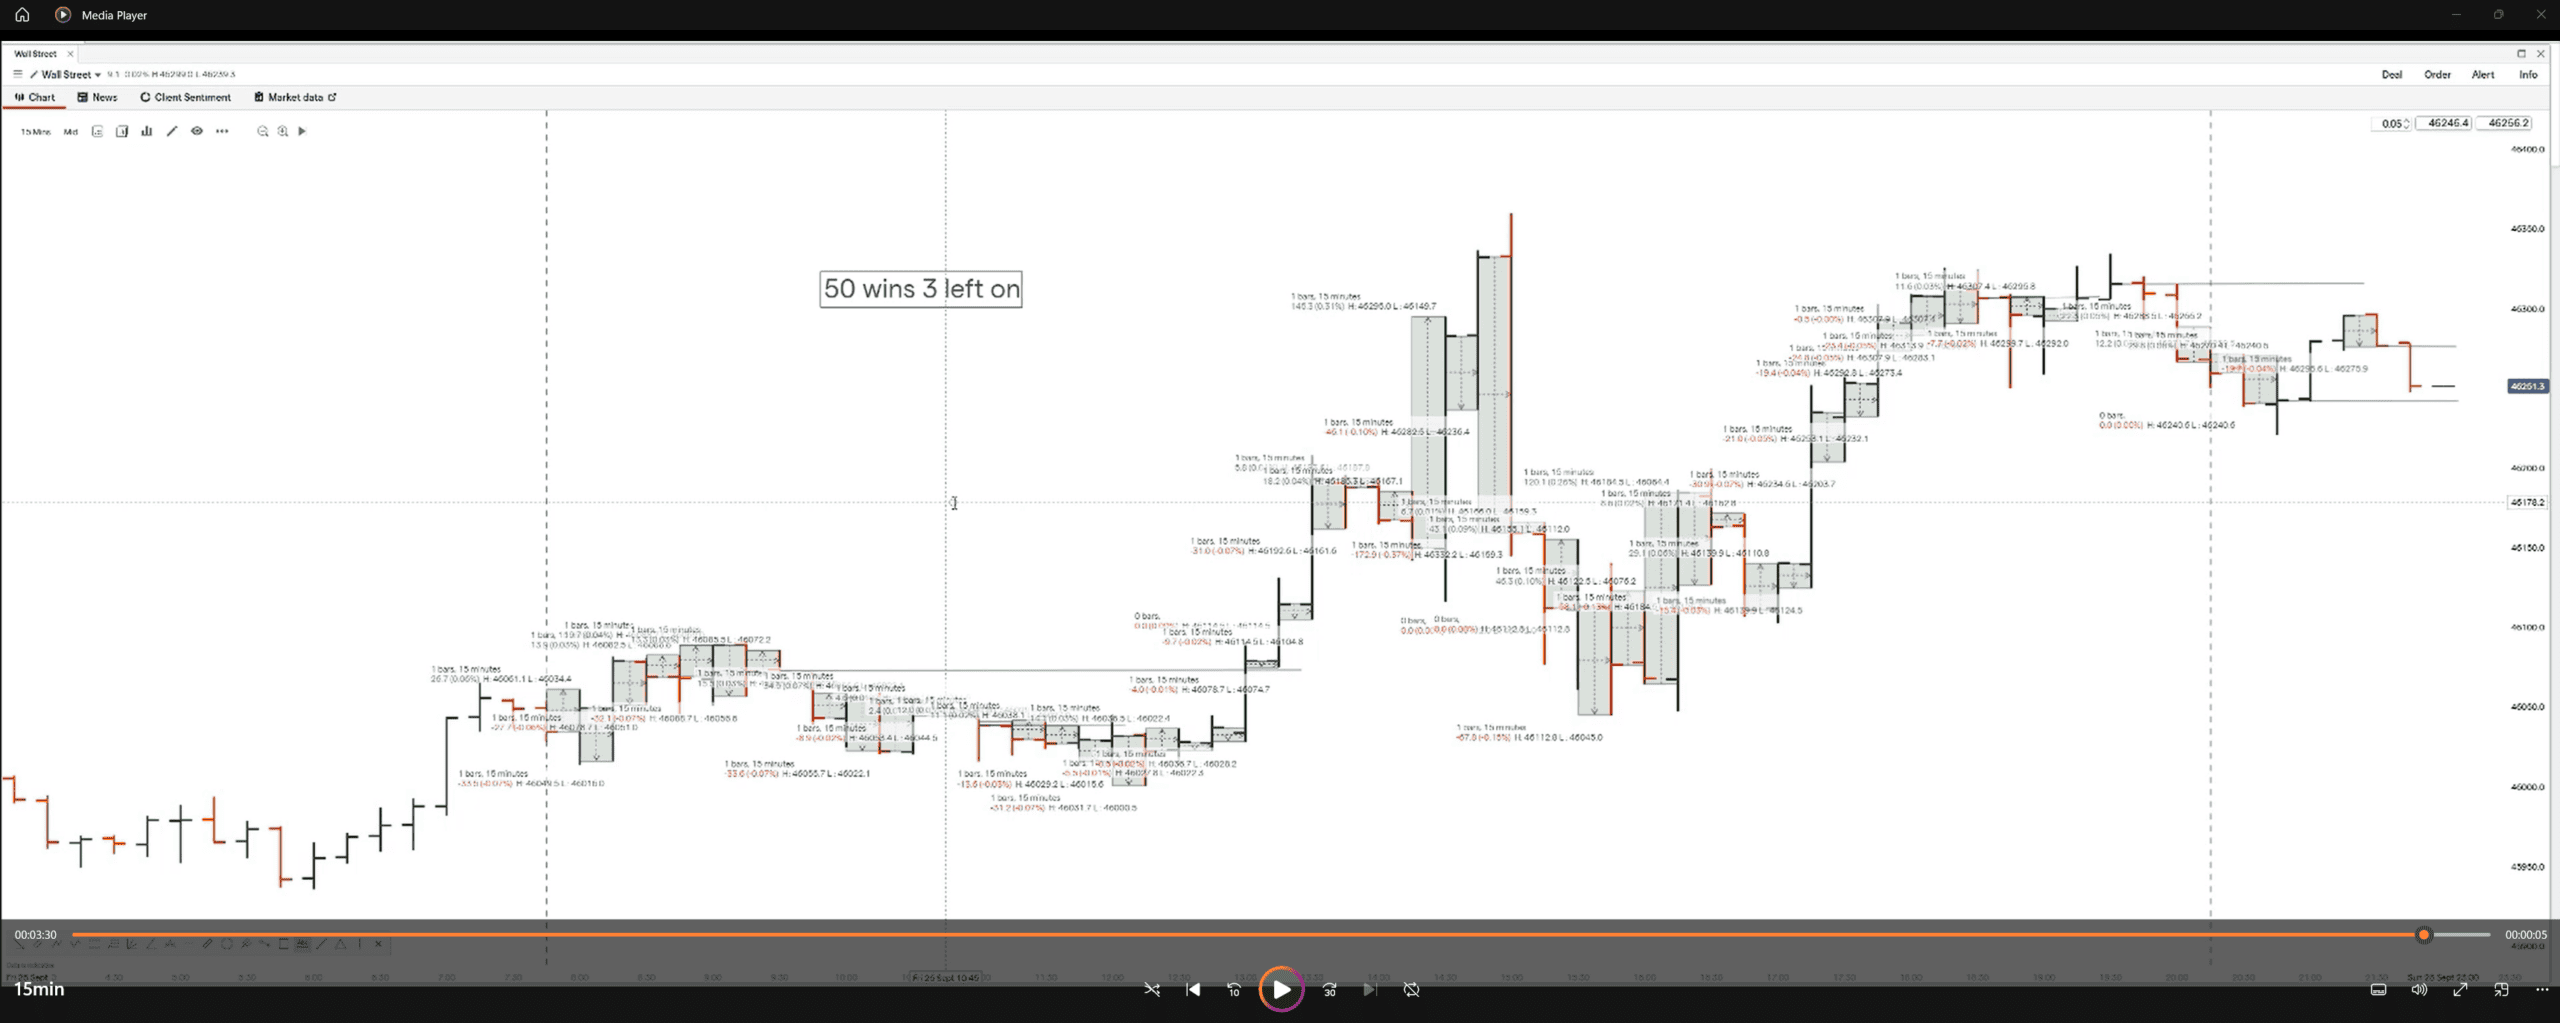
    Another one of my attempts at using price action. a short video uploaded to youtube here…


    The idea was simple, 15 min chart of wall street, if the bar/candle closed red buy, if candle closed green sell, thats it. lets see how i got on.

    #263078 quote
    shugshug
    Participant
    Average

    #263080 quote
    shugshug
    Participant
    Average

    Video link didn’t appear so here is a screenshot

    GraHal thanked this post
    Screenshot-2026-08-01-121614-scaled.png Screenshot-2026-08-01-121614-scaled.png
    #265213 quote
    shugshug
    Participant
    Average

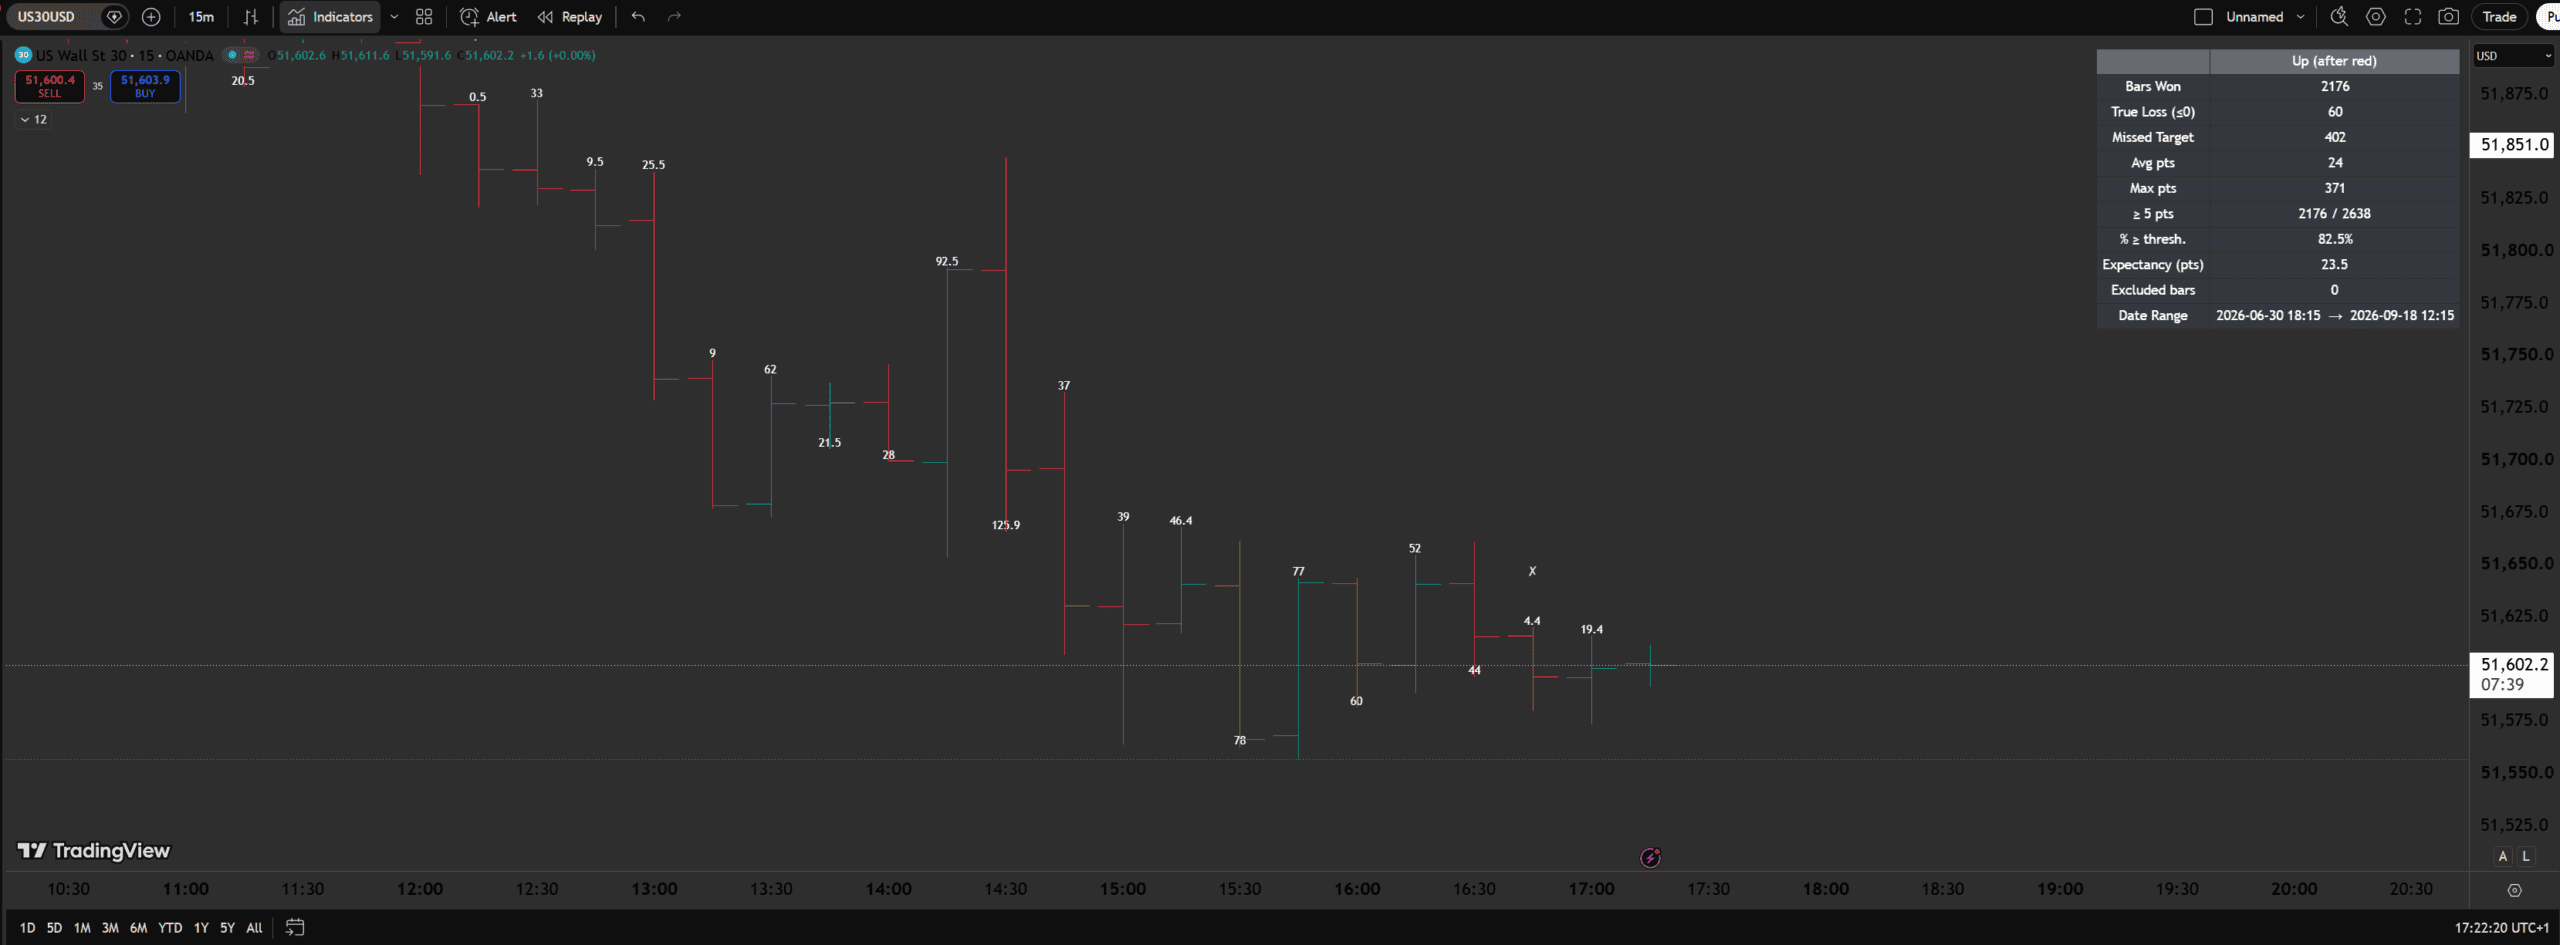
    playing with claud to do some pine script for reversing a 15 min bar on wall st

    Screenshot-2026-09-18-172231-scaled.png Screenshot-2026-09-18-172231-scaled.png
    #265214 quote
    shugshug
    Participant
    Average

    the above was just buy trades (buying red bars for 5 points or whatever i set it for) the results were very slightly diffrent for just selling, not a lot of diffrence in the 2, the numbers on the bars are from close of the bar to how many points in your favour it goes just on the next bar, the higher the timeframe used the better it gets up to over 90% chance of gaining at least x amount of points. no stop loss installed yet and i didnt turn it into a strategy, just an indicator.


    //@version=5

    indicator(“Opposite-Direction Extreme (Points)”, overlay=true, max_labels_count=500)


    // ── Inputs ─────────────────────────────────────────────────────────

    showLabels   = input.bool(true, “Show labels”)

    downMoveClr  = input.color(color.new(color.red, 0),   “Label color — down move (after green bar)”)

    upMoveClr    = input.color(color.new(color.lime, 0),  “Label color — up move (after red bar)”)

    lblSize      = input.string(size.small, “Label size”,

                     options = [size.tiny, size.small, size.normal, size.large])

    decimals     = input.int(1, “Decimal places”, minval = 0, maxval = 4)


    showTable    = input.bool(true, “Show stats table”)

    minThreshold = input.float(10.0, “Min favourable move (points)”, minval = 0)

    tablePos     = input.string(position.top_right, “Table position”,

                     options = [position.top_right, position.top_left, position.bottom_right, position.bottom_left])

    resetDaily   = input.bool(false, “Reset counts each new day”)


    // ── New: Table view ───────────────────────────────────────────────

    tableFilter  = input.string(“Both”, “Table view”, options = [“Both”, “Up only”, “Down only”], group = “Table”)

    showMissX    = input.bool(true, “Show ‘X’ on bars that missed the target”, group = “Table”)

    missColor    = input.color(color.new(color.orange, 0), “Missed-target ‘X’ color”, group = “Table”)


    // ── New: Trading hours & exclusions ──────────────────────────────────

    restrictTradingHours = input.bool(false, “Restrict calculations to trading hours”, group = “Trading Hours & Exclusions”)

    tradingSession        = input.session(“0000-2359”, “Trading hours (exchange time)”, group = “Trading Hours & Exclusions”)

    enableExclusions      = input.bool(false, “Exclude specific times from calculation”, group = “Trading Hours & Exclusions”)

    excludeTimesStr       = input.string(“”, “Times to exclude (comma-separated HH:mm, exchange time, e.g. 09:00,13:30)”, group = “Trading Hours & Exclusions”)


    // ── Logic ──────────────────────────────────────────────────────────

    // bar[1] = the bar that just closed green/red

    // current bar = the “next” bar — we measure its extreme in the

    // OPPOSITE direction, measured from bar[1]’s close.


    prevGreen = close[1] > open[1]

    prevRed   = close[1] < open[1]


    var float pts    = na

    var bool  isDown = false   // true = measuring a drop (after a green bar)

    var bool  valid  = false


    if prevGreen

        // prior bar was green -> opposite direction = down

        // how far did THIS bar’s low drop below the prior close?

        pts   := close[1] – low

        isDown:= true

        valid := true

    else if prevRed

        // prior bar was red -> opposite direction = up

        // how far did THIS bar’s high rise above the prior close?

        pts   := high – close[1]

        isDown:= false

        valid := true

    else

        valid := false


    // ── New: is this bar inside the allowed trading window? ──────────────

    // Restricts BOTH the labels and the stats to only the times you want

    // to trade, and lets you switch specific times “off” one by one so you

    // can compare the table with/without them.

    inSession = restrictTradingHours ? not na(time(timeframe.period, tradingSession)) : true


    hh = hour(time)

    mm = minute(time)

    curHHMM = (hh < 10 ? “0” : “”) + str.tostring(hh) + “:” + (mm < 10 ? “0” : “”) + str.tostring(mm)


    isExcludedTime = false

    if enableExclusions and str.length(excludeTimesStr) > 0

        excludedArr = str.split(excludeTimesStr, “,”)

        for t in excludedArr

            if str.trim(t) == curHHMM

                isExcludedTime := true


    isTradingTime = inSession and not isExcludedTime


    // Only draw once the bar is actually closed (so the number can’t repaint)

    // style_none = plain text only, no pin/box shape

    if showLabels and valid and barstate.isconfirmed and isTradingTime

        if isDown

            label.new(bar_index, low, str.tostring(pts, “#.” + str.repeat(“#”, decimals)),

                 style     = label.style_none,

                 textcolor = downMoveClr,

                 size      = lblSize)

        else

            label.new(bar_index, high, str.tostring(pts, “#.” + str.repeat(“#”, decimals)),

                 style     = label.style_none,

                 textcolor = upMoveClr,

                 size      = lblSize)


    // ── New: ‘X’ mark on bars that didn’t reach the target ────────────────

    if showMissX and valid and barstate.isconfirmed and isTradingTime and pts < minThreshold

        barRange = high – low

        xOffset  = barRange > 0 ? barRange * 0.6 : syminfo.mintick * 10

        if isDown

            label.new(bar_index, low – xOffset, “✗”, style = label.style_none, textcolor = missColor, size = lblSize)

        else

            label.new(bar_index, high + xOffset, “✗”, style = label.style_none, textcolor = missColor, size = lblSize)


    // ── Stats tracking ─────────────────────────────────────────────────

    var int   upCount        = 0

    var int   downCount      = 0

    var int   upAtLeastCount = 0   // up moves that hit at least minThreshold pts (WINS)

    var int   downAtLeastCount = 0 // down moves that hit at least minThreshold pts (WINS)

    var int   upNoFavCount   = 0   // “up” bars that never moved favourably at all (pts <= 0)

    var int   downNoFavCount = 0   // “down” bars that never moved favourably at all (pts <= 0)

    var float upSum          = 0.0

    var float downSum        = 0.0

    var float upMax          = 0.0

    var float downMax        = 0.0

    var float upWinSum       = 0.0   // sum of pts on bars that hit the threshold (for avg win)

    var float upLossSum      = 0.0   // sum of pts on bars that missed the threshold (for avg loss)

    var float downWinSum     = 0.0

    var float downLossSum    = 0.0

    var int   excludedCount  = 0   // bars that would have counted but were outside trading hours / excluded

    var int   firstBarTime   = na  // timestamp of the first bar loaded on the chart

    var int   firstStatTime  = na  // timestamp of the first bar actually counted into the stats

    lastBarTime = time             // timestamp of the current bar (== last bar once barstate.islast)


    if na(firstBarTime)

        firstBarTime := time

    if na(firstStatTime) and valid and barstate.isconfirmed and isTradingTime

        firstStatTime := time


    // optional daily reset

    newDay = ta.change(time(“D”)) != 0

    if resetDaily and newDay

        upCount           := 0

        downCount         := 0

        upAtLeastCount    := 0

        downAtLeastCount  := 0

        upNoFavCount      := 0

        downNoFavCount    := 0

        upSum             := 0.0

        downSum           := 0.0

        upMax             := 0.0

        downMax           := 0.0

        upWinSum          := 0.0

        upLossSum         := 0.0

        downWinSum        := 0.0

        downLossSum       := 0.0

        excludedCount     := 0


    if valid and barstate.isconfirmed

        if isTradingTime

            if isDown

                downCount   += 1

                downSum     += pts

                downMax     := math.max(downMax, pts)

                if pts >= minThreshold

                    downAtLeastCount += 1

                    downWinSum       += pts

                else

                    downLossSum      += pts

                if pts <= 0

                    downNoFavCount += 1

            else

                upCount     += 1

                upSum       += pts

                upMax       := math.max(upMax, pts)

                if pts >= minThreshold

                    upAtLeastCount += 1

                    upWinSum       += pts

                else

                    upLossSum      += pts

                if pts <= 0

                    upNoFavCount += 1

        else

            excludedCount += 1


    // ── Table ──────────────────────────────────────────────────────────

    fmt(x) => str.tostring(x, “#.” + str.repeat(“#”, decimals))


    f_fmtDate(t) =>

        y  = year(t)

        mo = month(t)

        d  = dayofmonth(t)

        h  = hour(t)

        mi = minute(t)

        str.tostring(y) + “-“ + (mo < 10 ? “0” : “”) + str.tostring(mo) + “-“ + (d < 10 ? “0” : “”) + str.tostring(d) +

         ” “ + (h < 10 ? “0” : “”) + str.tostring(h) + “:” + (mi < 10 ? “0” : “”) + str.tostring(mi)


    showBoth = tableFilter == “Both”

    showUp   = tableFilter == “Up only”

    showDown = tableFilter == “Down only”

    tableCols = showBoth ? 3 : 2


    // 11 rows: header, Bars Won, True Loss, Missed Target, Avg pts, Max pts,

    // ≥ threshold, % ≥ threshold, Expectancy, Excluded bars, Date Range

    var table statsTable = table.new(tablePos, tableCols, 11, border_width = 1)


    f_putRow(rowIdx, labelTxt, upVal, downVal) =>

        table.cell(statsTable, 0, rowIdx, labelTxt, text_color = color.white, bgcolor = color.new(color.black, 30))

        if showBoth

            table.cell(statsTable, 1, rowIdx, upVal,   text_color = color.white, bgcolor = color.new(color.black, 30))

            table.cell(statsTable, 2, rowIdx, downVal, text_color = color.white, bgcolor = color.new(color.black, 30))

        else if showUp

            table.cell(statsTable, 1, rowIdx, upVal,   text_color = color.white, bgcolor = color.new(color.black, 30))

        else

            table.cell(statsTable, 1, rowIdx, downVal, text_color = color.white, bgcolor = color.new(color.black, 30))


    if showTable and barstate.islast

        upAvg   = upCount   > 0 ? upSum   / upCount   : 0.0

        downAvg = downCount > 0 ? downSum / downCount : 0.0


        // “Won” = reached the min favourable move threshold; “Lost” = didn’t

        upWon    = upAtLeastCount

        upLost   = upCount   – upAtLeastCount

        downWon  = downAtLeastCount

        downLost = downCount – downAtLeastCount


        // Expectancy (pts) = avg win × win% − avg loss × loss%

        // One number that folds win rate and payoff size together, so a

        // high win rate with tiny wins vs big losses will show up as

        // low/negative expectancy, and vice versa.

        upWinPct    = upCount   > 0 ? upWon   / upCount   : 0.0

        upLossPct   = upCount   > 0 ? upLost  / upCount   : 0.0

        downWinPct  = downCount > 0 ? downWon / downCount : 0.0

        downLossPct = downCount > 0 ? downLost / downCount : 0.0


        upAvgWin    = upWon    > 0 ? upWinSum    / upWon    : 0.0

        upAvgLoss   = upLost   > 0 ? upLossSum   / upLost   : 0.0   // typically ≤ minThreshold, may be negative

        downAvgWin  = downWon  > 0 ? downWinSum  / downWon  : 0.0

        downAvgLoss = downLost > 0 ? downLossSum / downLost : 0.0


        upExpectancy   = (upAvgWin   * upWinPct)   – (math.abs(upAvgLoss)   * upLossPct)

        downExpectancy = (downAvgWin * downWinPct) – (math.abs(downAvgLoss) * downLossPct)


        // header row

        table.cell(statsTable, 0, 0, “”, bgcolor = color.new(color.gray, 20))

        if showBoth

            table.cell(statsTable, 1, 0, “Up (after red)”,     text_color = upMoveClr,   bgcolor = color.new(color.gray, 20))

            table.cell(statsTable, 2, 0, “Down (after green)”, text_color = downMoveClr, bgcolor = color.new(color.gray, 20))

        else if showUp

            table.cell(statsTable, 1, 0, “Up (after red)”,     text_color = upMoveClr,   bgcolor = color.new(color.gray, 20))

        else

            table.cell(statsTable, 1, 0, “Down (after green)”, text_color = downMoveClr, bgcolor = color.new(color.gray, 20))


        // Split “Bars Lost” into two distinct outcomes:

        // – True Loss: the bar actually moved against the setup (pts ≤ 0)

        // – Missed Target: the bar moved favourably, just not far enough

        //   to clear minThreshold (0 < pts < minThreshold)

        upTrueLoss      = upNoFavCount

        upMissedTarget  = upLost   – upNoFavCount

        downTrueLoss    = downNoFavCount

        downMissedTarget = downLost – downNoFavCount


        f_putRow(1, “Bars Won”,  str.tostring(upWon),  str.tostring(downWon))

        f_putRow(2, “True Loss (≤0)”,    str.tostring(upTrueLoss),     str.tostring(downTrueLoss))

        f_putRow(3, “Missed Target”,     str.tostring(upMissedTarget), str.tostring(downMissedTarget))

        f_putRow(4, “Avg pts”, fmt(upAvg), fmt(downAvg))

        f_putRow(5, “Max pts”, fmt(upMax), fmt(downMax))

        f_putRow(6, “≥ “ + fmt(minThreshold) + ” pts”, str.tostring(upAtLeastCount) + ” / “ + str.tostring(upCount), str.tostring(downAtLeastCount) + ” / “ + str.tostring(downCount))

        f_putRow(7, “% ≥ thresh.”, upCount > 0 ? fmt(upAtLeastCount / upCount * 100) + “%” : “—”, downCount > 0 ? fmt(downAtLeastCount / downCount * 100) + “%” : “—”)

        f_putRow(8, “Expectancy (pts)”, fmt(upExpectancy), fmt(downExpectancy))


        // ── Excluded-bar count, so you can see the effect of your

        // trading-hours / exclusion settings on the stats above ───────────

        table.cell(statsTable, 0, 9, “Excluded bars”, text_color = color.white, bgcolor = color.new(color.black, 30))

        table.cell(statsTable, 1, 9, str.tostring(excludedCount), text_color = color.white, bgcolor = color.new(color.black, 30))

        if showBoth

            table.cell(statsTable, 2, 9, “”, bgcolor = color.new(color.black, 30))


        // ── Date range actually being counted, so you can see at a glance

        // how much history the chart/feed has loaded (e.g. only 1 week on

        // some intraday symbols/feeds) ─────────────────────────────────────

        rangeTxt = na(firstStatTime) ? “—” : f_fmtDate(firstStatTime) + ”  →  “ + f_fmtDate(lastBarTime)

        table.cell(statsTable, 0, 10, “Date Range”, text_color = color.white, bgcolor = color.new(color.black, 30))

        table.cell(statsTable, 1, 10, rangeTxt, text_color = color.white, bgcolor = color.new(color.black, 30))

        if showBoth

            table.cell(statsTable, 2, 10, “”, bgcolor = color.new(color.black, 30))

            table.merge_cells(statsTable, 1, 10, 2, 10)


    #265215 quote
    shugshug
    Participant
    Average

    // ============================================================

    // Standard Deviation Channel (4x) – ProRealTime ProBuilder port

    // v2: channel is now a FIXED straight line drawn once across the

    // current lookback window (via DRAWSEGMENT + IsLastBarUpdate),

    // matching TradingView’s behavior, instead of a per-bar rolling

    // regression plotted with RETURN (which looked wavy).

    // ============================================================

    // STILL NOT INCLUDED (see chat for details):

    // – Weekly/Monthly/Yearly H/L lines + labels: no persistent

    //  line/label drawing equivalent for that use case.

    // – alertcondition(): set alerts from PRT’s Alert manager.

    // – Filled/shaded bands between channel lines: ProBuilder has

    //  no area-fill instruction for drawn objects, only lines.

    // ============================================================


    //—- Parameters (all editable in the indicator Settings panel) —-

    Length = 128    //Regression/StdDev lookback


    ShowDev1 = 1     //1 = show, 0 = hide

    Mult1 = 1

    ShowDev2 = 1

    Mult2 = 2

    ShowDev3 = 0

    Mult3 = 3

    ShowDev4 = 0

    Mult4 = 4


    ShowPearsonR = 0   //1 = plot Pearson’s R value, 0 = hide


    //– Moving averages (set ShowMAx = 0 to hide) —

    //MA type codes: 1 = SMA, 2 = EMA, 3 = WMA, 4 = SMMA(RMA)

    ShowMA1 = 0

    MA1Type = 2

    MA1Length = 20

    ShowMA2 = 0

    MA2Type = 2

    MA2Length = 50

    ShowMA3 = 0

    MA3Type = 1

    MA3Length = 100

    ShowMA4 = 0

    MA4Type = 1

    MA4Length = 200


    //—- Linear regression over “Length” bars ending at the current bar —-

    // pos = 0 is the oldest bar in the window, pos = Length-1 is the current bar

    sumX = 0

    sumY = 0

    sumXY = 0

    sumX2 = 0


    FOR k = 0 TO Length – 1 DO

    pos = (Length – 1) – k

    sumX = sumX + pos

    sumY = sumY + close[k]

    sumXY = sumXY + pos * close[k]

    sumX2 = sumX2 + pos * pos

    NEXT


    denom = Length * sumX2 – sumX * sumX

    IF denom <> 0 THEN

    slope = (Length * sumXY – sumX * sumY) / denom

    ELSE

    slope = 0

    ENDIF


    avgY = sumY / Length

    intercept = avgY – slope * sumX / Length


    BaseLine = intercept + slope * (Length – 1)  //regression value at current bar


    //—- Standard deviation of residuals + Pearson’s R —-

    sumSqDiff = 0

    dsxx = 0

    dsyy = 0

    dsxy = 0

    regMid = intercept + slope * (Length – 1) / 2


    FOR k = 0 TO Length – 1 DO

    pos = (Length – 1) – k

    predicted = intercept + slope * pos

    diff = close[k] – predicted

    sumSqDiff = sumSqDiff + diff * diff

    dxt = close[k] – avgY

    dyt = predicted – regMid

    dsxx = dsxx + dxt * dxt

    dsyy = dsyy + dyt * dyt

    dsxy = dsxy + dxt * dyt

    NEXT


    StdDev = SQRT(sumSqDiff / Length)


    IF dsxx = 0 OR dsyy = 0 THEN

    PearsonR = 0

    ELSE

    PearsonR = dsxy / SQRT(dsxx * dsyy)

    ENDIF


    //—- Moving averages —-

    IF BarIndex = 0 THEN

    smma1 = close

    smma2 = close

    smma3 = close

    smma4 = close

    ELSE

    smma1 = (smma1[1] * (MA1Length – 1) + close) / MA1Length

    smma2 = (smma2[1] * (MA2Length – 1) + close) / MA2Length

    smma3 = (smma3[1] * (MA3Length – 1) + close) / MA3Length

    smma4 = (smma4[1] * (MA4Length – 1) + close) / MA4Length

    ENDIF


    IF ShowMA1 = 1 THEN

    IF MA1Type = 1 THEN

    MA1 = Average[MA1Length](close)

    ELSIF MA1Type = 2 THEN

    MA1 = ExponentialAverage[MA1Length](close)

    ELSIF MA1Type = 3 THEN

    MA1 = WeightedAverage[MA1Length](close)

    ELSE

    MA1 = smma1

    ENDIF

    ELSE

    MA1 = BaseLine

    ENDIF


    IF ShowMA2 = 1 THEN

    IF MA2Type = 1 THEN

    MA2 = Average[MA2Length](close)

    ELSIF MA2Type = 2 THEN

    MA2 = ExponentialAverage[MA2Length](close)

    ELSIF MA2Type = 3 THEN

    MA2 = WeightedAverage[MA2Length](close)

    ELSE

    MA2 = smma2

    ENDIF

    ELSE

    MA2 = BaseLine

    ENDIF


    IF ShowMA3 = 1 THEN

    IF MA3Type = 1 THEN

    MA3 = Average[MA3Length](close)

    ELSIF MA3Type = 2 THEN

    MA3 = ExponentialAverage[MA3Length](close)

    ELSIF MA3Type = 3 THEN

    MA3 = WeightedAverage[MA3Length](close)

    ELSE

    MA3 = smma3

    ENDIF

    ELSE

    MA3 = BaseLine

    ENDIF


    IF ShowMA4 = 1 THEN

    IF MA4Type = 1 THEN

    MA4 = Average[MA4Length](close)

    ELSIF MA4Type = 2 THEN

    MA4 = ExponentialAverage[MA4Length](close)

    ELSIF MA4Type = 3 THEN

    MA4 = WeightedAverage[MA4Length](close)

    ELSE

    MA4 = smma4

    ENDIF

    ELSE

    MA4 = BaseLine

    ENDIF


    PRPlot = ShowPearsonR * PearsonR


    //—- Fixed straight channel: drawn once, only on the current/last bar,

    //   spanning exactly the last “Length” bars – not recalculated per

    //   historical bar, so it no longer looks like a wavy moving average.

    IF IsLastBarUpdate THEN

    x1 = BarIndex – (Length – 1)

    x2 = BarIndex


    DRAWSEGMENT(x1, intercept, x2, BaseLine) COLOURED(128,128,128) STYLE(LINE,2)


    IF ShowDev1 = 1 THEN

    DRAWSEGMENT(x1, intercept + Mult1 * StdDev, x2, BaseLine + Mult1 * StdDev) COLOURED(0,0,255) STYLE(LINE,1)

    DRAWSEGMENT(x1, intercept – Mult1 * StdDev, x2, BaseLine – Mult1 * StdDev) COLOURED(255,0,0) STYLE(LINE,1)

    ENDIF

    IF ShowDev2 = 1 THEN

    DRAWSEGMENT(x1, intercept + Mult2 * StdDev, x2, BaseLine + Mult2 * StdDev) COLOURED(0,128,0) STYLE(LINE,1)

    DRAWSEGMENT(x1, intercept – Mult2 * StdDev, x2, BaseLine – Mult2 * StdDev) COLOURED(0,128,0) STYLE(LINE,1)

    ENDIF

    IF ShowDev3 = 1 THEN

    DRAWSEGMENT(x1, intercept + Mult3 * StdDev, x2, BaseLine + Mult3 * StdDev) COLOURED(255,140,0) STYLE(LINE,1)

    DRAWSEGMENT(x1, intercept – Mult3 * StdDev, x2, BaseLine – Mult3 * StdDev) COLOURED(255,140,0) STYLE(LINE,1)

    ENDIF

    IF ShowDev4 = 1 THEN

    DRAWSEGMENT(x1, intercept + Mult4 * StdDev, x2, BaseLine + Mult4 * StdDev) COLOURED(255,0,0) STYLE(LINE,1)

    DRAWSEGMENT(x1, intercept – Mult4 * StdDev, x2, BaseLine – Mult4 * StdDev) COLOURED(218,165,32) STYLE(LINE,1)

    ENDIF

    ENDIF


    //—- Output (must be a single unbroken line) —-

    RETURN MA1 AS “MA 1” COLOURED(255,255,0) STYLE(LINE,2), MA2 AS “MA 2” COLOURED(255,165,0) STYLE(LINE,2), MA3 AS “MA 3” COLOURED(255,0,0) STYLE(LINE,2), MA4 AS “MA 4” COLOURED(160,32,240) STYLE(LINE,2), PRPlot AS “Pearson’s R”


    #265216 quote
    shugshug
    Participant
    Average

    been playing with prorealtime with ai as well

Viewing 15 posts - 436 through 450 (of 465 total)
  • You must be logged in to reply to this topic.
ProRealAI ProRealAI New

Stuck on this ProBuilder code?

Describe what this topic is trying to build, in plain English, and ProRealAI writes the ProRealTime™ indicator, screener or system for you.

Available in 7 languages
Try ProRealAI

Trading without indicators


General Trading: Market Analysis & Manual Trading

New Reply
Author
author-avatar
shug @shug Participant
Summary

This topic contains 464 replies,
has 22 voices, and was last updated by GraHalGraHal
8 minutes ago.

Topic Details
Forum: General Trading: Market Analysis & Manual Trading
Language: English
Started: 07/30/2020
Status: Active
Attachments: 117 files
ProRealCode ProRealCode
Loading...