Bard
BardParticipant
Master
Afternoon @Nicolas, I got this reply from Ninza about there Implied Volatility Vix Fix code (because the won’t share the complete code with me) :
The original Williams VIX Fix just includes the bottom-catching algorithm.
Our indicator inverses that formula to add the (low volatility) top-catching algorithm, which is our improvement.
For the bottom-catching part, you can compare our indicator with other source-code versions on the internet to check the accuracy.
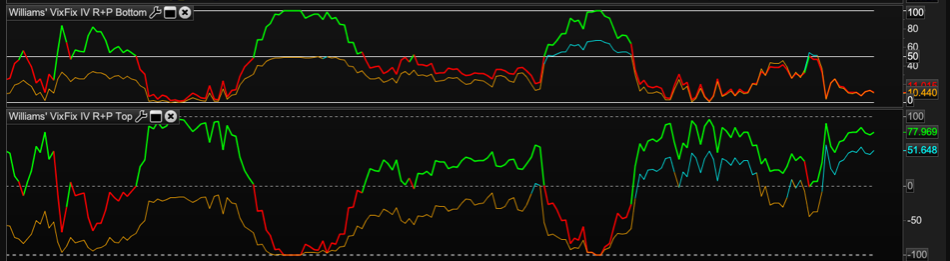
So.. it appears that we would need to amend the formula for the Williams’ Vix Fix High Volatility Market Bottoms code posted below here? :
wvf = ((highest[pd](close)-low)/(highest[pd](close)))*100
This IV indicator and specifically this line of code I think has been the basis for the confusion here and of which I’d asked a few times about the need to modify it in my Better Implied Volatility post and above (that’s my defence and I’m sticking to it!). I think by not modifying it (wfv) and using this code (wvflex) that seeks to establish extremes that is why we maybe only seeing mirror images between the two indicators from Vonasi’s and your conversion of his code, right? Re: mirroring, please refer to my image in my post #111235 just directly above or see this zoomed in scan of it posted here:
The top indicator is Vonasi’s conversion from my request here: https://www.prorealcode.com/topic/a-better-implied-volatility-rank-and-percentile-indicator/
Cheers,
Ps/ It’s now very tricky adding code here? I got this on the first submit:
<pre class=”lang:probuilder decode:true” title= “Williams’ Vix Fix High Volatility Market Bottom” etc.
Basically it’s only on editing my post that I can truly get the indicator code to display properly in a grey highlighted box using the latest Safari browser.
BardParticipant
Master
I think this has sorted it @Nicolas: — although red/green IV can rank high for market tops if you use wvflev =100- ((wvf- etc) and IF (wvflev[i]) < (wvflev) THEN
Low Implied Volatility Inverse Vix Fix (for Market Tops) with Rank, Percentile and Historic Rank:
//Implied Volatility Rank and Percentile Indicator — MARKET TOPS
//By Vonasi //Date 20191018

//settings
p = 365
vixfixperiod = 22

//Vix Fix - Implied Volatility Proxy

wvf = ((highest[vixfixperiod](close)-low)/(lowest[vixfixperiod](close)))*100

//Boundaries
upper = highest[p](wvf)
lower = lowest[p](wvf)

wvflev = ((wvf-lower)/(upper-lower)*100)

//Percentile
rnkCount = 0
count = 0
FOR i = 1 to p-1
count = count + 1
IF (wvflev[i]) > (wvflev) THEN
rnkCount = rnkCount + 1
endif
NEXT

PercentileRank = (rnkCount/count)*100

//colours
r = 255
g = 0
if wvflev >=50 then
r= 0
g = 255
endif

r1 = 255  //255
g1 = 160  //160
b1 = 0  //0

if PercentileRank >=95 then
r1 = 0
g1 = 255
b1 = 255
endif

//Historic Volatility

Length = 22
annualVol = 365
periods = 7// 1 = intraday chart 7 = daily chart

Price = log(close / close[1])
sigma = std[length](Price)
HVol = (sigma * sqrt(annualVol / periods)) * 100
lowVol = lowest[annualvol](HVol)
HVrankUp = HVol - lowVol
maxVol = highest[annualvol](HVol)
HVrankLow = maxVol - lowVol
HVR = (HVrankUp / HVrankLow)*100


RETURN 0 as "0%",95 as "95%",50 as "50%", HVR coloured(0,0,255) as "Historic Volatility Rank", wvflev coloured(r,g,0) style(line,4) as "Williams Low IV Vix Fix", PercentileRank coloured(r1,g1,b1) as "Percentile Rank"
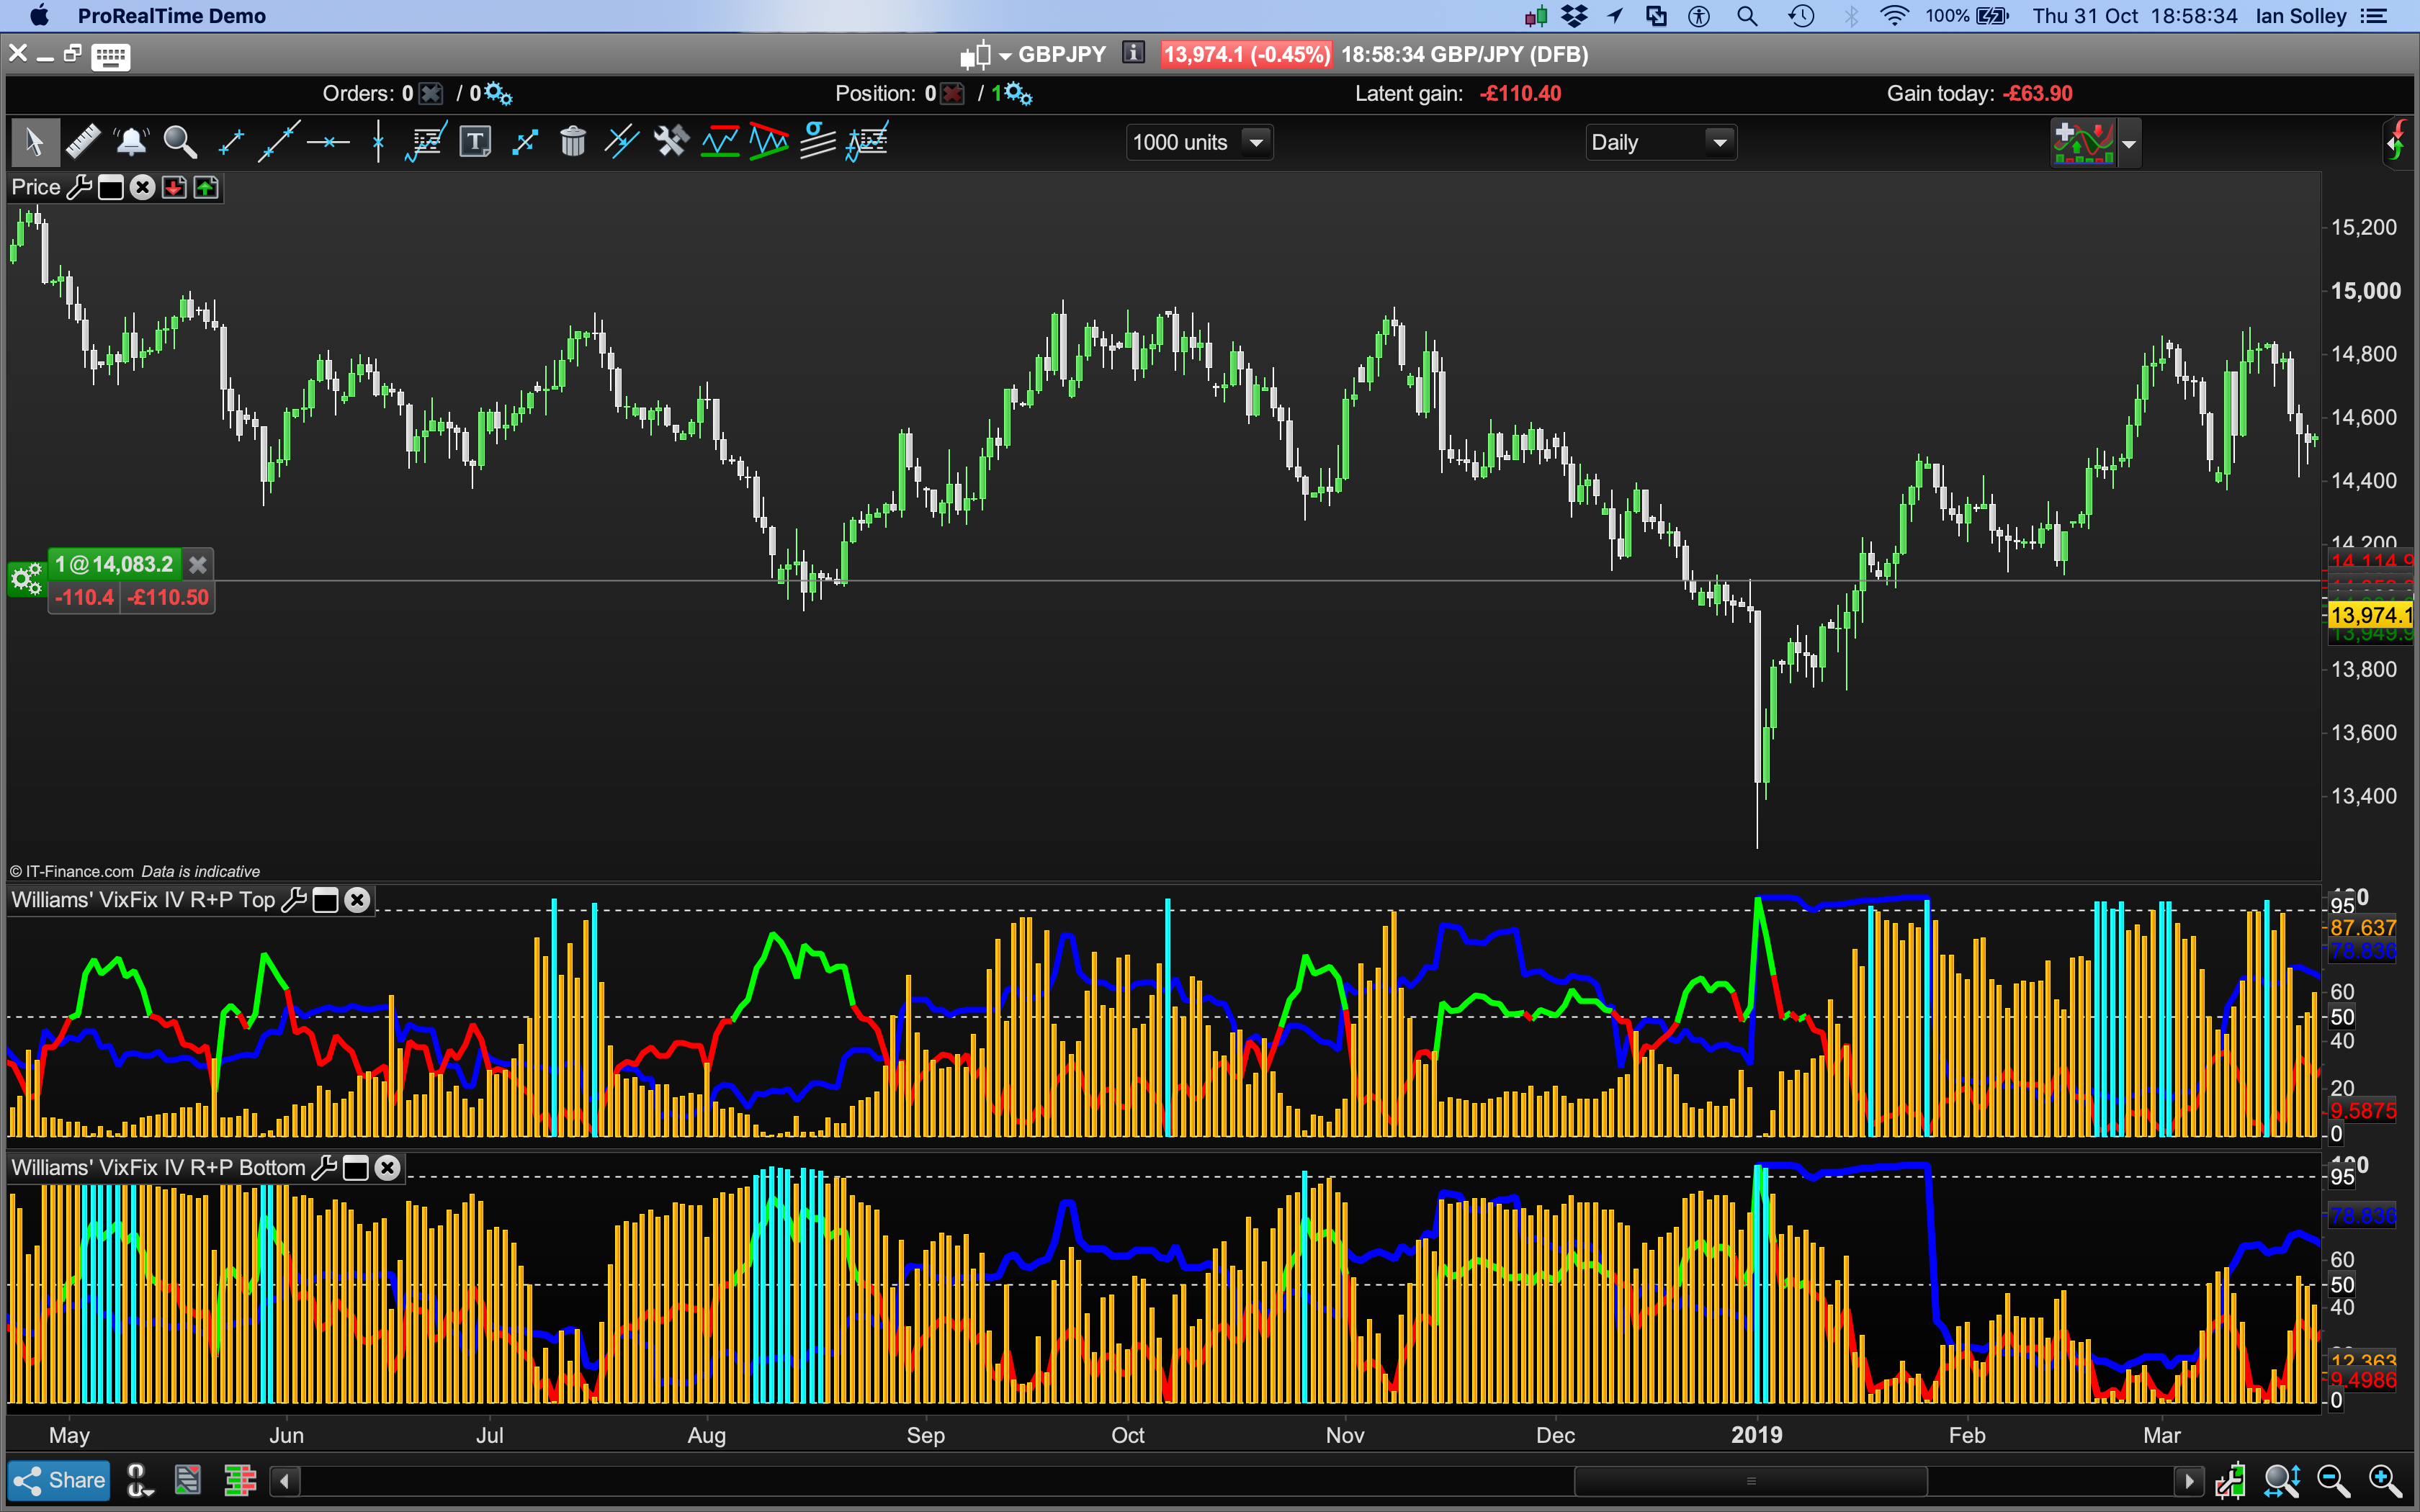
Ignore first image.
BardParticipant
Master
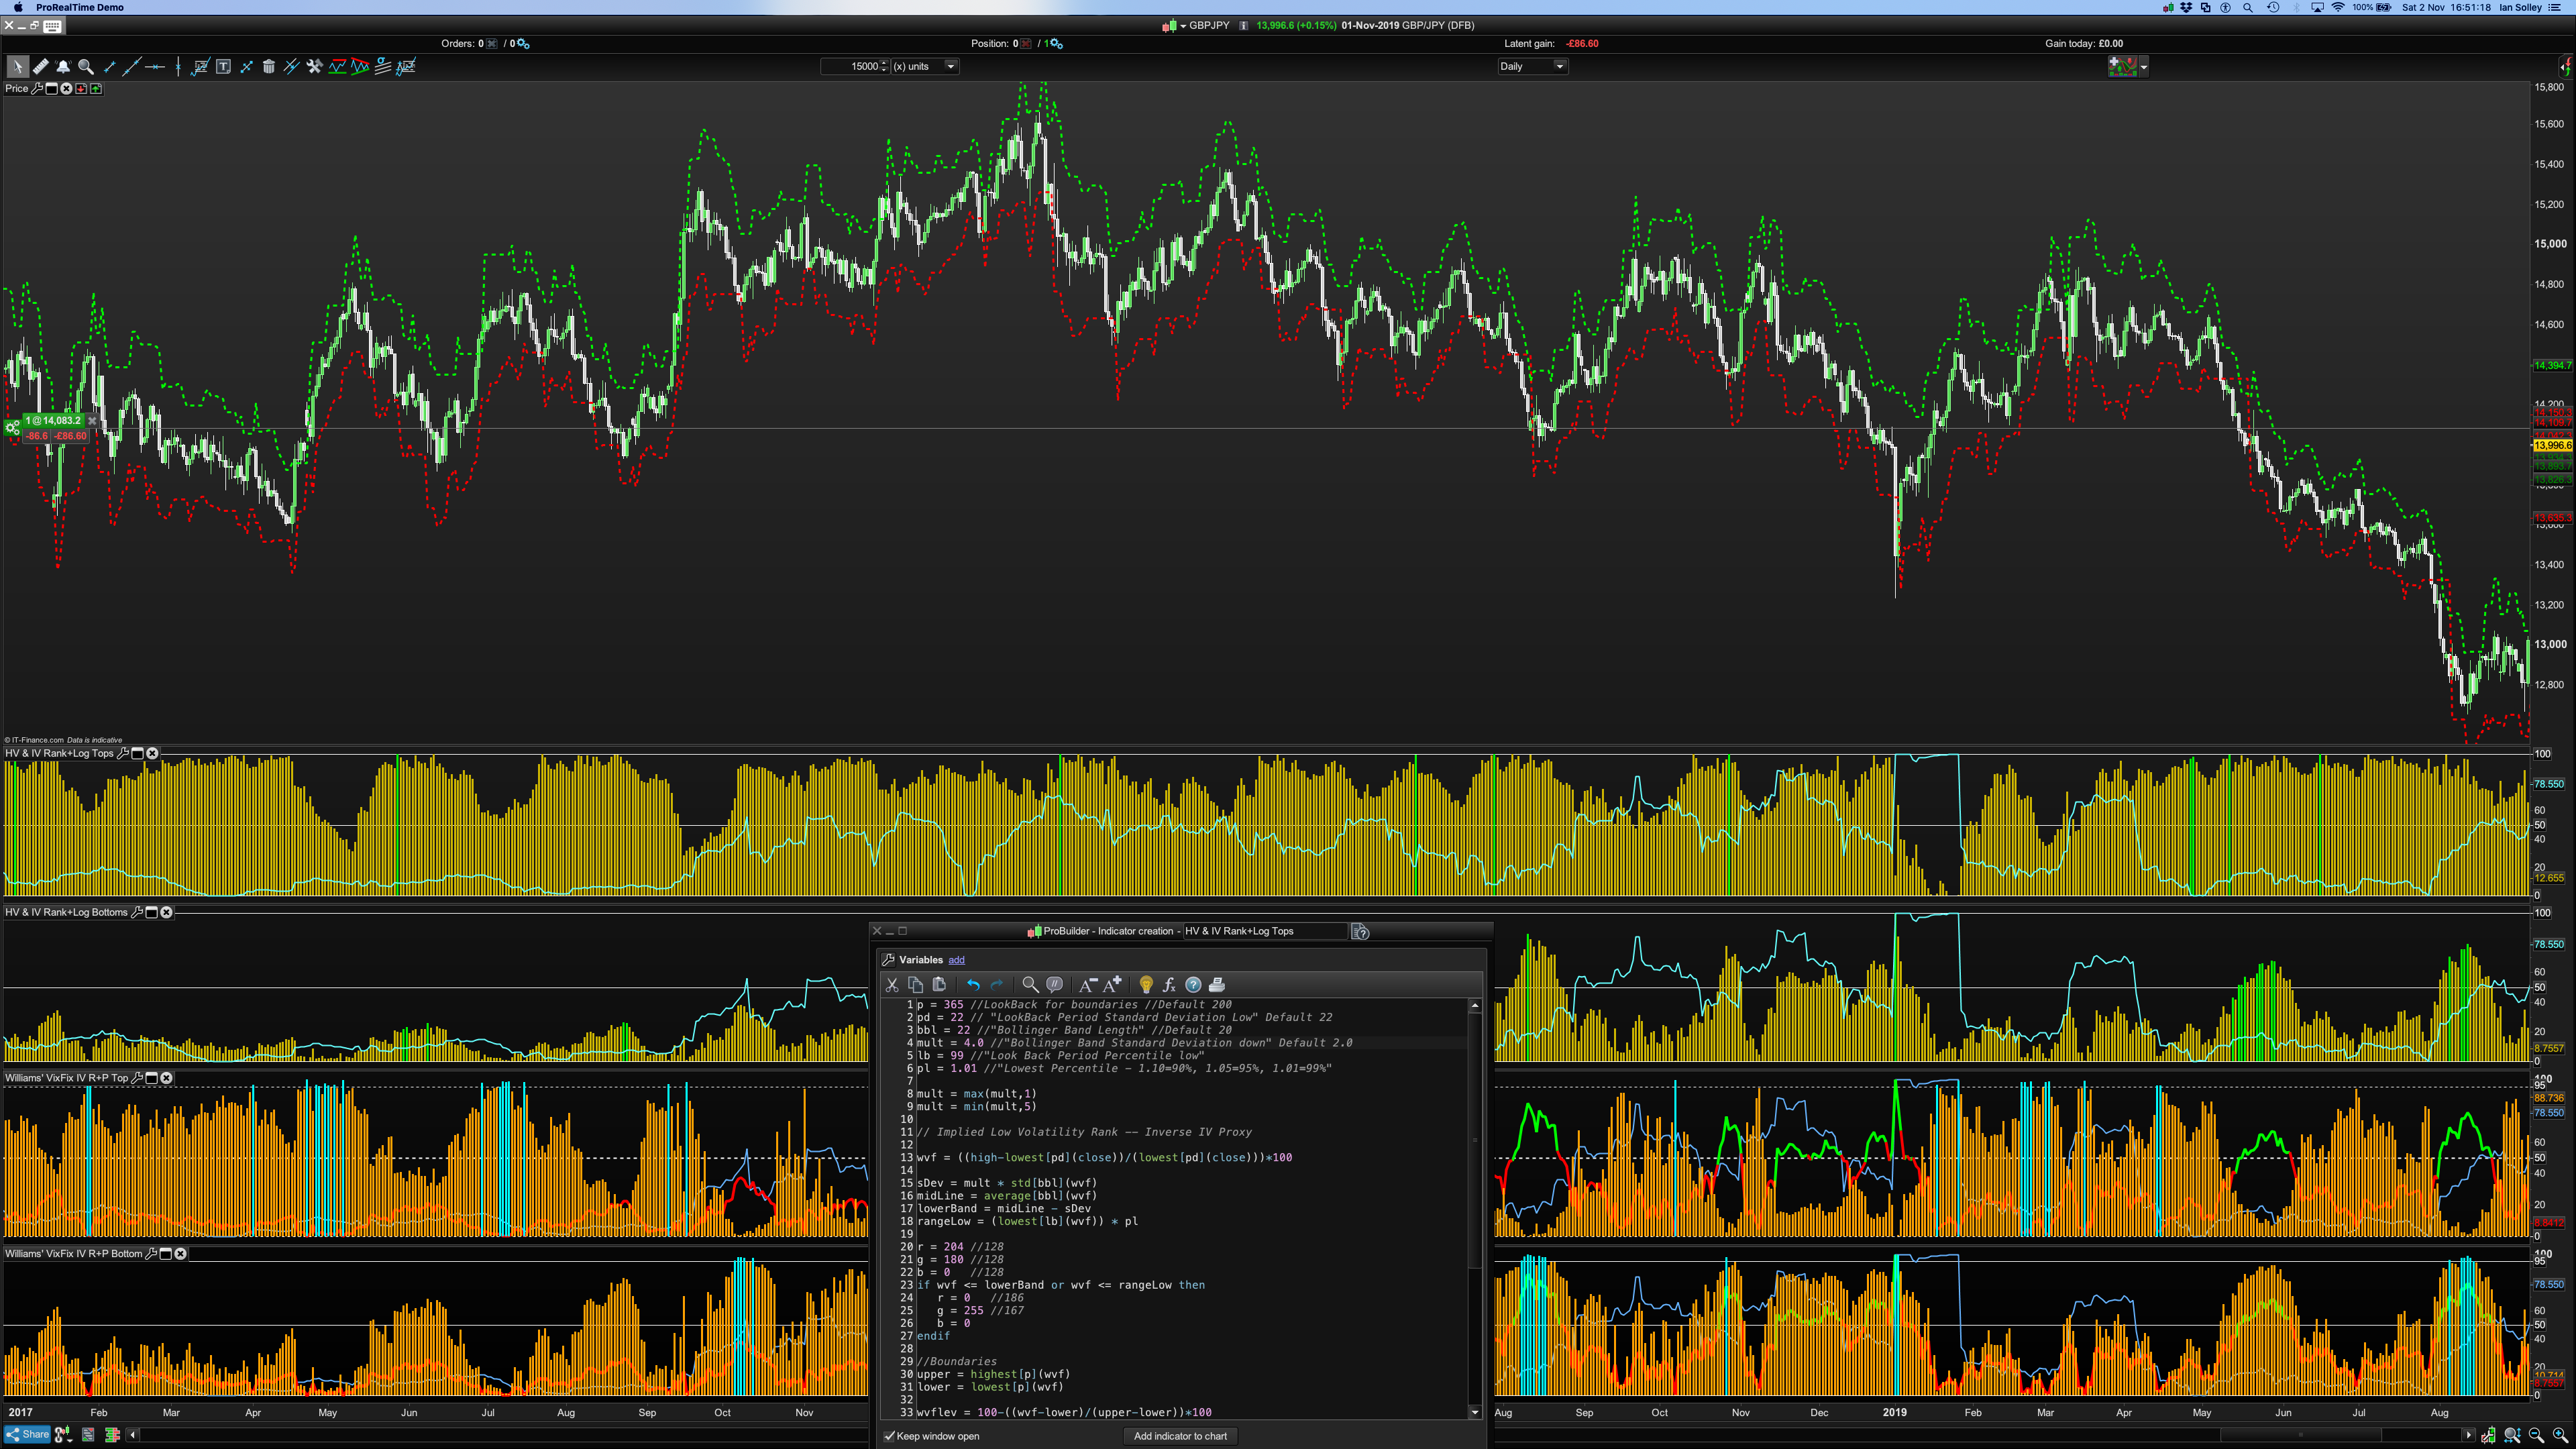
Creating an Inverse Low Volatility Vix Fix…
Larry Williams’ original High Volatility Vix Fix IV proxy is:
wvf = ((highest[pd](close)-low)/(highest[pd](close)))*100
I initially only changed the original High Vol Vix Fix denominator from highest to lowest, but logic tells me that the inverse of that high volatility wvf is not correct in line 10 above and should in fact be: (where pd = 22 periods)
wvf = ((high-lowest[pd](close))/(lowest[pd](close)))*100
..yet that produces a worse result for spotting market tops with green spike bars? Pls see images, the first being the correct code ( ((high-lowest[pd](close))/(lowest etc ). The top indicator (of four) is the one in question in both the attached images. Do you have any ideas please @Nicolas because these volatility indicators are great but they’re driving me nuts!? Lol.
Normal behavior as these peaks mark the candle when the new highest value of WVF is, so that the normalization is doing its job.
100% WVF is on that candle, so the oscillator is marking it with a spike in the curve.
BardParticipant
Master
Thanks @Nicolas, in your opinion though which would be the correct code to inverse the wvf code and find low volatility extremes:
wvfinverse = ((highest[pd](close)-low)/(lowest[pd](close)))*100
or
wvfinverse = ((high-lowest[pd](close))/(lowest[pd](close)))*100
Cheers,
The second one, as it is the almost exact same one as a Stochastic.
BardParticipant
Master
Cheers, that’s what I thought although for some reason the first produces far better indications of the market topping out.