Following on from this topic: https://www.prorealcode.com/topic/a-better-implied-volatility-rank-and-percentile-indicator
I would be grateful if we can get this indicator coded. I think this would be an essential addition to the PRC library and am wondering if it is possible to code an Historical Volatility (HV) and Implied Volatility (IV) Rank and Percentile Indicator. It would be particularly beneficial for Currency, Indices and Options traders but can be applied to most markets. IV can only ever be approximated as it is derived from the Black Scholes option pricing model.
Black, Scholes and Merton won the Nobel Prize for coming up with their options pricing model because it predicted the future probability and pricing of asset prices. Option pricing, historical and implied volatility are crucial in that understanding of future asset pricing. For thorough explanation on probabilities please see my explanations here:
https://www.prorealcode.com/topic/options-probabilities-using-the-black-scholes-assume-a-normal-distribution/
https://www.prorealcode.com/topic/a-better-implied-volatility-rank-and-percentile-indicator/#post-110512
Two things come to mind:
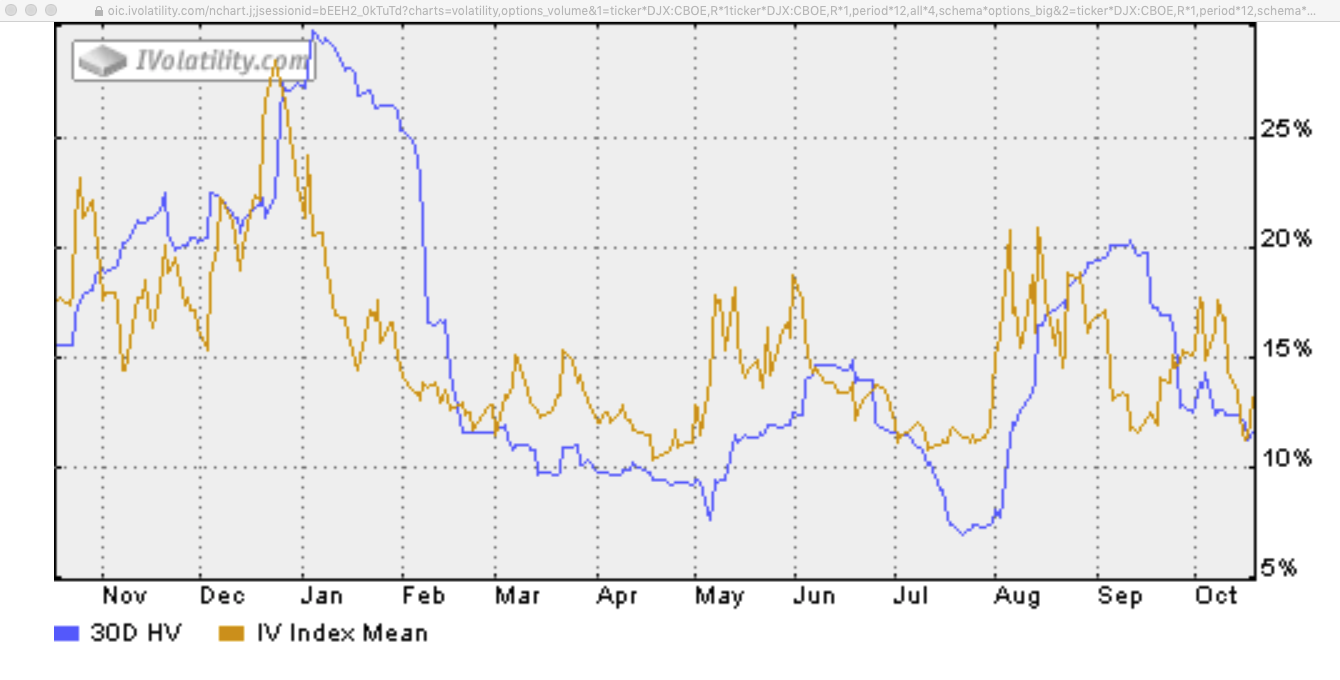
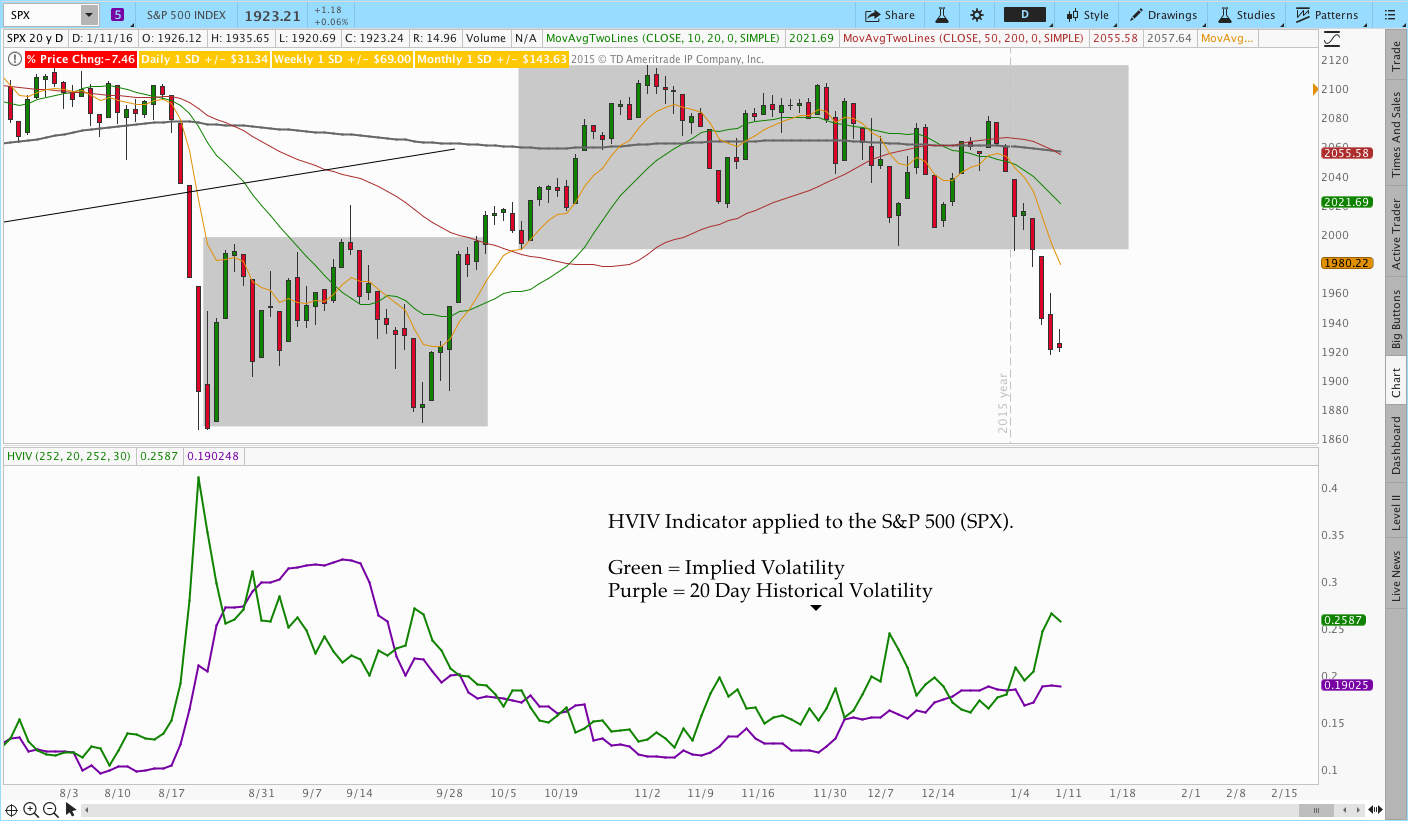
1) A comparison in the same indicator needs to be made between the HV and IV. Example: Please see the screen attached, it’s from ivolatility via the Options Council website:
https://www.optionseducation.org/toolsoptionquotes/historical-and-implied-volatility, it’s a blue and gold line graph of the HV v’s the IV. Other vendors also supply IV 30, IV 60 and IV 90 comparisons.
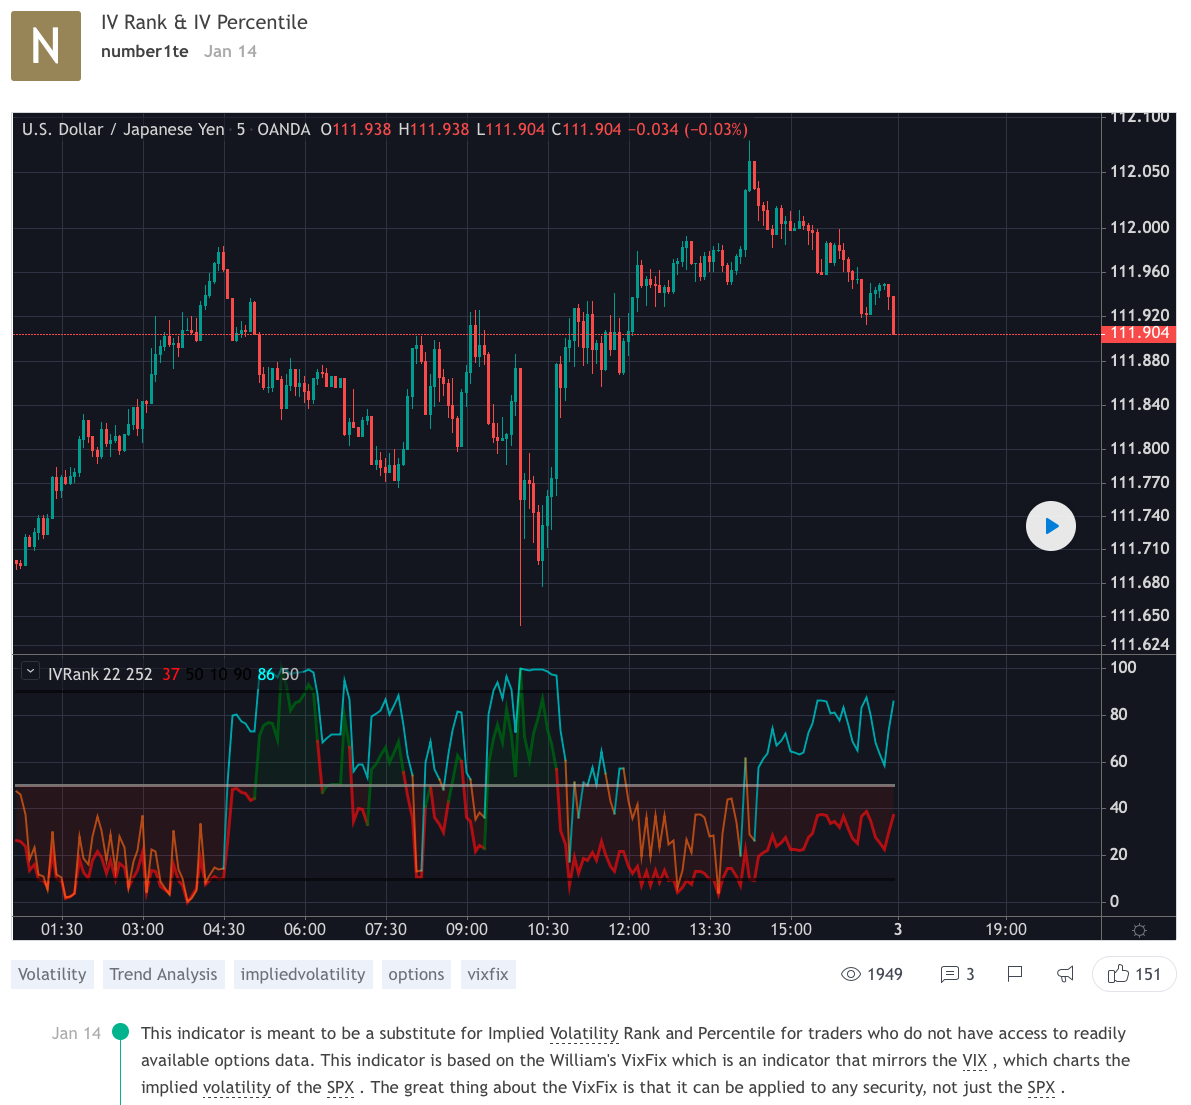
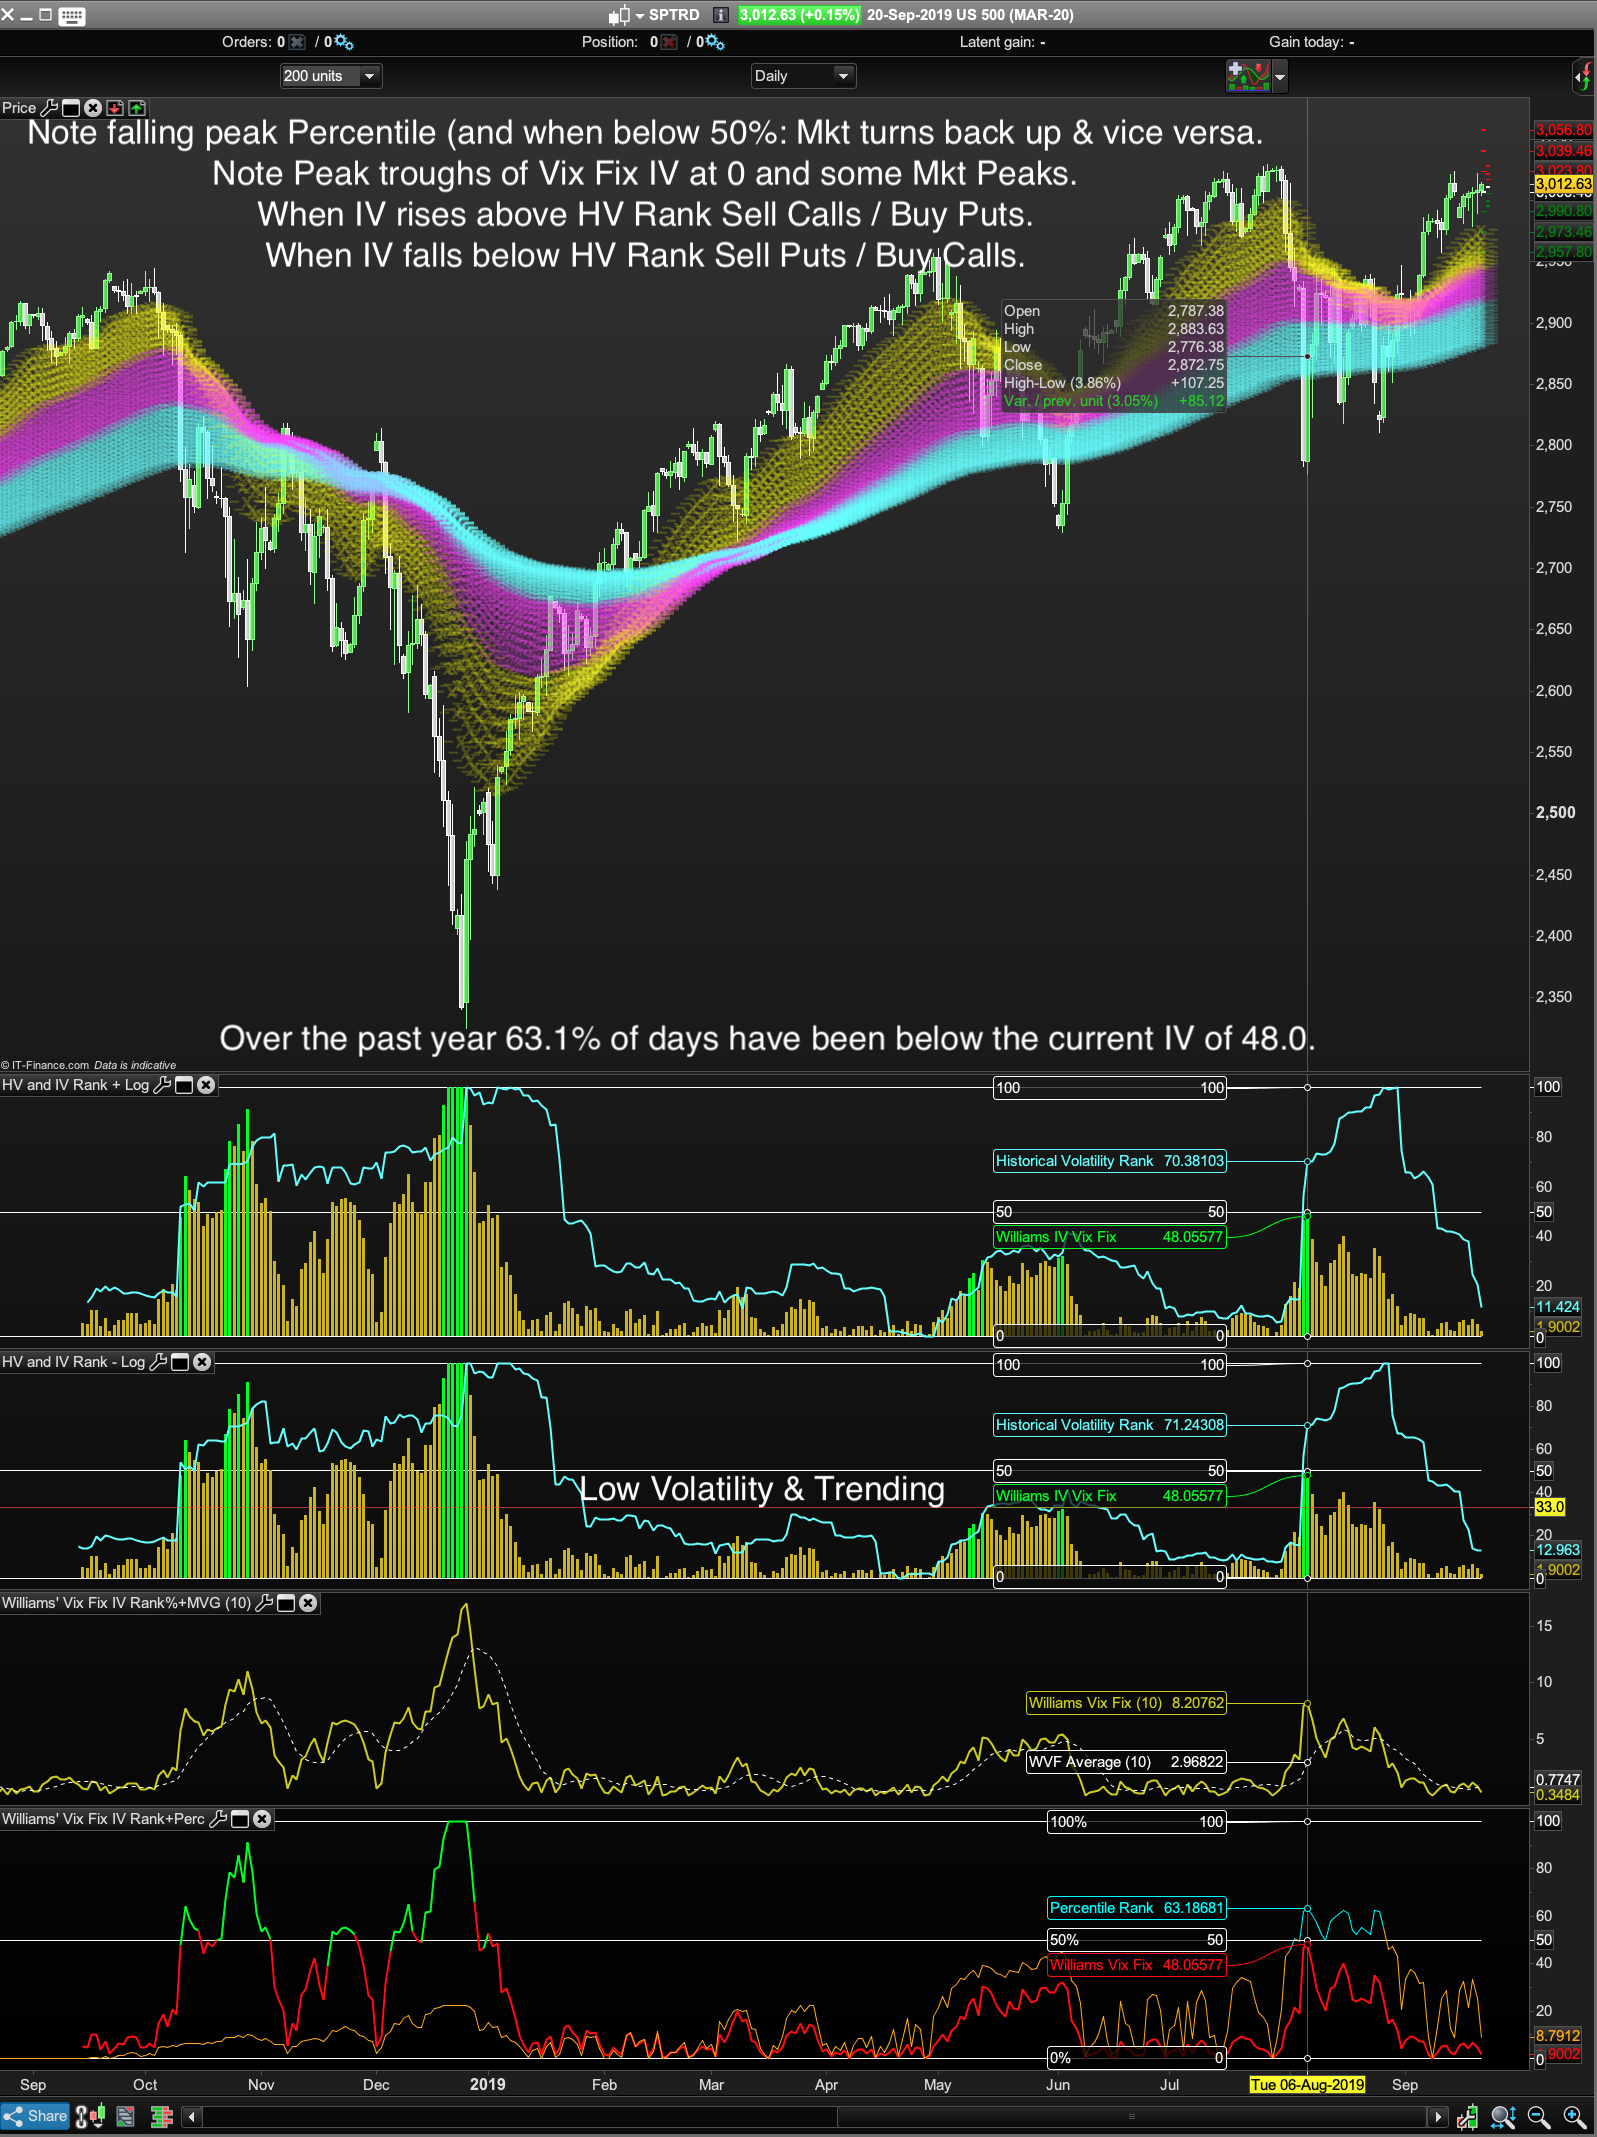
I was then hoping we could have an indicator like this one I found on Trading View (linked just below) so it shows not just the IV rank but also the Percentile (so it’s scaled by 100%).
The code is locked on Trading View but I am hoping it isn’t too far of the version I linked to above on PRC.
https://www.tradingview.com/script/Z30icKNi-IV-Rank-IV-Percentile/
“This indicator is meant to be a substitute for Implied Volatility Rank and Percentile for traders who do not have access to readily available options data. This indicator is based on the William’s VixFix which is an indicator that mirrors the VIX , which charts the implied volatility of the SPX. The great thing about the VixFix is that it can be applied to any security, not just the SPX.
IV Rank is calculated by taking the highest and lowest values over the past however many periods you choose, and seeing what percentage of the way between those values the current IV value is. For example if over the past 5 periods the highest IV value was 30 and the lowest IV value was 10, and the current is 20; then the IV Rank would be 50% because 20 is 50% of the way between 10 & 30.
IV Percentile is calculated by looking at all of the past values, not just the highest and lowest, and seeing how many of those values were below the current. (IVP tells you the percentage of time that the IV in the past has been lower than current IV). For example lets say over the past five periods the IV values were : 30,10,11,15, & 17; while the current IV value is 20. As stated before the IV Rank would be 50%, while the IV Percentile would be 80%, given that 4/5 of the values were below the current IV value of 20.
IV Rank and IV Percentile are often wrongly used interchangeably, but as shown here they are very different. Most people use IV Rank as their main options tool; while IV percentile is a great way to give IV Rank context. Whichever you choose to use, or even both, does not really matter as long as you use either one or both consistently.
IV Rank and IV Percentile are mainly used in this way: when IVR/IVP <50, buy options, when IVR/IVP >50 sell options. The reason that you buy options when IVR/IVP is low is because IV is mean reverting, so you would expect IV to eventually start increasing towards the mean, causing prices to move. The reason you would sell options when IVR/IVP is high is because IV is mean reverting and you would expect IV to decrease towards the mean, causing prices to move sideways.
PRC Version – High volatility market bottoms (but without low volatility market tops).
//Implied Volatility Rank and Percentile Indicator
//By Vonasi
//Date 20191018

//settings
p = 200
vixfixperiod = 22

//Vix Fix
wvf = ((highest[vixfixperiod](close)-low)/(highest[vixfixperiod](close)))*100

//Boundaries
upper = highest[p](wvf)
lower = lowest[p](wvf)

wvflev = ((wvf-lower)/(upper-lower))*100

//Percentile
rnkCount = 0
count = 0
FOR i = 1 to p-1
count = count + 1
IF wvflev[i] < wvflev THEN
rnkCount = rnkCount + 1
endif
NEXT

PercentileRank = (rnkCount/count)*100

//colours
r = 128
g = 0
if wvflev >=50 then
r= 0
g = 128
endif

r1 = 255
g1 = 140
b1 = 0
if PercentileRank >=50 then
r1 = 0
g1 = 255
b1 = 255
endif

RETURN 0 as "0%",100 as "100%",50 as "50%",wvflev coloured(r,g,0) as "Williams Vix Fix", PercentileRank coloured(r1,g1,b1) as "Percentile Rank"
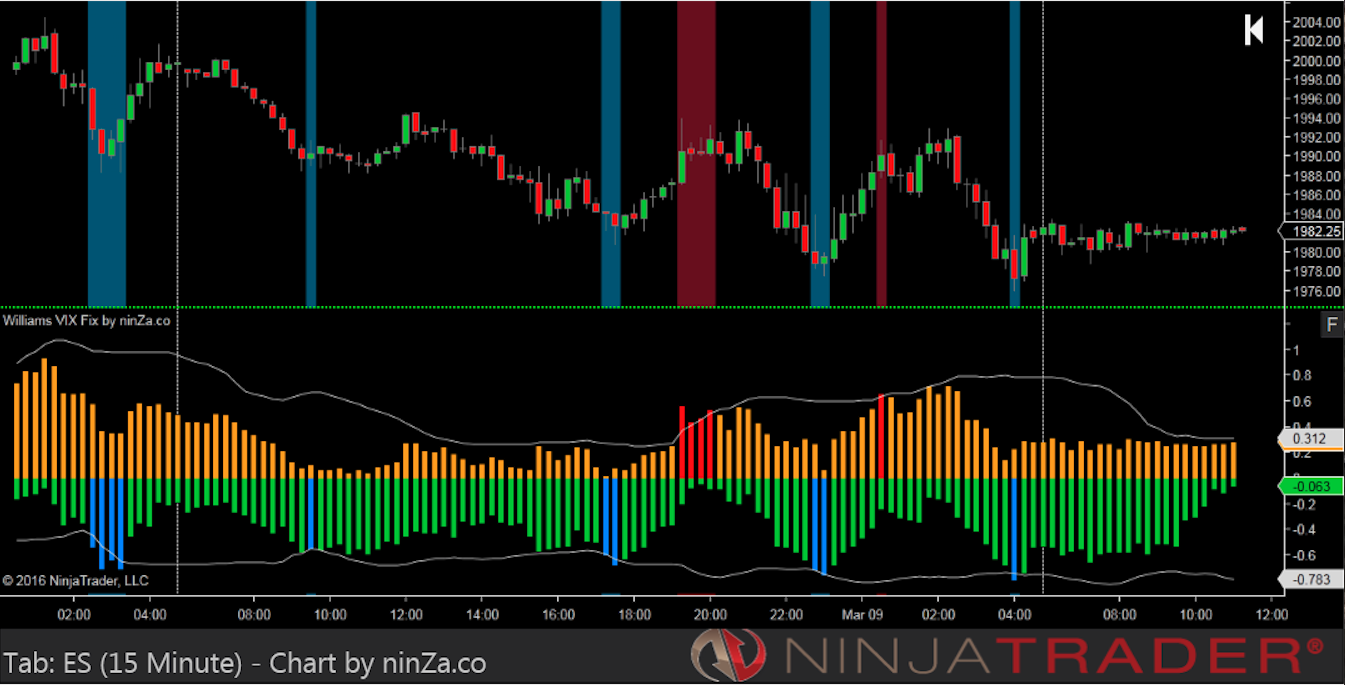
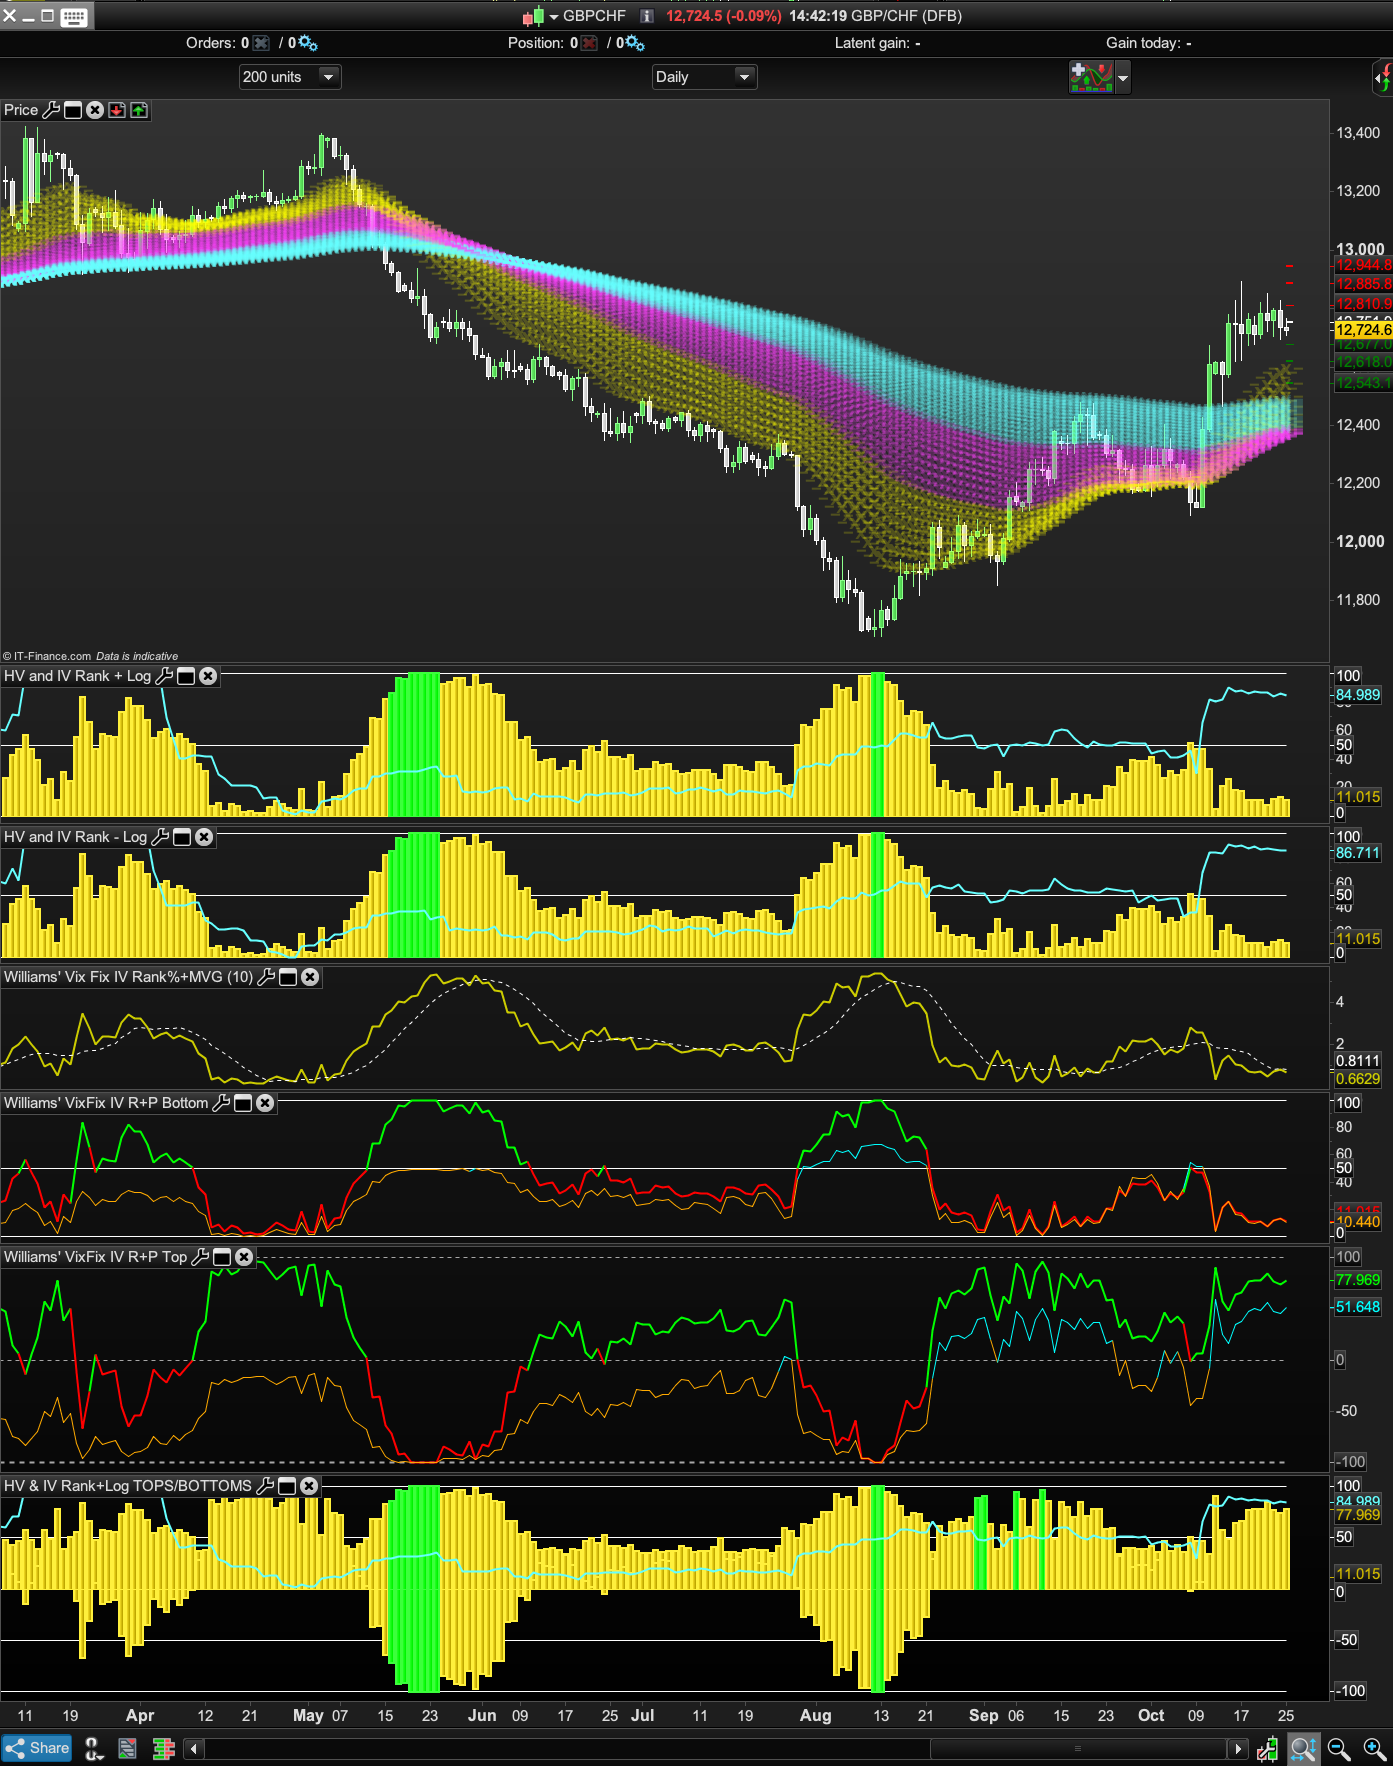
2) Can it be programmed so that the IV also can find low volatility market tops as well as high volatility bottoms, — i.e. instead of just having a fear barometer when Put Premiums are rising sharply and the market is due to bottom out, also have a greed barometer for Call Premium rises and potential low volatility market tops) like this indicator here:
Here’s a dropbox link:
https://www.dropbox.com/sh/bcmihvkefjf98cj/AAADlrHpNFlekHHtIe1vSVjJa?dl=0
to the Ninja Trader 8 Williams Vix Fix code (in #C) shown in the image below and sourced from here:
https://ninza.co/product/williams-vix-fix
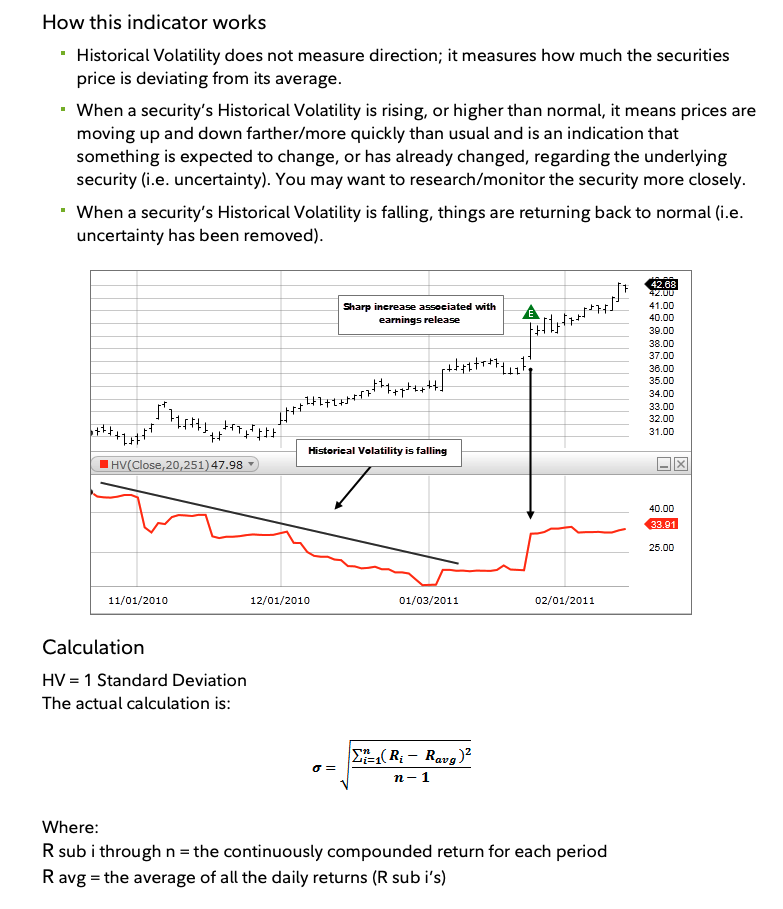
Historical Volatility
Please see the formula for HV is from the attached Fidelity Investment screenshot.
On PRC we have this version fo HV:
indi= HistoricVolatility
hh = highest [365](indi)
ll = lowest[365](indi)

result = 100*((indi-ll)/(hh-ll))

return result
and also this version:
Length = 20
annualVol = 365
periods = 7// 1 = intraday chart 7 = daily chart

Price = log(close / close[1])
sigma = std[length](Price)
HVol = (sigma * sqrt(annualVol / periods)) * 100
lowVol = lowest[annualvol](HVol)
HVrankUp = HVol - lowVol
maxVol = highest[annualvol](HVol)
HVrankLow = maxVol - lowVol
HVR = (HVrankUp / HVrankLow)*100

return HVR coloured(0,0,255)
Both give fairly similar outputs but the log version is more precise.
Implied Volatility
As noted on the Trading View IV indicator post the formula approximation for IV has been coded by Larry Williams and is called the Vix Fix (with a moving average):
https://www.prorealcode.com/topic/indicator-request-for-nic/#post-89764
pd = 22 // "LookBack Period Standard Deviation High"
bbl = 20 //"Bolinger Band Length"
mult = 2.0 //"Bollinger Band Standard Devaition Up"
lb = 50 //"Look Back Period Percentile High"
ph = 0.85 //"Highest Percentile - 0.90=90%, 0.95=95%, 0.99=99%" (For Options writers I would recommend waiting until at least the 95th percentile)
n = 10
//pl = 1.01 //"Lowest Percentile - 1.10=90%, 1.05=95%, 1.01=99%"

mult = max(mult,1)
mult = min(mult,5)

wvf = ((highest[pd](close)-low)/(highest[pd](close)))*100

sDev = mult * std[bbl](wvf)
midLine = average[bbl](wvf)
//lowerBand = midLine - sDev
upperBand = midLine + sDev

rangeHigh = (highest[lb](wvf)) * ph
//rangeLow = (lowest[lb](wvf)) * pl

if (wvf >= upperBand or wvf >= rangeHigh) then //or (wvf <= lowerBand or wvf <= rangeLow) then
color = 1
else
color = -1
endif

ave = average[n](wvf)

RETURN wvf coloured by color as "Williams Vix Fix", ave style(line,1) as " WVF Average"
Any help getting this codified would be much appreciated!
Cheers
Bard