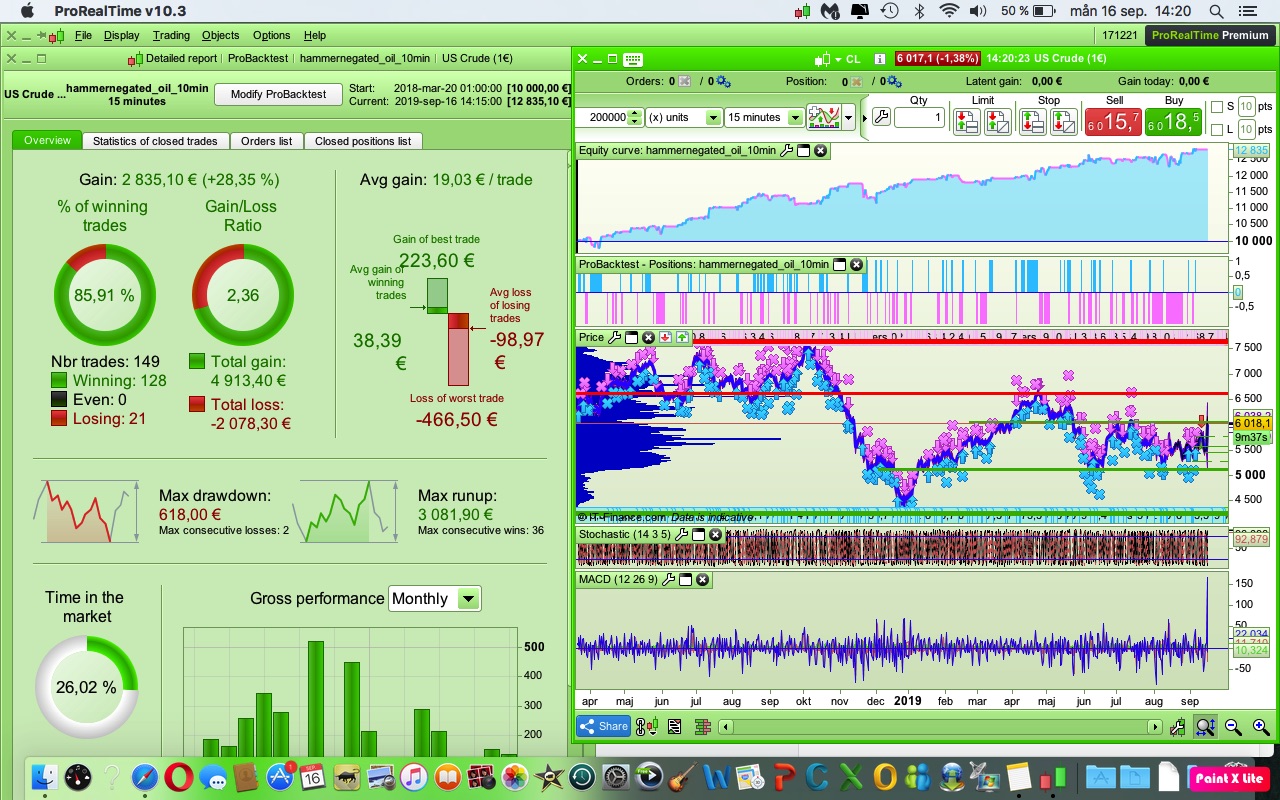
I also found Francesco’s oil hammer negated strategy works consistently well on 15min TF. Here’s the link to it: https://www.prorealcode.com/prorealtime-trading-strategies/oil-10min-hammernegated-pattern-strategy/
@fatlung
This has to be the best algo in the library?
Francesco’s algo runs until July 2017.
I only have data from March 2018, but from then to today it has gone as smoothly as in his BT.
The difference is just having used it for 10 min.
In 15 minutes it has gone really well.
Spread=3
Think about starting it at the smallest possible size.
Manually you can trade 0.25 contracts.
What is the smallest size auto on US Crude?
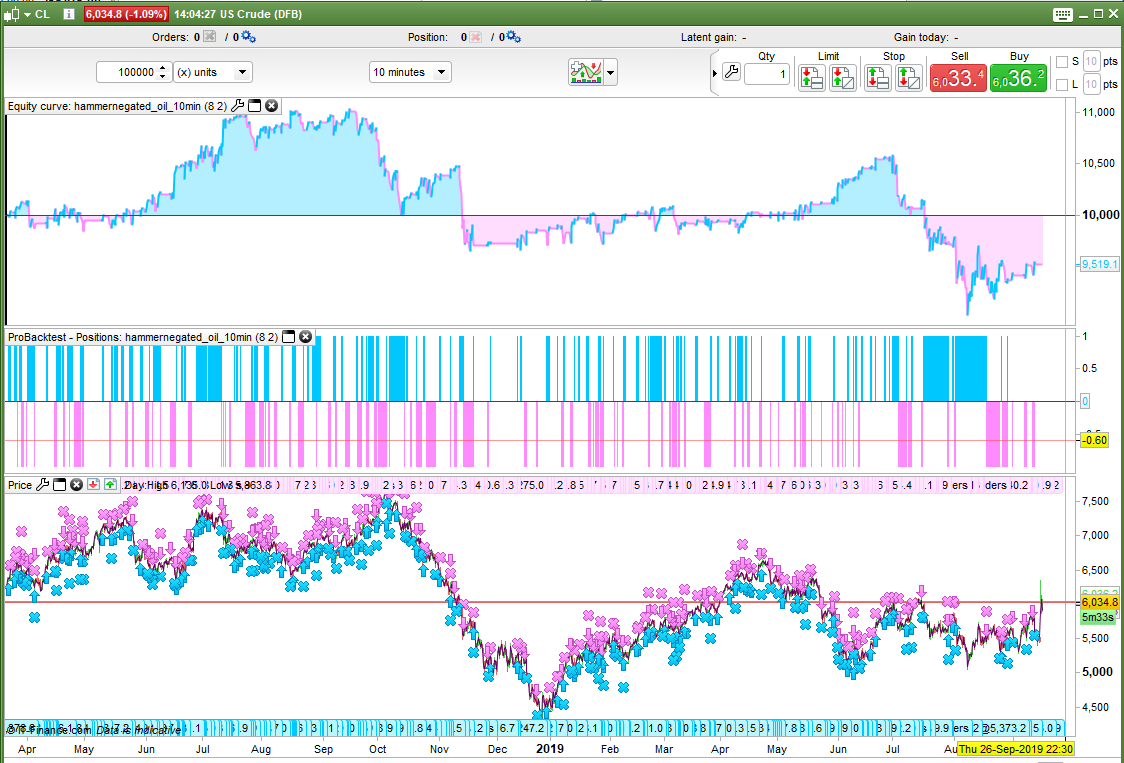
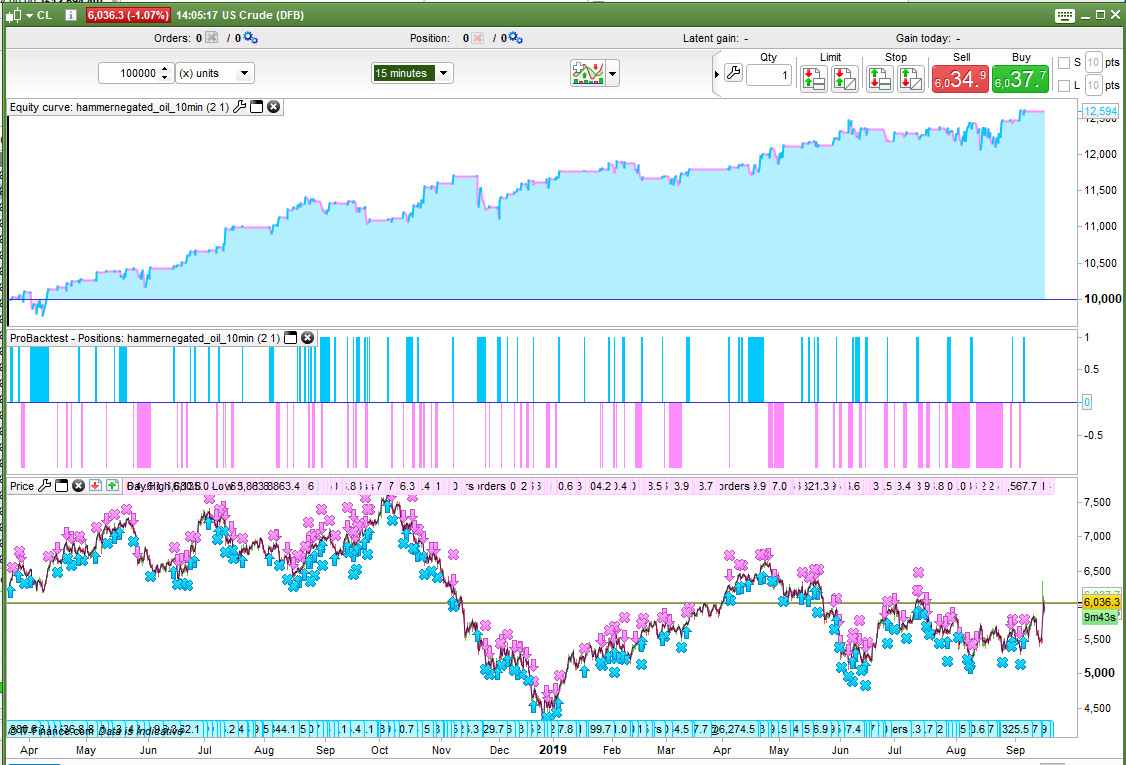
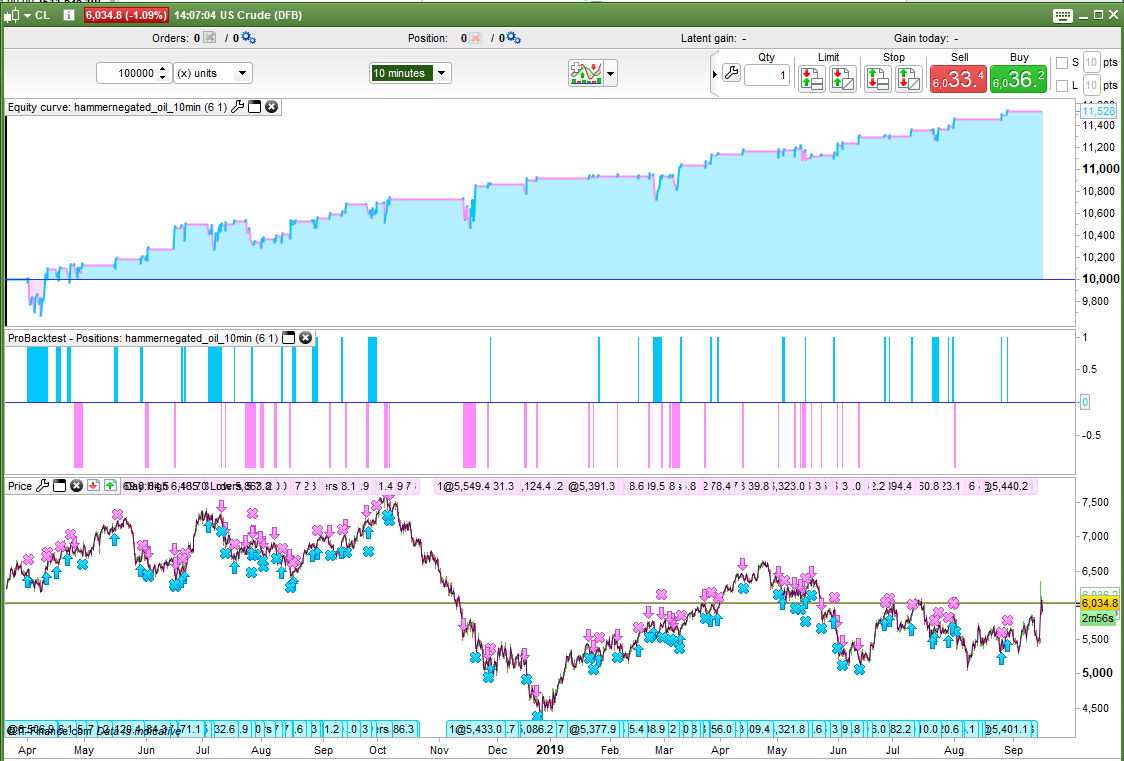
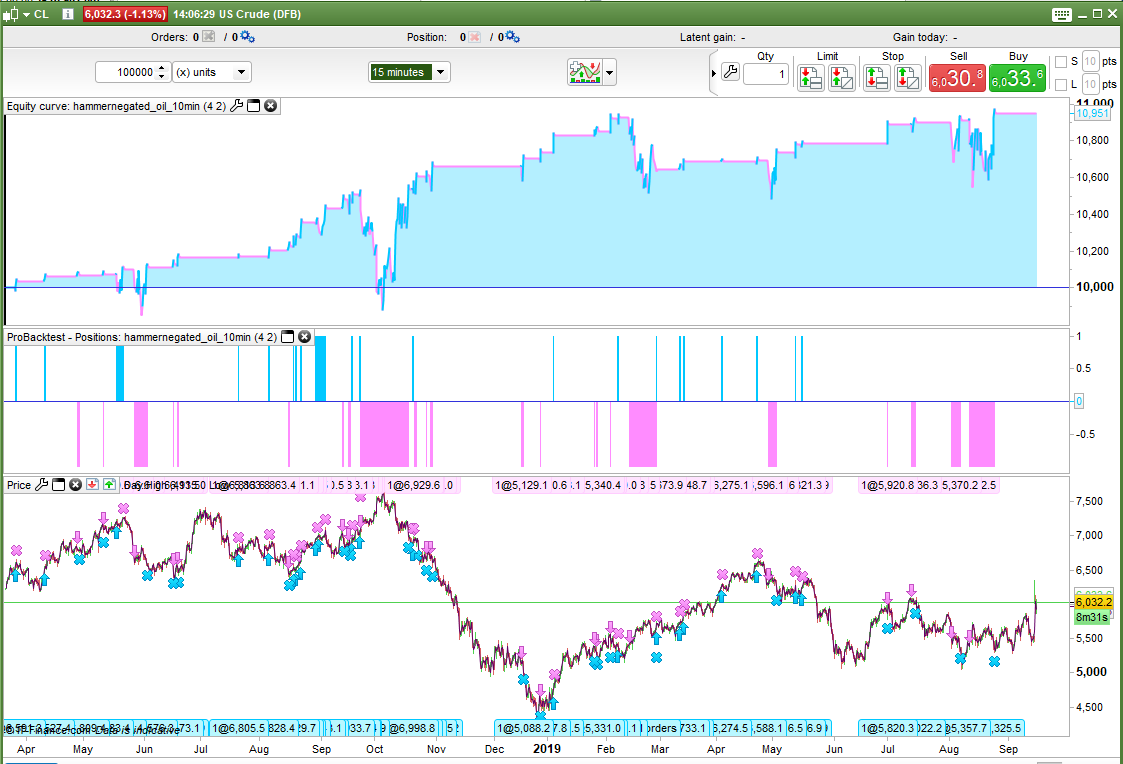
I get the results shown in the first two images for Francesco’s oil hammer negated strategy on 10 minute and 15 minute time frames with a spread of 3.
I tried playing with the bull and bear filters to give them a no trading band by changing them to:
bull = low > av1 and low > av2 and low > av3
bear = high < av1 and high < av2 and high < av3
This change massively improved the 10 minute chart results but not the 15 minute. See second two images.
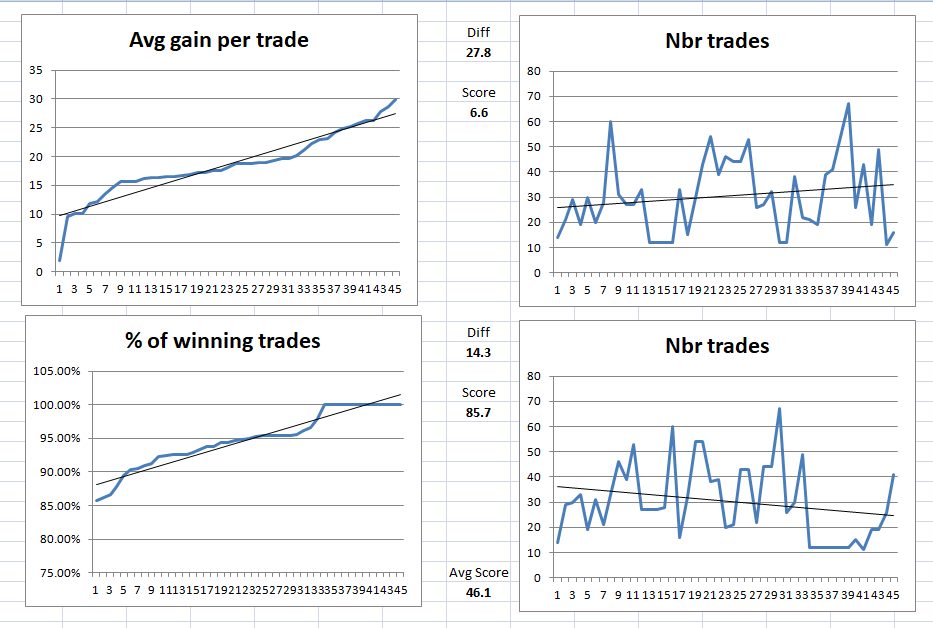
I also ran a robustness test on my modified 10 minute version. The average gain per trade score is not great but the trade numbers are also very low so it is not a very conclusive test.
My opinion would be that the OOS 10 minute results are a fail for the original strategy. It would be nice to see the 15 minute results prior to what we can currently see on the 100k chart and also for a 10 minute strategy with my bear and bull filter changes. Perhaps someone with 200k might be able to help?
thanks Vonasi, everytime I see your analysis I learn something from you.
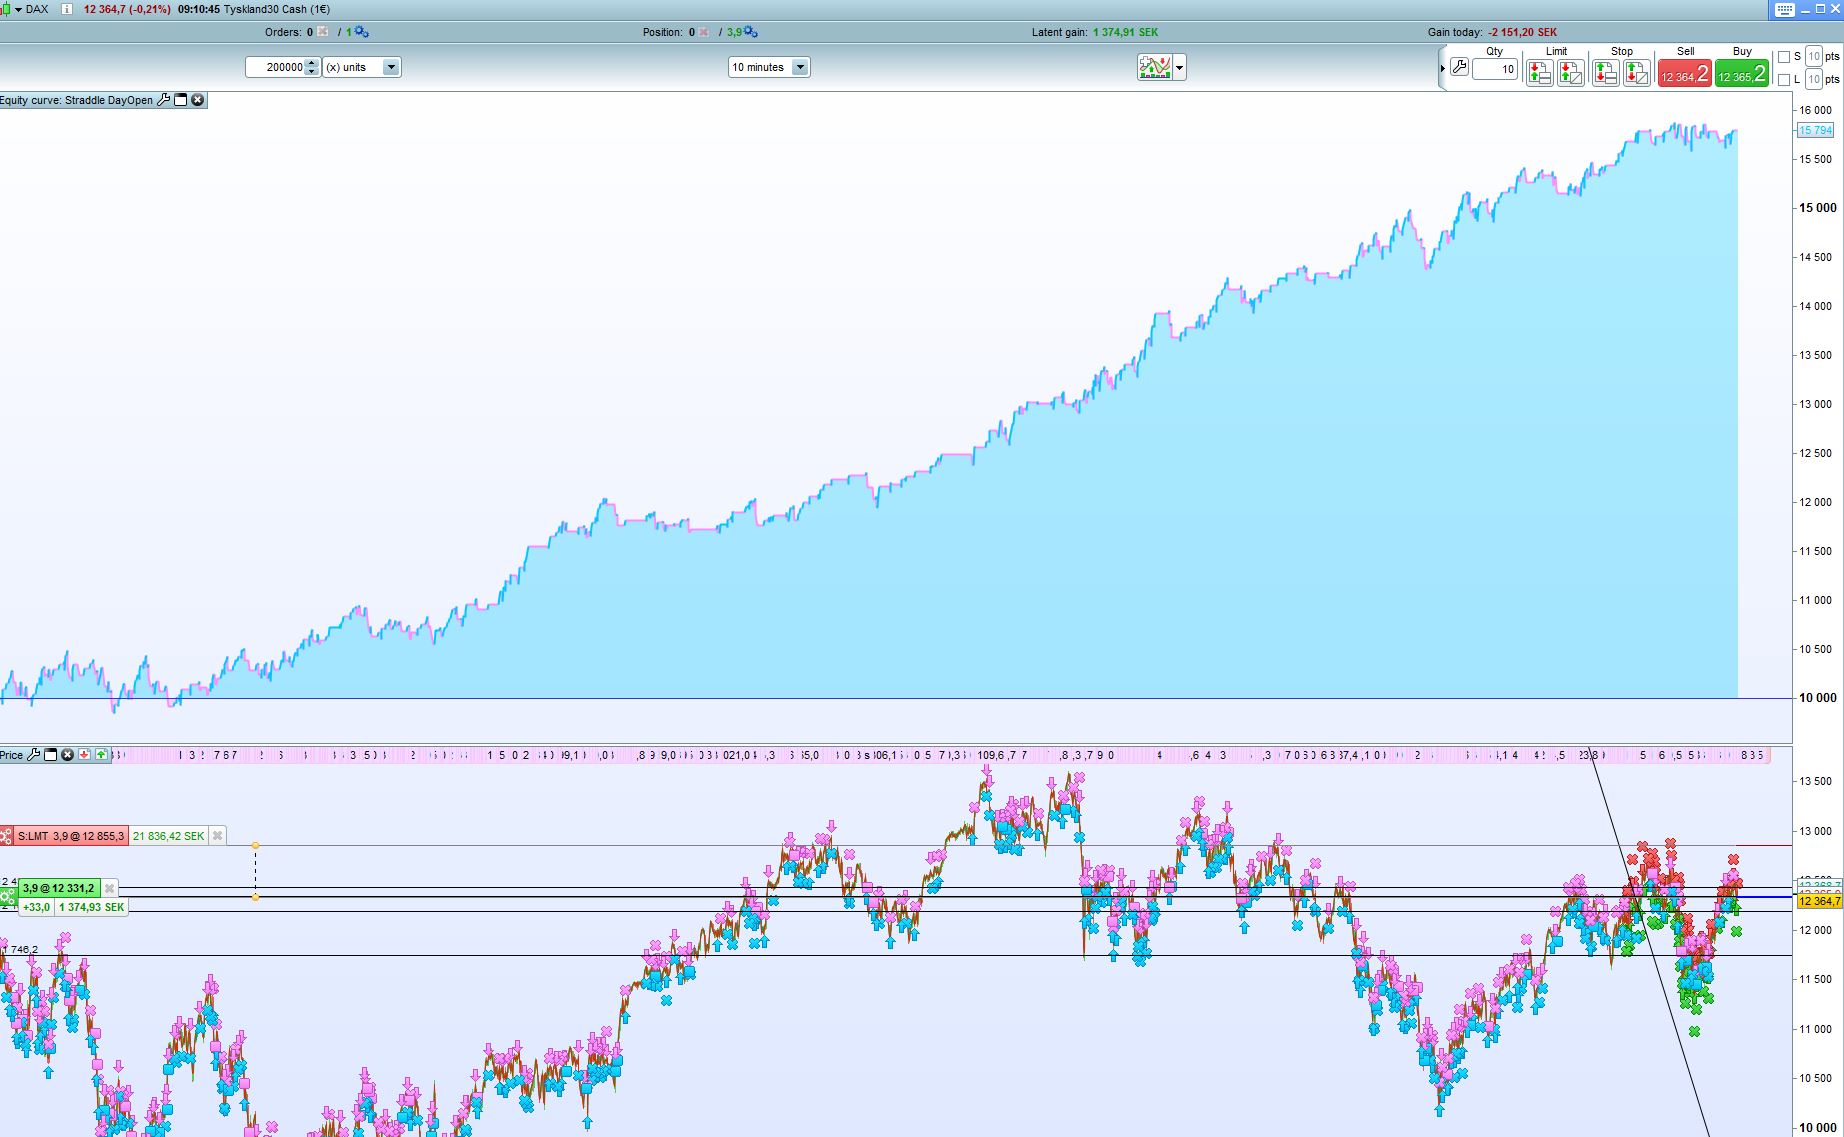
The equity curve of the 15min version is really appealing, there are 2 problems on this strategy as i have run it for almost 2 months on demo.
- there is no hard stoploss, which means sometimes it can be hard to survive huge drawdown
- the ‘hammer negated’ pattern is not a really good entry point as average position duration is over 8 hours (but idk why it yields that appealing curve)
Am I crazy
Don’t understand what you mean?
Isn’t the 10 minute ok to start according to the picture I attached?
Doesn’t look like you need to change anything.
It has shown good results for 2 years after it was made.
Isn’t the 10 minute ok to start according to the picture I attached?
The image you attached is on the 15 minute chart and not the 10 minute chart.
@Vonasi
Sorry, i mean the 15 min attached foto of course.
The code was made a long time a go and the results is still ok!
They’ve been fine for the last two years so why wouldn’t it continue for a while?
They’ve been fine for the last two years so why wouldn’t it continue for a while?
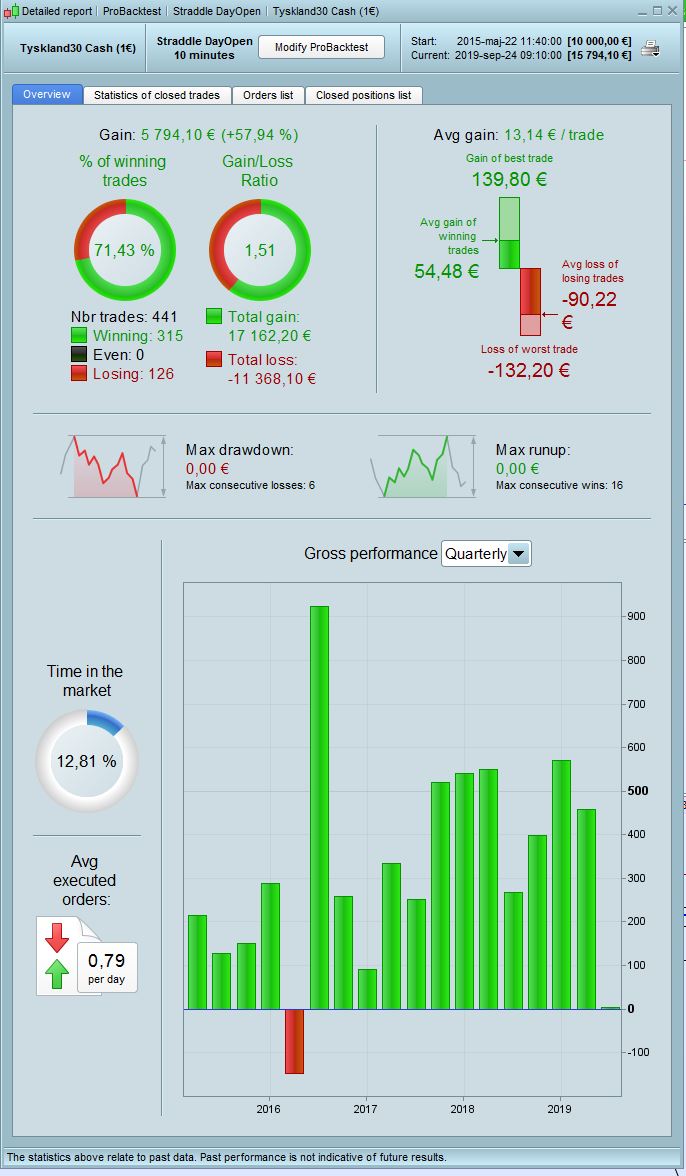
So you took a strategy that had been developed and tested on a 10 minute time frame and decided to run it on a 15 minute time frame. I’m guessing that you back tested it on the different time frame first and the results were good or better than the 10 minute which is why you chose to go forward with the 15 instead of 10 minute time frame? Do you have any equity curves for the 15 minute strategy from prior to the data we can use today as they would be interesting to see?
So why would it not work in the future? Just look at the OOS equity curve for the 10 minute strategy and it clearly didn’t. Perhaps you got lucky with the switch to 15 minutes or was the decision based on any sound reasoning that 15 minutes was better than 10? One benefit I guess would be the increased period of time available for the back test so the 15 minute strategy has a longer in sample test. The strategy is based on price action and if market structure changes then the strategy could just simply stop working overnight. It would also be nice if it worked on a lot more than just one instrument.
Fingers crossed that you have found something that works better than Francesco originally discovered.
The Dayopen Straddle strategy https://www.prorealcode.com/prorealtime-trading-strategies/dayopen-straddle-for-dax-3-minute-timeframe/
This strategy has so many different timeframes and settings in the forum so it is a bit confusing, but I put the 10 minutes settings in demo more than 6 mounths ago and it keeps on making money. I have no idea how the different versions are doing and maybe Im just lucky with this one. Does anyone else have tested this one or do you have any opinion about it?
//-------------------------------------------------------------------------
// Main code : Straddle DayOpen
//-------------------------------------------------------------------------

// common rules
DEFPARAM CUMULATEORDERS = false
DEFPARAM PRELOADBARS = 10000

// optional
ExtraTradeCriteria=1

// positionsize and stops
positionsize = 1
sl = 1 // % Stoploss
pt = 1.5 // % Profit Target
ts = 0.40 // % MFETrailing

// indicator settigns
NOP=25 //number of points
TimeOpen=090000

// day & time rules
ONCE entertime = TimeOpen
ONCE lasttime = 100000
ONCE closetime = 240000 // greater then 23.59 means it continues position overnight
ONCE closetimeFriday=173000

tt1 = time >= entertime
tt2 = time <= lasttime

tradetime = tt1 and tt2

DayForbidden = 0 // 0=sunday
df = dayofweek <> dayforbidden

// setup number of trades intraday
if IntradayBarIndex = 0 then
longtradecounter = 0
Shorttradecounter = 0
Tradecounter=0
endif

// general criteria
GeneralCriteria = tradetime and df

// trade criteria
tcLong = countoflongshares < 1 and longtradecounter < 1 and tradecounter <1
tcShort = countofshortshares < 1 and shorttradecounter < 1 and tradecounter <1

// indicator criteria
If time = TimeOpen then
DayOpen=open
endif

if IntradayBarIndex = 0 then
lx=0
sx=0
endif

if high > DayOpen+NOP then
lx=1
else
lx=0
endif

if low < DayOpen-NOP then
sx=1
else
sx=0
endif

// trade criteria extra
min1 = MIN(dhigh(0),dhigh(1))
min2 = MIN(dhigh(1),dhigh(2))

max1 = MAX(dlow(0),dlow(1))
max2 = MAX(dlow(1),dlow(2))

If ExtraTradeCriteria then
tcxLong = high < MIN(min1,min2)
tcxShort = low > MAX(max1,max2)
else
tcxLong = high
tcxShort = low
endif

// long entry
If GeneralCriteria then
if lx and tcLong and tcxLong then
buy positionsize contract at market
longtradecounter=longtradecounter + 1
tradecounter=tradecounter+1
endif
endif

// short entry
If GeneralCriteria then
if sx and tcShort and tcxShort then
sellshort positionsize contract at market
shorttradecounter=shorttradecounter + 1
tradecounter=tradecounter+1
endif
endif

// MFETrailing
trailingstop = (tradeprice/100)*ts
if not onmarket then
MAXPRICE = 0
MINPRICE = close
priceexit = 0
endif
if longonmarket then
MAXPRICE = MAX(MAXPRICE,close)
if MAXPRICE-tradeprice(1)>=trailingstop*pipsize then
priceexit = MAXPRICE-trailingstop*pipsize
endif
endif
if shortonmarket then
MINPRICE = MIN(MINPRICE,close)
if tradeprice(1)-MINPRICE>=trailingstop*pipsize then
priceexit = MINPRICE+trailingstop*pipsize
endif
endif
If onmarket and priceexit>0 then
sell at market
exitshort at market
endif

// exit at closetime
If onmarket then
if time >= closetime then
sell at market
exitshort at market
endif
endif

// exit friday at set closetime
if onmarket then
if (CurrentDayOfWeek=5 and time>=closetimefriday) then
sell at market
exitshort at market
endif
endif

// build-in exit
SET TARGET %PROFIT pt
SET STOP %LOSS sl

GRAPH 0 coloured(300,0,0) AS "zeroline"
GRAPH (positionperf*100)coloured(0,0,0,255) AS "PositionPerformance"
Thank you PastaPesto.
Would you mind posting the report of this strategy on your demo account?
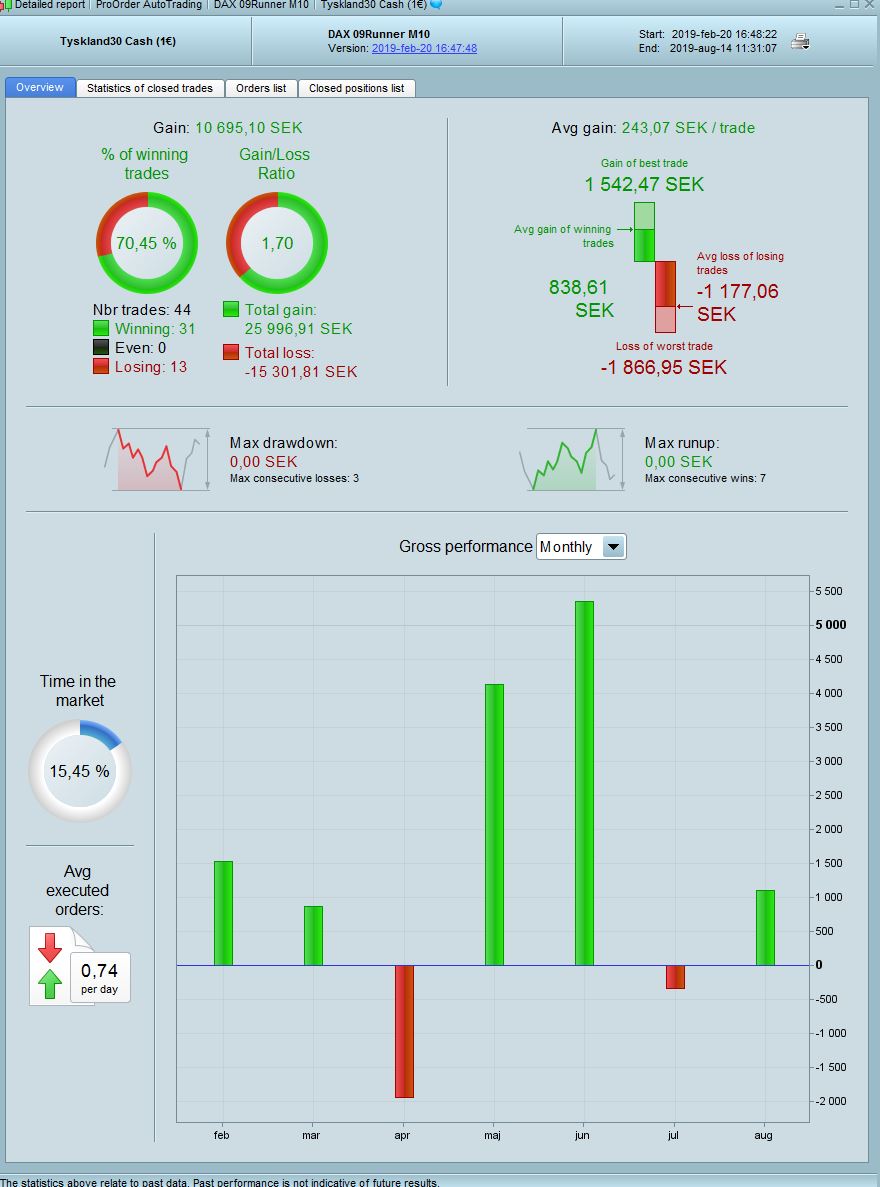
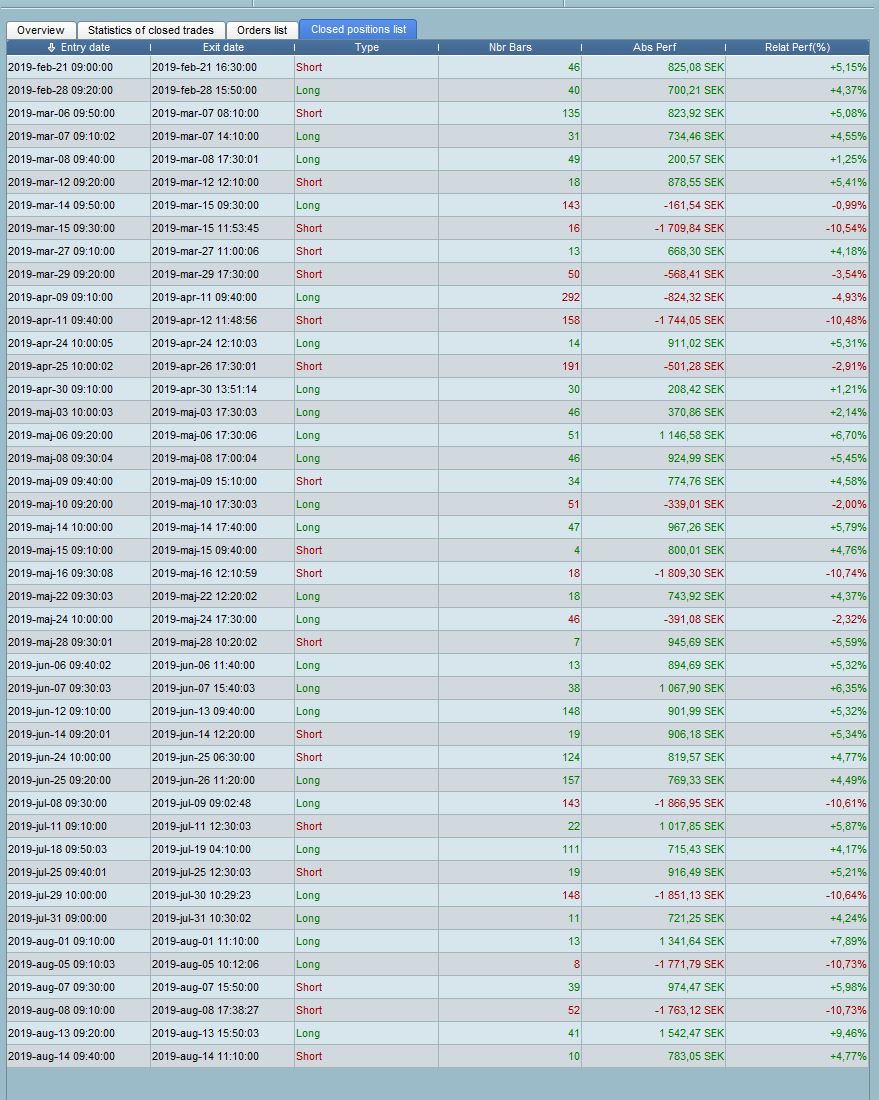
Hi Fatlung,
I attached pictures of the report from demo. I hope this is what you want to see. It started in February and then I accidently stopped it in August, so the report is no longer than Aug 14th.
I added PastaPesto results to here
Forward Test – Sys Perf
Are those results for Lot size = 1 @PastaPesto please??
If not Lot size = 1 then what is the Lot size you used please? Only asking so the Log has a common baseline re performance.