Hello to everyone,
before I start, I want to tell everyone that some days ago I wrote this post in the italian forum, in which I was looking for some help because I’ve created an indicator that draws these swing lines that represent resistances and supports and I wanted to improve the algorithm. Nicolas, helped me to make the indicator work for all assets ( I think you all know him ) and he told me that maybe I can find some more help here.
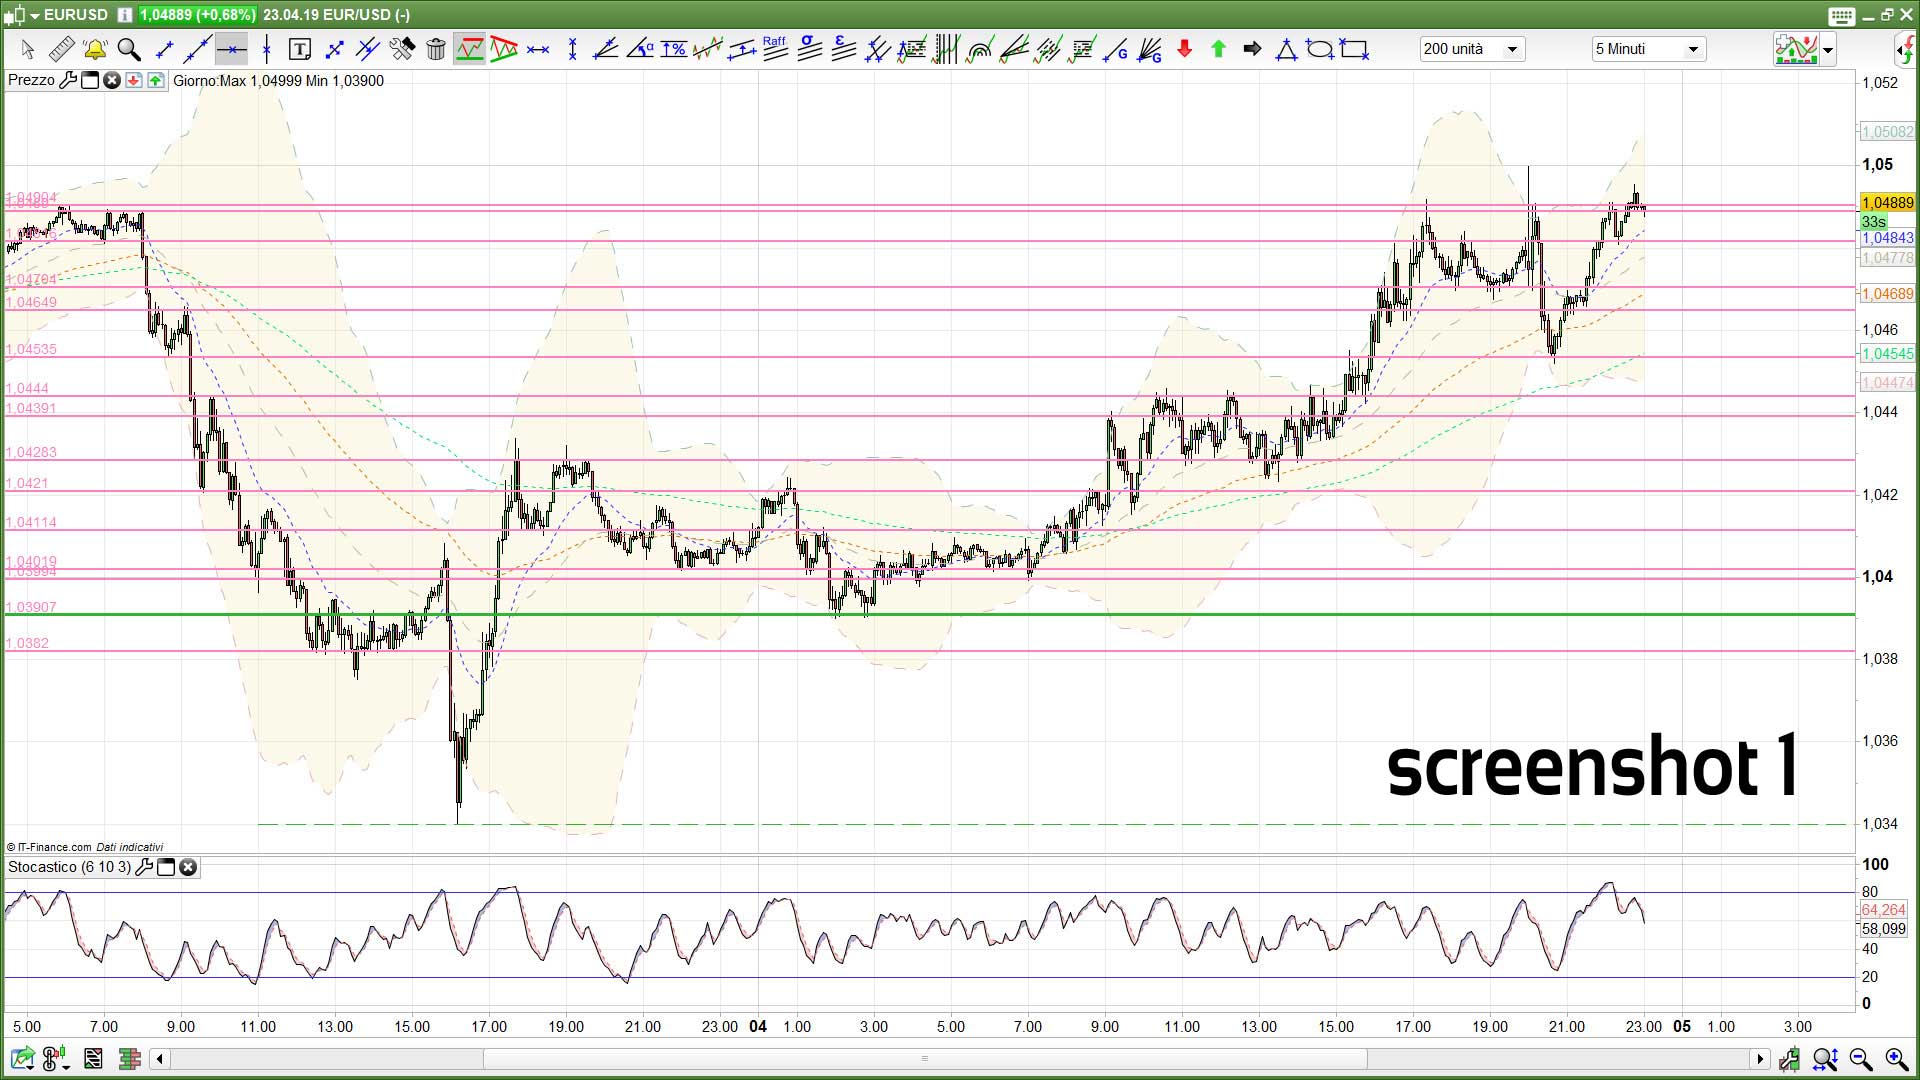
So I wanted to create an indicator that can draw the swing lines that I draw manually (first screenshot).
I wrote the code below:
//vars
//n = 21 // period for calculating highs and lows
//tolleranza = 10 // (needs to be expressed in points )if we have 2 or more lines that are this close then draw a medium line
//smoothness = 13 // this variable acts like a smooth factor
DEFPARAM CalculateOnLastBars = 350 //per il calcolo delle swing lines prendiamo in considerazione solamente le ultime X candele
once linear = 0
once lineas = 0
once newlinear = 0
once newlineas = 0
once newlinearr = 0
once newlineass = 0

resistenze = highest[n]((close+high)/2) // resistances
supporti = lowest[n]((close+low)/2) // supports

if resistenze[n-lisciatura] = resistenze[1] then
linear = (resistenze[1] + linear) / 2
else
linear = linear
endif
//drawhline(linear) coloured(255,0,0)

if supporti[n-lisciatura] = supporti[1] then
lineas = (supporti[1] + lineas) / 2
else
lineas = lineas
endif
//drawhline(lineas) coloured(0,255,0)

if linear[2] = linear[1] and linear[1] = linear then
//drawhline(linear) coloured(255,0,0)
newlinear = linear
endif

if lineas[2] = lineas[1] and lineas[1] = lineas then
//drawhline(lineas) coloured(0,255,0)
newlineas = lineas
endif

i = 0
valsup = newlinear + tolleranza*pointsize
valinf = newlinear - tolleranza*pointsize

while i <> 350 do
if newlinear[i] = 0 then//aiuta ad accorciare il ciclo
break
endif
cond = (newlinear[i] <= valsup and newlinear[i] >= valinf) or (newlineas[i] <= valsup and newlineas[i] >= valinf)
if cond then
newlinearr = (newlinear[i] + newlinear)/2
endif
i = i+1
wend

i = 0
valsup = newlineas + tolleranza*pointsize
valinf = newlineas - tolleranza*pointsize

while i <> 350 do
if newlineas[i] = 0 then //should help to make the cycle shorter
break
endif
cond = (newlineas[i] <= valsup and newlineas[i] >= valinf) or (newlinear[i] <= valsup and newlinear[i] >= valinf)
if cond then
newlineass = (newlineas[i] + newlineas)/2
endif
i = i+1
wend

drawhline(newlinearr) coloured(0,125,255)
drawhline(newlineass) coloured(0,125,255)

return  newlinearr as "R", newlineass as "S"
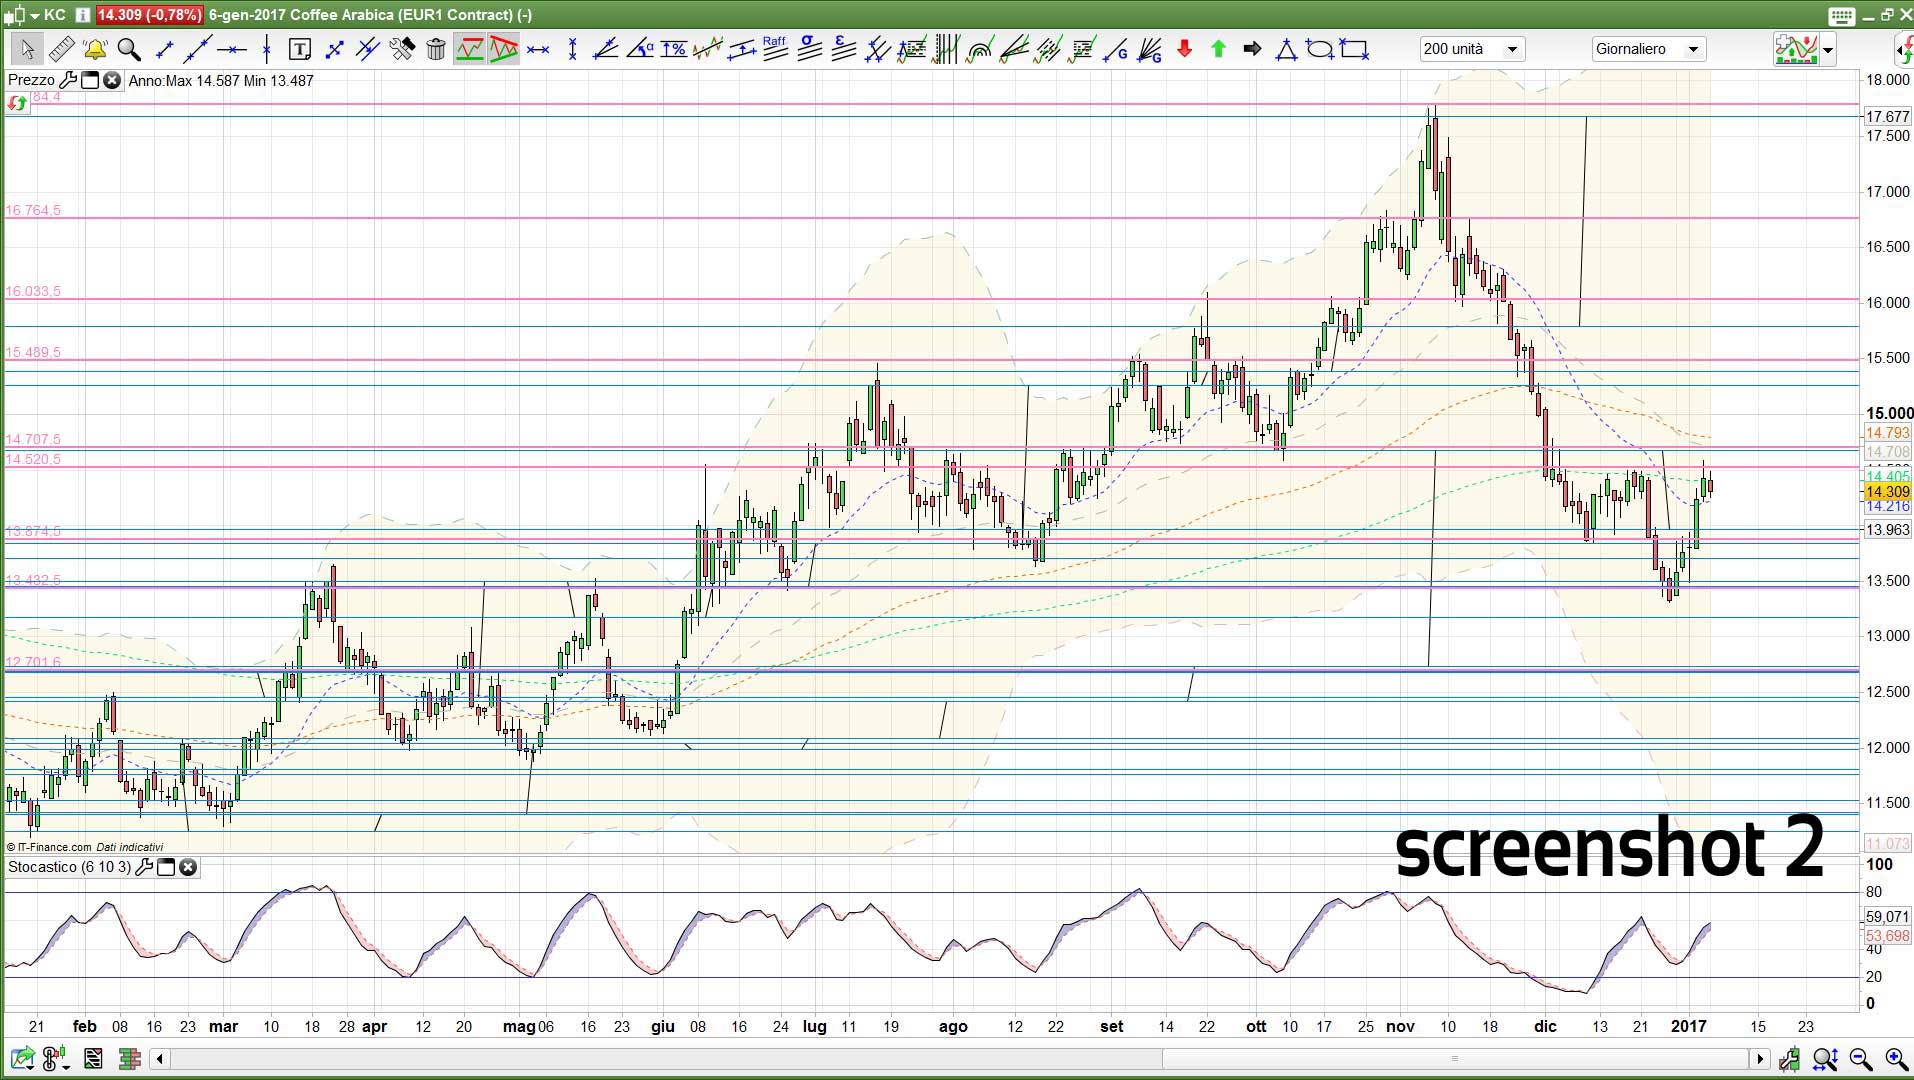
The indicator draws the lines like in the second attachment. Now the result is not bad but I would like the reduce the number of the lines. What I would like to do next is to filter the lines using other lines drawn on bigger time frames. Because I’m not that much of an expert with PRT code the algorithm is bit heavy and if I would like to apply the forth filter ( the one based on bigger tf ) I’m afraid it would be much much heavier.
I already know Nicolas has some ideas and I’m looking forward to see what he has in mind 🙂
Thanks
Thanks to the new website search engine, I retrieved this post lost months ago 🙂
Here is the version I made so far (same as the one from the Italian forum)
DEFPARAM CalculateOnLastBars = 350 // To calculate the lines swing we take into consideration only the latest X candles

n = 20 // highest and lowest period for support/resistance fetch
tolerance = 5 // should be expressed in points) if there are two (or more) lines that are close to me, then you have to draw a center line
lookback = 10 // period lookback to confirm support and resistance areas
showSupport = 1//(0=false , 1=true)
showResistance = 1 //(0=false , 1=true)

once linear = 0
once lineas = 0
once newlinear = 0
once newlineas = 0
once newlinearr = 0
once newlineass = 0

if showResistance then
resistance = highest[n](high) // resistance ( massimi precedenti dove i prezzi sono stati respinti)

if resistance[n-lookback] = resistance[1] then
linear = (resistance[1] + linear) / 2
else
linear = linear
endif

if linear[2] = linear[1] and linear[1] = linear then
newlinear = linear
endif

i = 0
valsup = newlinear + tolerance*pointsize
valinf = newlinear - tolerance*pointsize

while i <> 350 do
if newlinear[i] = 0 then//aiuta ad accorciare il ciclo
break
endif
cond = (newlinear[i] <= valsup and newlinear[i] >= valinf) or (newlineas[i] <= valsup and newlineas[i] >= valinf)
if cond then
newlinearr = (newlinear[i] + newlinear)/2
savedbar = barindex//[i]
endif
i = i+1
wend

drawhline(newlinearr) coloured(0,125,255)
if newlinearr<>oldtextr then
drawtext("▼ #newlinearr#",savedbar,newlinearr)
oldtextr=newlinearr
endif
endif

if showSupport then
support = lowest[n](low) // support ( minimi precedenti dove i prezzi sono stati rimbalzati)

if support[n-lookback] = support[1] then
lineas = (support[1] + lineas) / 2
else
lineas = lineas
endif

if lineas[2] = lineas[1] and lineas[1] = lineas then
newlineas = lineas
endif

i = 0
valsup = newlineas + tolerance*pointsize
valinf = newlineas - tolerance*pointsize

while i <> 350 do
if newlineas[i] = 0 then//aiuta ad accorciare il ciclo
break
endif
cond = (newlineas[i] <= valsup and newlineas[i] >= valinf) or (newlinear[i] <= valsup and newlinear[i] >= valinf)
if cond then
newlineass = (newlineas[i] + newlineas)/2
savedbar = barindex[i]
endif
i = i+1
wend

drawhline(newlineass) coloured(0,125,255)
if newlinearr<>oldtexts then
drawtext("▲ #newlineass#",savedbar,newlineass)
oldtexts=newlineass
endif
endif

RETURN
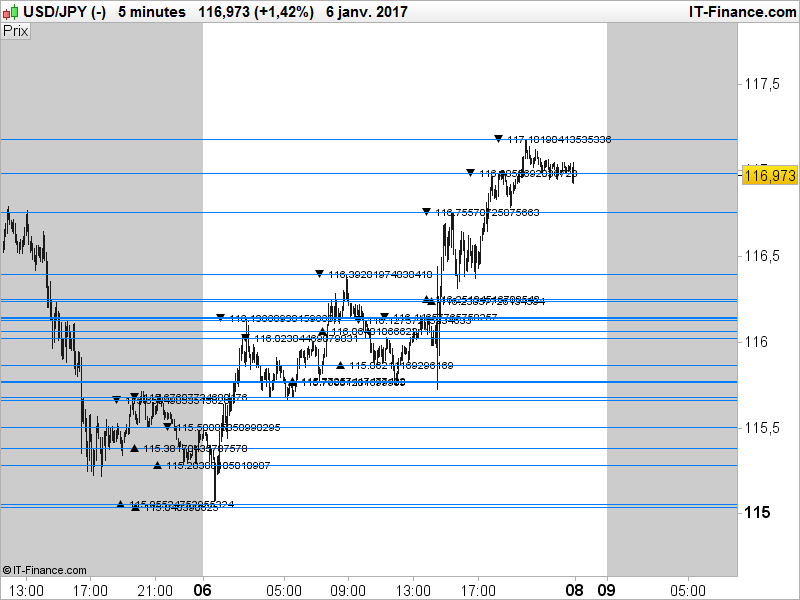
I’ll try to make further development on this indicator in the next days/weeks. Subscribe! Thanks to Rorschack for the original code and idea!
Hi Nicolas, tried your code but it says error in line 1, im using ProRealTime 10.2 (Binck bank version). how can i solve to see support and resistance? Thanks!!
Sorry but this indicator use graphical components only available since version 10.3.
You should open a demo account with PRT-CFD! https://www.prorealcode.com/PRT-CFD-english/
ok thanks, il try it and let you know 🙂
Very Nice.
Exactly what I was looking for if only we can store these values in variables.
 CKW
CKWParticipant
Veteran
perfect. This indicator is Awesome!
CKWParticipant
Veteran
Hi Nicholas,
as PRT do not support array, Do you have a better way to maintain these R/S level as part of automatic trading system?
For e.g, Past 10 Rresistance, Past 10 Support
I would like to use those R/S as exit level.
Br, CKW
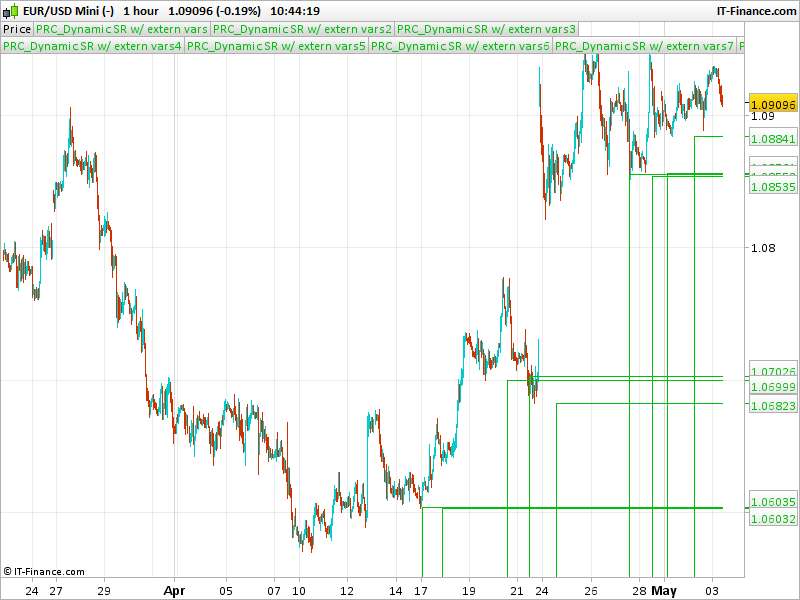
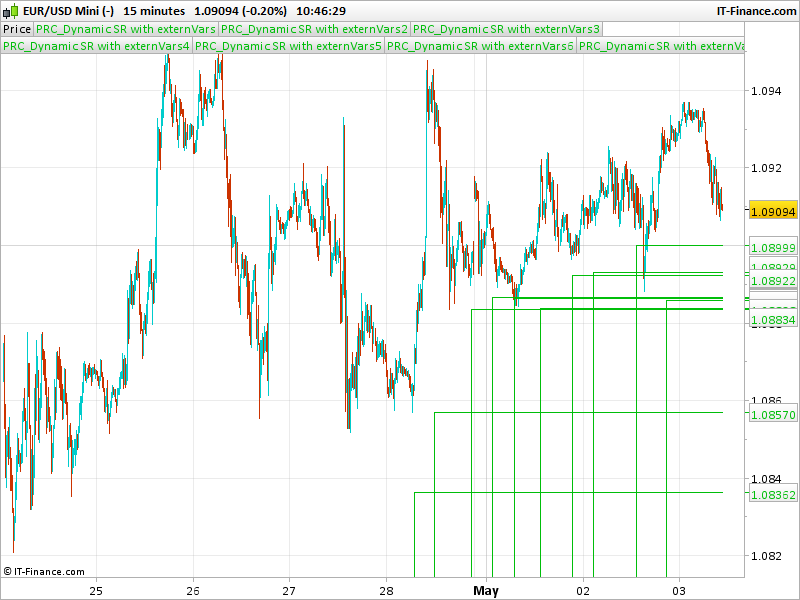
You can use this updated code I just made, but only for support lines. Even if we don’t have arrays, it stores and draws last 10 support lines (which become resistance line of course when price is below them). Example attached too.
Hey this is great, very useful!
Thank you so Much Nicolas … I don’t know how you do it and keep up with everything else!
GraHal
I don’t know how you do it and keep up with everything else!
This is something I don’t know myself, and you don’t even have any ideas of how many things are currently on the table ..
CKWParticipant
Veteran
Thanks Nicholas!
I have the similar way:
if newlineass<>oldtexts then
drawtext("▲ #newlineass#",savedbar,newlineass,SansSerif,standard,14)
Y10 = Y9
Y9 = Y8
Y8 = Y7
Y7 = Y6
Y6 = Y5
Y5 = Y4
Y4 = Y3
Y3 = Y2
Y2 = Y1
Y1 = newlineass
oldtexts=newlineass
endif
endif
i do not understand very well the Algorithm, how do i adjust the parameters optimize for past friday R / S for 30m time frame?
1 day = 48 candles (30m)
Sorry CKW, but I don’t understand? What is the code you provided?
CKWParticipant
Veteran
ah… Sorry Nicholas. It’s 2 different topics
First part of my post is to share i am using following to back up the Past 10 support. Whenever there is a new support, it will be stored as Y1, previous support will back up as Y2 and so on.
if newlineass<>oldtexts then
drawtext("▲ #newlineass#",savedbar,newlineass,SansSerif,standard,14)
Y10 = Y9
Y9 = Y8
Y8 = Y7
Y7 = Y6
Y6 = Y5
Y5 = Y4
Y4 = Y3
Y3 = Y2
Y2 = Y1
Y1 = newlineass
oldtexts=newlineass
endif
Second part of my Post is to get your advice, what is the parameters to adjust (n, lookback, etc) if i need only last 5 days R / S in 30m time frame chart. I do not understand well part of this algorithm.
if resistance[n-lookback] = resistance[1] then
linear = (resistance[1] + linear) / 2
else
linear = linear
endif

if linear[2] = linear[1] and linear[1] = linear then
newlinear = linear
endif
Br, CKW