Bonjour à tous,
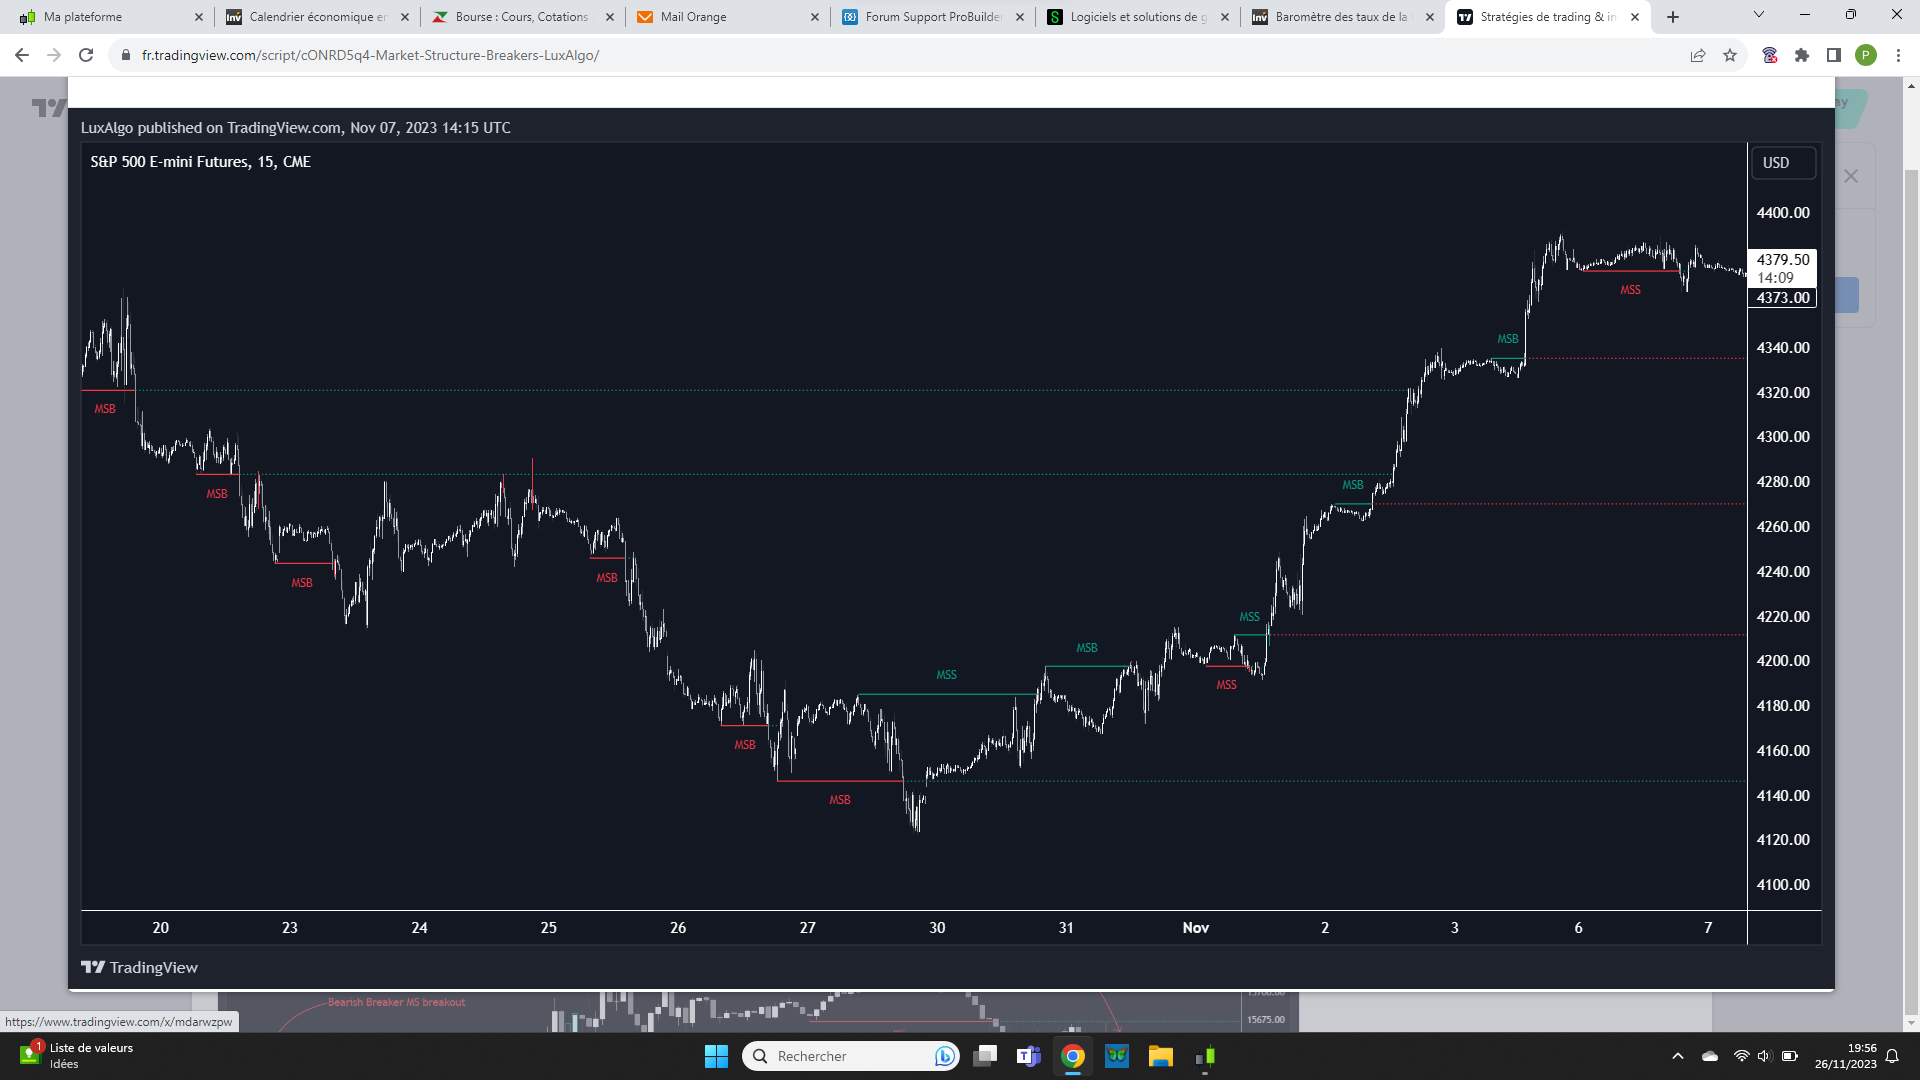
Ci-joint dessous le code pinescript du MARKET STRUCTURE en libre service sur tradinview.
Ne connaissant pas ce langage, si les informaticiens du forum pourraient m’aider à la transcrire !
Merci d’avance.
//@version=5
indicator("Market Structure (Breakers) [LuxAlgo]", overlay = true, max_lines_count = 500, max_labels_count = 500)
//-----------------------------------------------------------------------------}
//Settings
//-----------------------------------------------------------------------------{
length = input.int(20, 'Swings Period', minval = 2)
breaks = input.int(1, 'Maximum Breaks', minval = 1)
maxDuration = input(1000, 'Breaker Maximum Duration')

//Style
bullCss = input(#089981, 'Bullish MS', inline = 'bull', group = 'Style')
bullBreakCss = input(#f23645, 'Breaker', inline = 'bull', group = 'Style')

bearCss = input(#f23645, 'Bearish MS', inline = 'bear', group = 'Style')
bearBreakCss = input(#089981, 'Breaker', inline = 'bear', group = 'Style')

//-----------------------------------------------------------------------------}
//UDT
//-----------------------------------------------------------------------------{
type breaker
    line level
    int  breaks = 0

//-----------------------------------------------------------------------------}
//Bullish Breaker
//-----------------------------------------------------------------------------{
var phx = 0
var phcross = false
var bullms = array.new<breaker>(0)
var os = 0

n = bar_index
ph = fixnan(ta.pivothigh(length, length))

if ph != ph[1]
    phx := n-length
    phcross := false

//Test for bullish market structure
if close > ph and not phcross
    line.new(phx, ph, n, ph, color = bullCss)

    //MS label
    label.new(int(math.avg(phx, n)), ph, os == -1 ? 'MSS' : 'MSB'
      , textcolor = bullCss
      , color = color(na)
      , size = size.small
      , style = label.style_label_down)

    bullms.unshift(breaker.new(line.new(n, ph, n, ph, color = bullBreakCss, style = line.style_dotted)))
    phcross := true

    if bullms.size() > 100
        bullms.pop()

    os := 1

//Iterate trough existing bullish structures and test for breaks
break_down = false

if bullms.size() > 0
    for i = bullms.size()-1 to 0
        get = bullms.get(i)
        get.level.set_x2(n)

        if close < get.level.get_y2() and open > get.level.get_y2()
            get.breaks += 1

            if get.breaks == breaks
                bullms.remove(i)
                break_down := true

        else if (n - get.level.get_x1()) >= maxDuration
            bullms.remove(i).level.delete()

//Support events
support = false
if bullms.size() > 0
    lvl = bullms.get(0).level.get_y2()

    support := low < lvl and math.min(close, open) > lvl

//-----------------------------------------------------------------------------}
//Bearish Breaker
//-----------------------------------------------------------------------------{
var plx = 0
var plcross = false
var bearms = array.new<breaker>(0)

pl = fixnan(ta.pivotlow(length, length))

if pl != pl[1]
    plx := n-length
    plcross := false

//Test for bearish market structure
if close < pl and not plcross
    line.new(plx, pl, n, pl, color = bearCss)

    //MS label
    label.new(int(math.avg(plx, n)), pl, os == 1 ? 'MSS' : 'MSB'
      , textcolor = bearCss
      , color = color(na)
      , size = size.small
      , style = label.style_label_up)

    bearms.unshift(breaker.new(line.new(n, pl, n, pl, color = bearBreakCss, style = line.style_dotted)))
    plcross := true

    if bearms.size() > 100
        bearms.pop()

    os := -1

//Iterate trough existing bearish structures and test for breaks
break_up = false

if bearms.size() > 0
    for i = bearms.size()-1 to 0
        get = bearms.get(i)
        get.level.set_x2(n)

        if close > get.level.get_y2() and open < get.level.get_y2()
            get.breaks += 1

            if get.breaks == breaks
                bearms.remove(i)
                break_up := true
        else if (n - get.level.get_x1()) >= maxDuration
            bearms.remove(i).level.delete()

//Resistance events
resistance = false
if bearms.size() > 0
    lvl = bearms.get(0).level.get_y2()

    resistance := high > lvl and math.max(close, open) < lvl

//-----------------------------------------------------------------------------}
//Plots
//-----------------------------------------------------------------------------{
plotchar(break_up, 'Bull MSB Breakout', '▲', location.belowbar, #089981)
plotchar(break_down, 'Bear MSB Breakout', '▼', location.abovebar, #f23645)

//Support events
plotcandle(high, high, low, low
  , 'Support Events'
  , na
  , na
  , bordercolor = support ? #089981 : na
  , display = display.all - display.status_line)

//Resistance events
plotcandle(high, high, low, low
  , 'Resistance Events'
  , na
  , na
  , bordercolor = resistance ? #f23645 : na
  , display = display.all - display.status_line)

//-----------------------------------------------------------------------------}