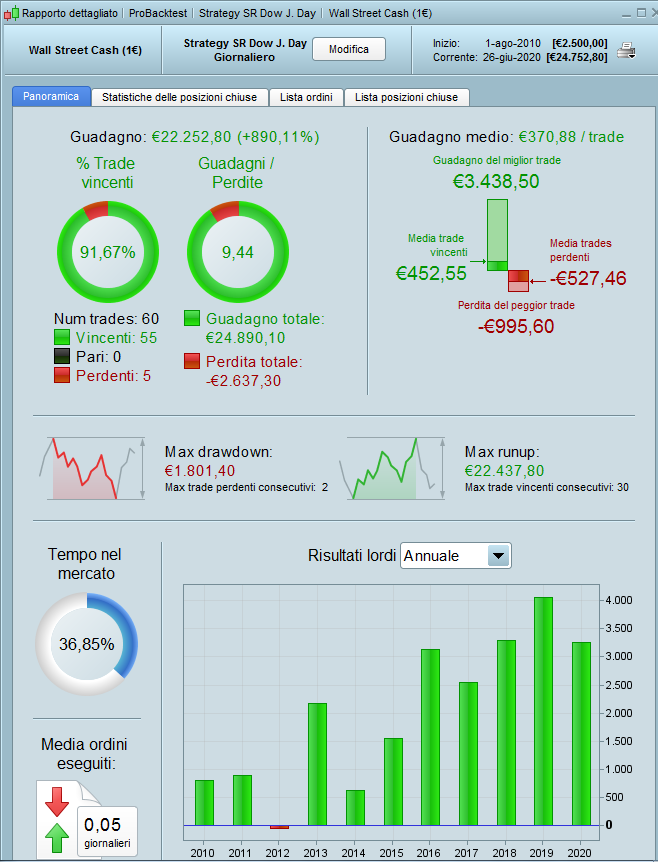
Daily strategy with indicator created by Roberto Gozzi.
This strategy has been optimized with tick by tick mode until December 2017.
To the indicator created by Roberto I added two trend indicators being based only on long purchases, to this I put a monthly stop to not increase the Drawdown in case of sudden and prolonged sales …. (as it is in 2020).
// Strategy SR Dow J. Day     indicator by roberto gozzi

DEFPARAM CumulateOrders = false
indicator1 =  ADX[10]
indicator2 = ADXR[14]
c2 = (indicator1[1] > indicator2[1])
indicator11 = ADX[10]
c1 = (indicator11[1] >= 15)
ONCE PrezzoC = 0
ONCE PrezzoB = 0
ONCE PrezzoA = 0
Prezzo = CALL SRtest
IF Prezzo > 0 THEN
PrezzoA = PrezzoB
PrezzoB = PrezzoC
PrezzoC = Prezzo
ENDIF
If longonmarket and (barindex-tradeindex)>=43 then
SELL AT MARKET
ENDIF
LossMonth  =200
once StopMonth=1
IF Month <> Month[1] THEN
ProfitMonth=strategyprofit
StopMonth=1
endif
If strategyprofit<=ProfitMonth-LossMonth then
StopMonth=0
endif
Cond    = PrezzoB > PrezzoA AND PrezzoB > PrezzoC
IF  StopMonth=1 and close CROSSES UNDER PrezzoB AND C2 AND C1 AND Cond > 0 THEN
BUY 1 Contract At Market
SET TARGET PROFIT 5* averagetruerange[1](close)
SET STOP   %LOSS   8
ENDIF
Trailinglong     = 2* averagetruerange[5](close)
Trailingsteplong = 5* averagetruerange[1](close)
TGL = Trailinglong
STPL = Trailingsteplong
if not onmarket then
MAXPRICE = 0
PREZZOUSCITA = 0
ENDIF
if longonmarket then
MAXPRICE = MAX(MAXPRICE,close)
if MAXPRICE-tradeprice(1)>=TGL then
PREZZOUSCITA = MAXPRICE-STPL
ENDIF
ENDIF
if onmarket and PREZZOUSCITA>0 then
EXITSHORT AT PREZZOUSCITA STOP
SELL AT PREZZOUSCITA STOP
ENDIF
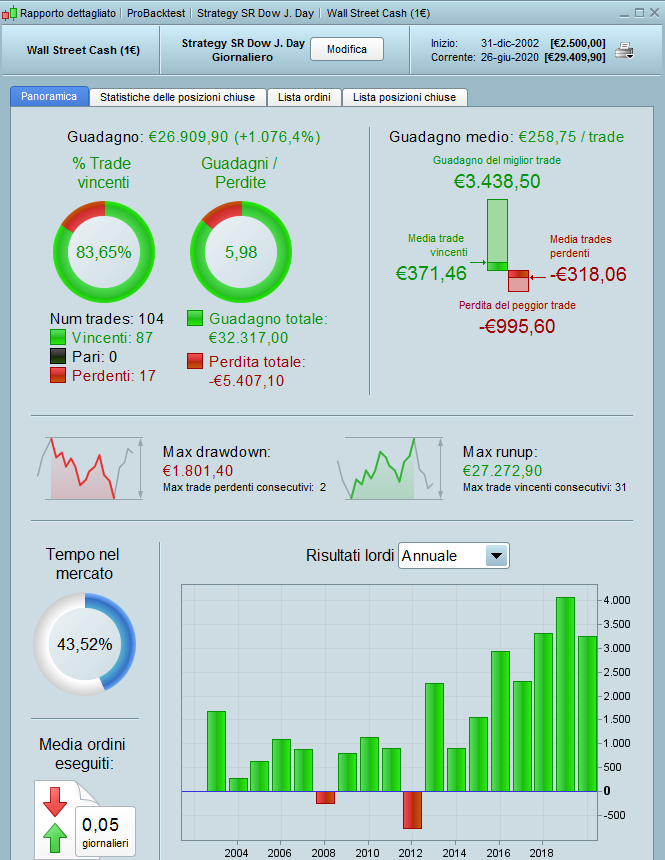
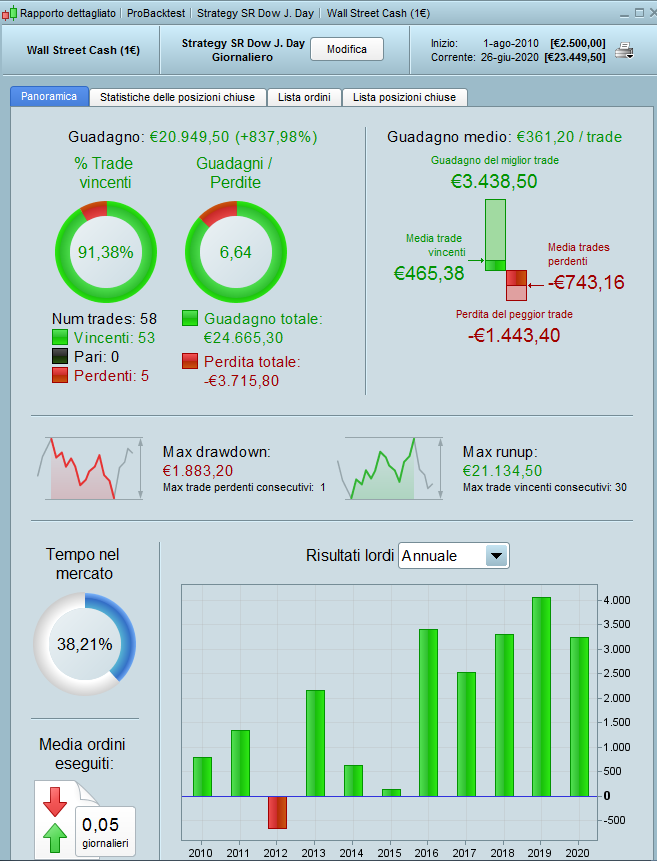
Over 1000% gains are due to low initial capital.
I think € 10,000 would be a correct figure, to cope with drawdown + margin + safety buffer.
Still it performs quite good. Thank you for sharing.
Hi Roberto, 2500 are put only for the drawdown since in the nine years not optimized it has remained unchanged ….
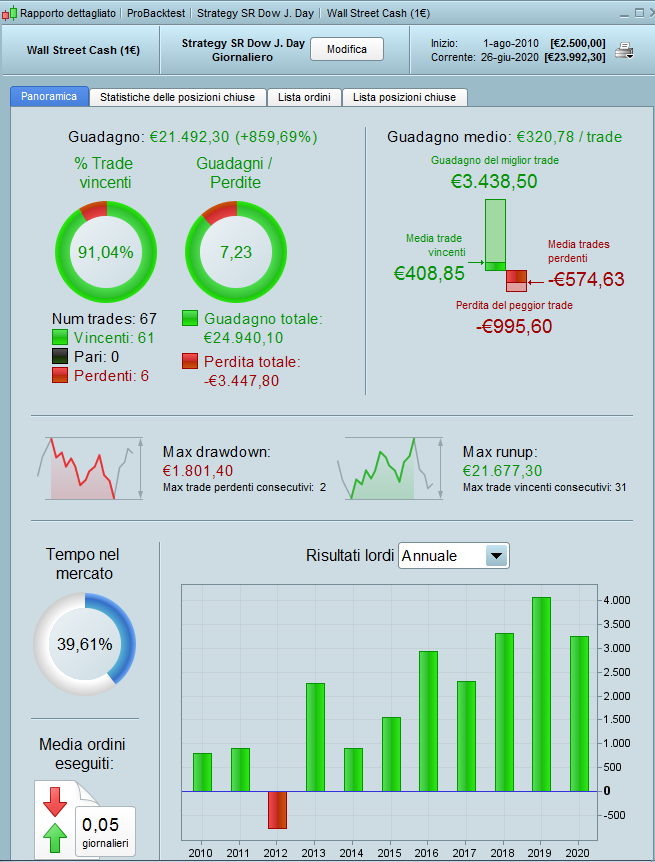
Your strategy uses STOP and TARGET orders so you must test it with tick by tick on. You are not doing this. Tick by tick on the DJI only allows us to test from 2010 onwards.
Also you are using a spread of 2 for the DJI. 3.8 is the norm I believe for end of day trades when positions are opened. Spread might however be lower if STOP or TARGET orders are hit during the trading day.
Even with these changes the equity curve is quite pretty though.
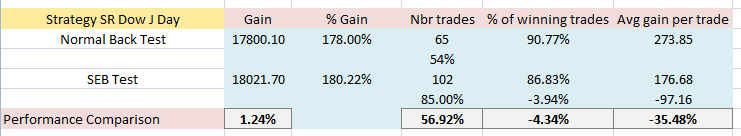
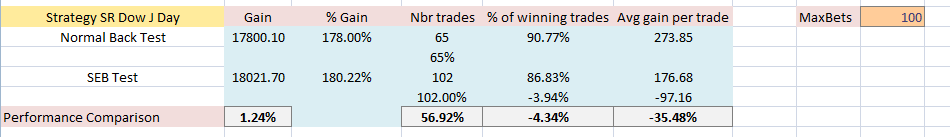
Just for interest I decided to add my ‘Strategy Every Bar’ code to your strategy as it is a prime candidate as trades can be on the market for quite some time and so misses other possible trades. My first test was with just 31 tests (one for each day of the month). This increased the number of trades tested to 102 from 65 out of a maximum of 120 possible trades. So we went from testing only 54% of all trades to testing 85% of all trades. Despite this the total profit only increased by 1.24%. The win rate dropped by 3.94% and the average gain per trade dropped by £97.16
So although profitable performance is not as good as it first appears.
This is the code I used. dn must be optimised from 0 to 31.
// Strategy SR Dow J. Day     indicator by roberto gozzi

DEFPARAM CumulateOrders = false
defparam preloadbars = 0

tradeon = 0
if day = dn or dn = 0 then
tradeon = 1
endif

indicator1 =  ADX[10]
indicator2 = ADXR[14]
c2 = (indicator1[1] > indicator2[1])
indicator11 = ADX[10]
c1 = (indicator11[1] >= 15)
ONCE PrezzoC = 0
ONCE PrezzoB = 0
ONCE PrezzoA = 0
Prezzo = CALL SRtest
IF Prezzo > 0 THEN
PrezzoA = PrezzoB
PrezzoB = PrezzoC
PrezzoC = Prezzo
ENDIF
If longonmarket and (barindex-tradeindex)>=43 then
SELL AT MARKET
ENDIF
LossMonth  =200
once StopMonth=1
IF Month <> Month[1] THEN
ProfitMonth=strategyprofit
StopMonth=1
endif
If strategyprofit<=ProfitMonth-LossMonth then
StopMonth=0
endif
Cond    = PrezzoB > PrezzoA AND PrezzoB > PrezzoC
IF tradeon and StopMonth=1 and close CROSSES UNDER PrezzoB AND C2 AND C1 AND Cond > 0 THEN
trades = trades + 1
if not onmarket then
BUY 1 Contract At Market
SET TARGET PROFIT 5* averagetruerange[1](close)
SET STOP   %LOSS   8
endif
ENDIF
Trailinglong     = 2* averagetruerange[5](close)
Trailingsteplong = 5* averagetruerange[1](close)
TGL = Trailinglong
STPL = Trailingsteplong
if not onmarket then
MAXPRICE = 0
PREZZOUSCITA = 0
ENDIF
if longonmarket then
MAXPRICE = MAX(MAXPRICE,close)
if MAXPRICE-tradeprice(1)>=TGL then
PREZZOUSCITA = MAXPRICE-STPL
ENDIF
ENDIF
if onmarket and PREZZOUSCITA>0 then
EXITSHORT AT PREZZOUSCITA STOP
SELL AT PREZZOUSCITA STOP
ENDIF

graph trades
Hi Vonasi, thanks for your work …. above it has been tested tick by tick since 2010 …. then done without since 2003 because I saw that it did not change … the stop is 8% on the same bar cannot be taken …. Thanks again good day …
I just realised that I forgot to add DEFPARAM PRELOADBARS = 0 to the above code so the possible trade count is wrong. There were actually only 100 possible trades. I’m not sure how separating it into 31 strategies then created 102 trades! Anyway we tested all possible trades and the return from the strategy was barely better so it seems your back test just got lucky and hit all the good trades and missed all the bad trades.
I have edited the code in my post to add the correction.
the stop is 8% on the same bar cannot be taken ….
The stop is 8% from the trades opening price and not just in the same bar.
Also your trailing stop also uses a pending STOP order so you need to only test with tick by tick on.
Yes you are right …. the one has been tick by tick since 2010 …
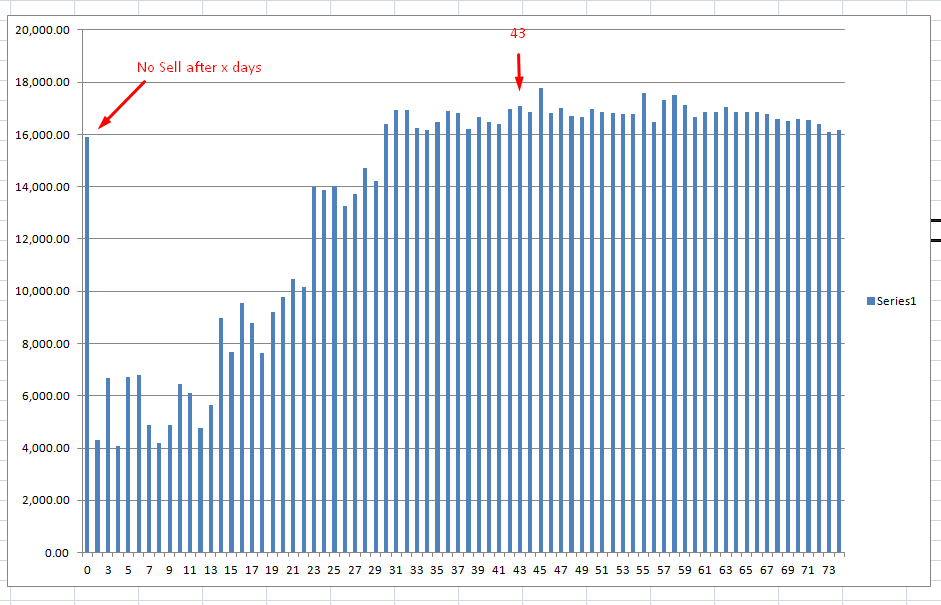
I’m also not a massive fan of the bit where it closes any trade after 43 days as it has a strong chance of curve fitting. I checked it with other values than 43 and got the attached chart. It seems closing any trades over 31 days returns a similar result. So I did a SEB test with that condition to close after 43 days removed. The results were much worse so it seems that giving up on trades that have been open for a long time is worthwhile in this strategy but it worries me that this exit condition makes such a difference especially as so few trades are actually closed by it.
43 days has been put without being tested …. it’s two months of trading, often I use a time stop.
Being a strategy only LONG …. daily I wanted to give time to continue in the current trend …. but it can also be removed, I think it changes little.
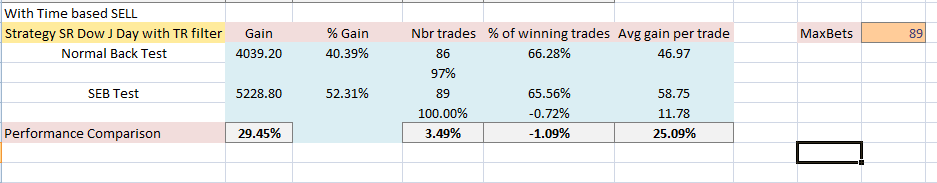
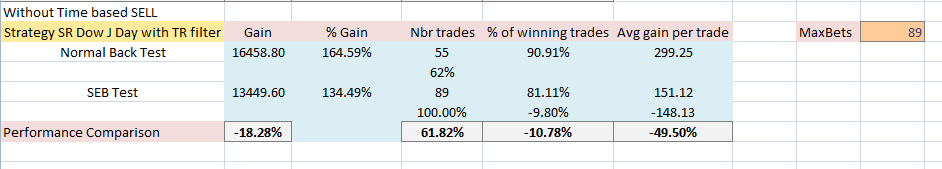
I added a “TR” filter …. First Chart without Time Stop (43 Days) the second with Time Stop inserted.
Always Tick By Tick Optimized to 2017.
// Strategy SR Dow J. Day     indicator by roberto gozzi

DEFPARAM CumulateOrders = false
indicator1 =  ADX[10]
indicator2 = ADXR[14]
c2 = (indicator1[1] > indicator2[1])
indicator11 = ADX[10]
c1 = (indicator11[1] >= 15)
c30 =TR(close)>25
ONCE PrezzoC = 0
ONCE PrezzoB = 0
ONCE PrezzoA = 0
Prezzo = CALL SRtest
IF Prezzo > 0 THEN
PrezzoA = PrezzoB
PrezzoB = PrezzoC
PrezzoC = Prezzo
ENDIF
If longonmarket and (barindex-tradeindex)>=43 then
SELL AT MARKET
ENDIF
LossMonth  =200
once StopMonth=1
IF Month <> Month[1] THEN
ProfitMonth=strategyprofit
StopMonth=1
endif
If strategyprofit<=ProfitMonth-LossMonth then
StopMonth=0
endif
Cond    = PrezzoB > PrezzoA AND PrezzoB > PrezzoC
IF  StopMonth=1 and close CROSSES UNDER PrezzoB AND C2 AND C1 AND C30 AND Cond > 0 THEN
BUY 1 Contract At Market
SET TARGET PROFIT 5* averagetruerange[1](close)
SET STOP   %LOSS   8
ENDIF
Trailinglong     = 2* averagetruerange[5](close)
Trailingsteplong = 5* averagetruerange[1](close)
TGL = Trailinglong
STPL = Trailingsteplong
if not onmarket then
MAXPRICE = 0
PREZZOUSCITA = 0
ENDIF
if longonmarket then
MAXPRICE = MAX(MAXPRICE,close)
if MAXPRICE-tradeprice(1)>=TGL then
PREZZOUSCITA = MAXPRICE-STPL
ENDIF
ENDIF
if onmarket and PREZZOUSCITA>0 then
EXITSHORT AT PREZZOUSCITA STOP
SELL AT PREZZOUSCITA STOP
ENDIF
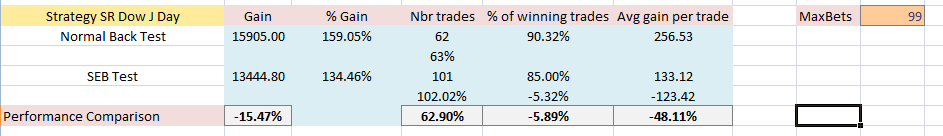
I ran SEB tests on the code with the new TR filter.
Without the time based selling the code performs terribly in the SEB test. With time based selling there is not much to see because the normal backtest sees almost all the possible trades due to the low number of trades.
What this tells us is that the strategy is very dependent on buying and holding and selling after a certain amount of time in what has been a very up trending market during the test period. Buying and holding will always work in this market!
Without the time based selling it just gets lucky in the normal back test and hits all the good trades and misses all the bad trades because it is already on the market.