Hi there,
I am trying to set a simple strategy based on this indicator
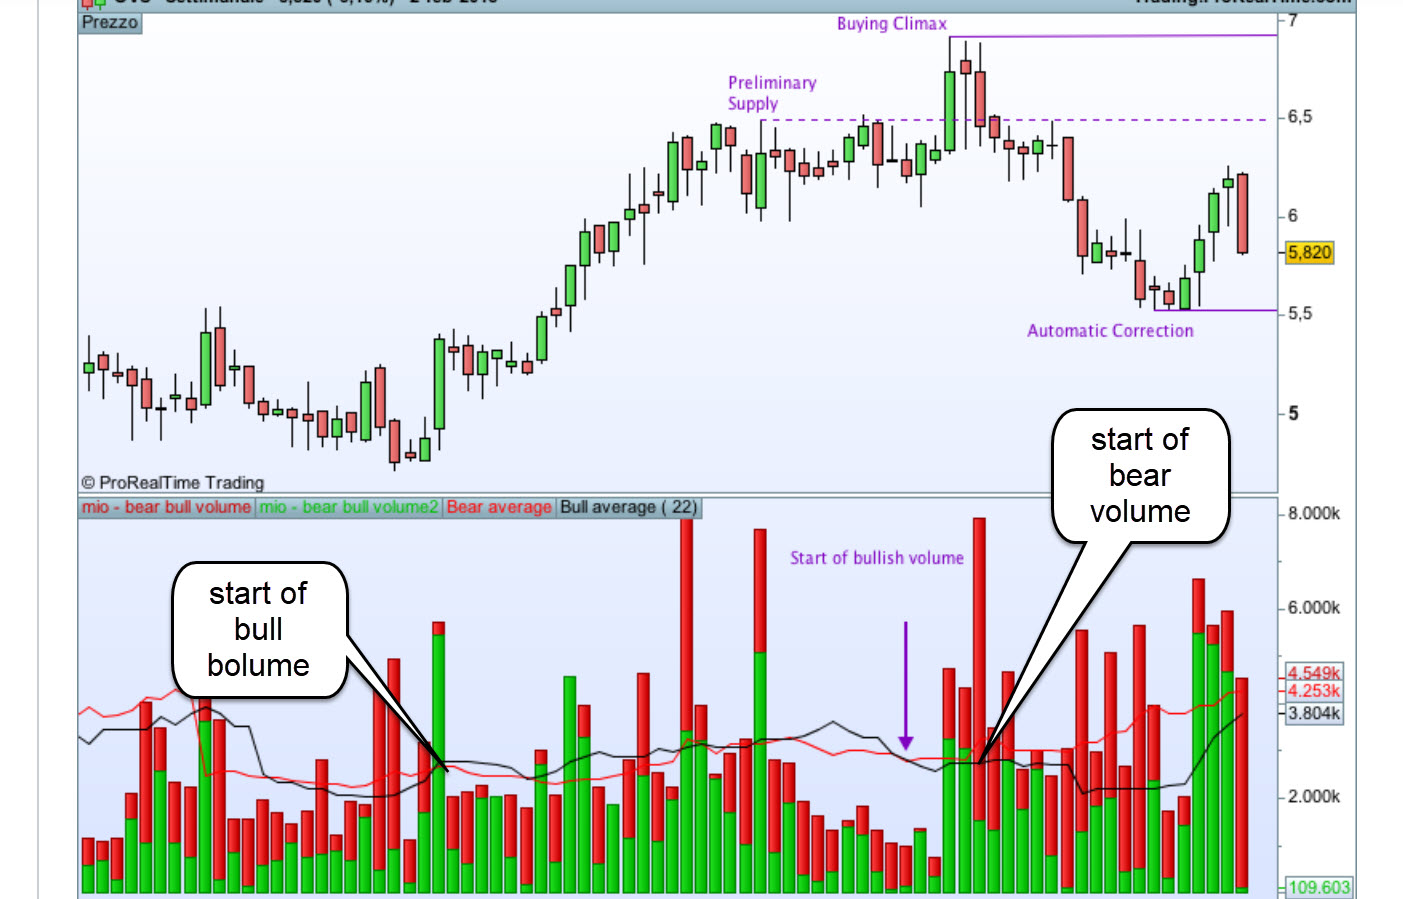
Bear and Bull volume indicator
Here are the conditions:
BUY :
- if the bull-volume-green-bar CROSSES (i.e is superior) the simple moving average of the past 23 bull-volumes
- if the bull-volume-green-bar CROSSES (i.e is superior) the simple moving average of the past 23 bear-volumes
SELL:
- if the bear-volume-green-bar CROSSES the simple moving average of the past 23 bull-volumes
- if the bear-volume-green-bar CROSSES the simple moving average of the past 23 bear-volumes
I tried to use the automatic coding system but it does not work; I tried also to code it myself using moving average but it is not working either.
Can anyone help me on this?
Thanks
Chris

BUY : if the bull-volume-green-bar CROSSES (i.e is superior) the simple moving average of the past 23 bull-volumes
if the bull-volume-green-bar CROSSES (i.e is superior) the simple moving average of the past 23 bear-volumes
SELL: if the bear-volume-green-bar CROSSES the simple moving average of the past 23 bull-volumes
if the bear-volume-green-bar CROSSES the simple moving average of the past 23 bear-volumes
I don’t understand above (but that’s okay cos it’s not my system! 🙂 ) as you refer ONLY to green bars in both Buy and Sell conditions??
Looking at the Chart I would say as attached??
Just a few thoughts? Maybe wrong??
GraHal
Hi Grahal,
Thanks for your interest;
> BUY is actually an entry when the green bar crosses the 2 averages (bear and bull volumes)
> SELL is an Exit when the red bar crosses the 2 averages (bear and bull volumes)
Would you know how to code this ?
Best
Chris
You need to code a Buy, Sell, SellShort, Exitshort into the code below … in place of the Return at the bottom.
I might have a go tomoz, but off to bed now 🙂
Here’s a start if you are nightbird?? Not tested, but all the hard work has been done by @gabri in his Bear Bull Vol Indicator.
PS volbear looks like it needs to be more than volbear – volume ?
If VolBull Then
Buy at Market
Endif

If VolBear Then
SellShort at market
Endif
ref=(close-low)/range
volbull=ref*volume
volbear=volume

if close>=open then
 greenbarcount=1
 greenvolume=volume
 redbarcount=0
 redvolume=0
else
 greenbarcount=0
 greenvolume=0
 redbarcount=1
 redvolume=volume
endif
//media volumi rossi e verdi per media mobile semplice
mmred=summation[period](redvolume)/summation[period](redbarcount)
mmgreen=summation[period](greenvolume)/summation[period](greenbarcount)

return volbear coloured (205,0,0) style (histogram), volbull coloured (0,190,0) style (histogram), mmred colo
Chris,
here’s the code. I assumed that when you wrote “if the bear-volume-green-bar CROSSES the simple moving” you actually meant “if the bear-volume-RED-bar CROSSES the simple moving”. I just want to add a personal note, from a NON BELIEVER in automatic trading. I am a discretional trader because I think that there is no way to substitute a mediocre brain with a super computer. I made this indicator to help to analyse with the Wyckoff method a certain stock. This indicator is supposed to confirm or not the price action of a stock inside a trading range and define the phase the stock is in. It might work in other situations but it was never tested for this purpose.
Gabriele
DEFPARAM CumulateOrders = False // Posizioni cumulate disattivate

//Basic parameters
period=23
ref=(close-low)/range
volbull=ref*volume
volbear=volume

if close>=open then
greenbarcount=1
greenvolume=volume
redbarcount=0
redvolume=0
else
greenbarcount=0
greenvolume=0
redbarcount=1
redvolume=volume
endif
//media volumi rossi e verdi per media mobile semplice
mmred=summation[period](redvolume)/summation[period](redbarcount)
mmgreen=summation[period](greenvolume)/summation[period](greenbarcount)
//return volbear coloured (205,0,0) style (histogram), volbull coloured (0,190,0) style (histogram), mmred coloured (255,0,0) as "Bear average",mmgreen as "Bull average"
//Entering the market
c1=(volbull crosses over mmgreen) and (volbull>mmred)
c2=(volbull > mmgreen) and (volbull crosses over mmred)

c3=(volbear crosses under mmgreen) and (volbear<mmred)
c4=(volbear < mmgreen) and (volbear crosses over mmred)

//long entry and exit rules
if c1 or c2 then
buy 3000 cash at market
endif
if c3 or c4 then
sell at market
endif
//short entry and exit rules
if c3 or c4 then
sellshort 3000 cash at market
endif
if c1 or c2 then
exitshort at market
endif
To write code, please use the <> “insert PRT code” button.
Thank you.
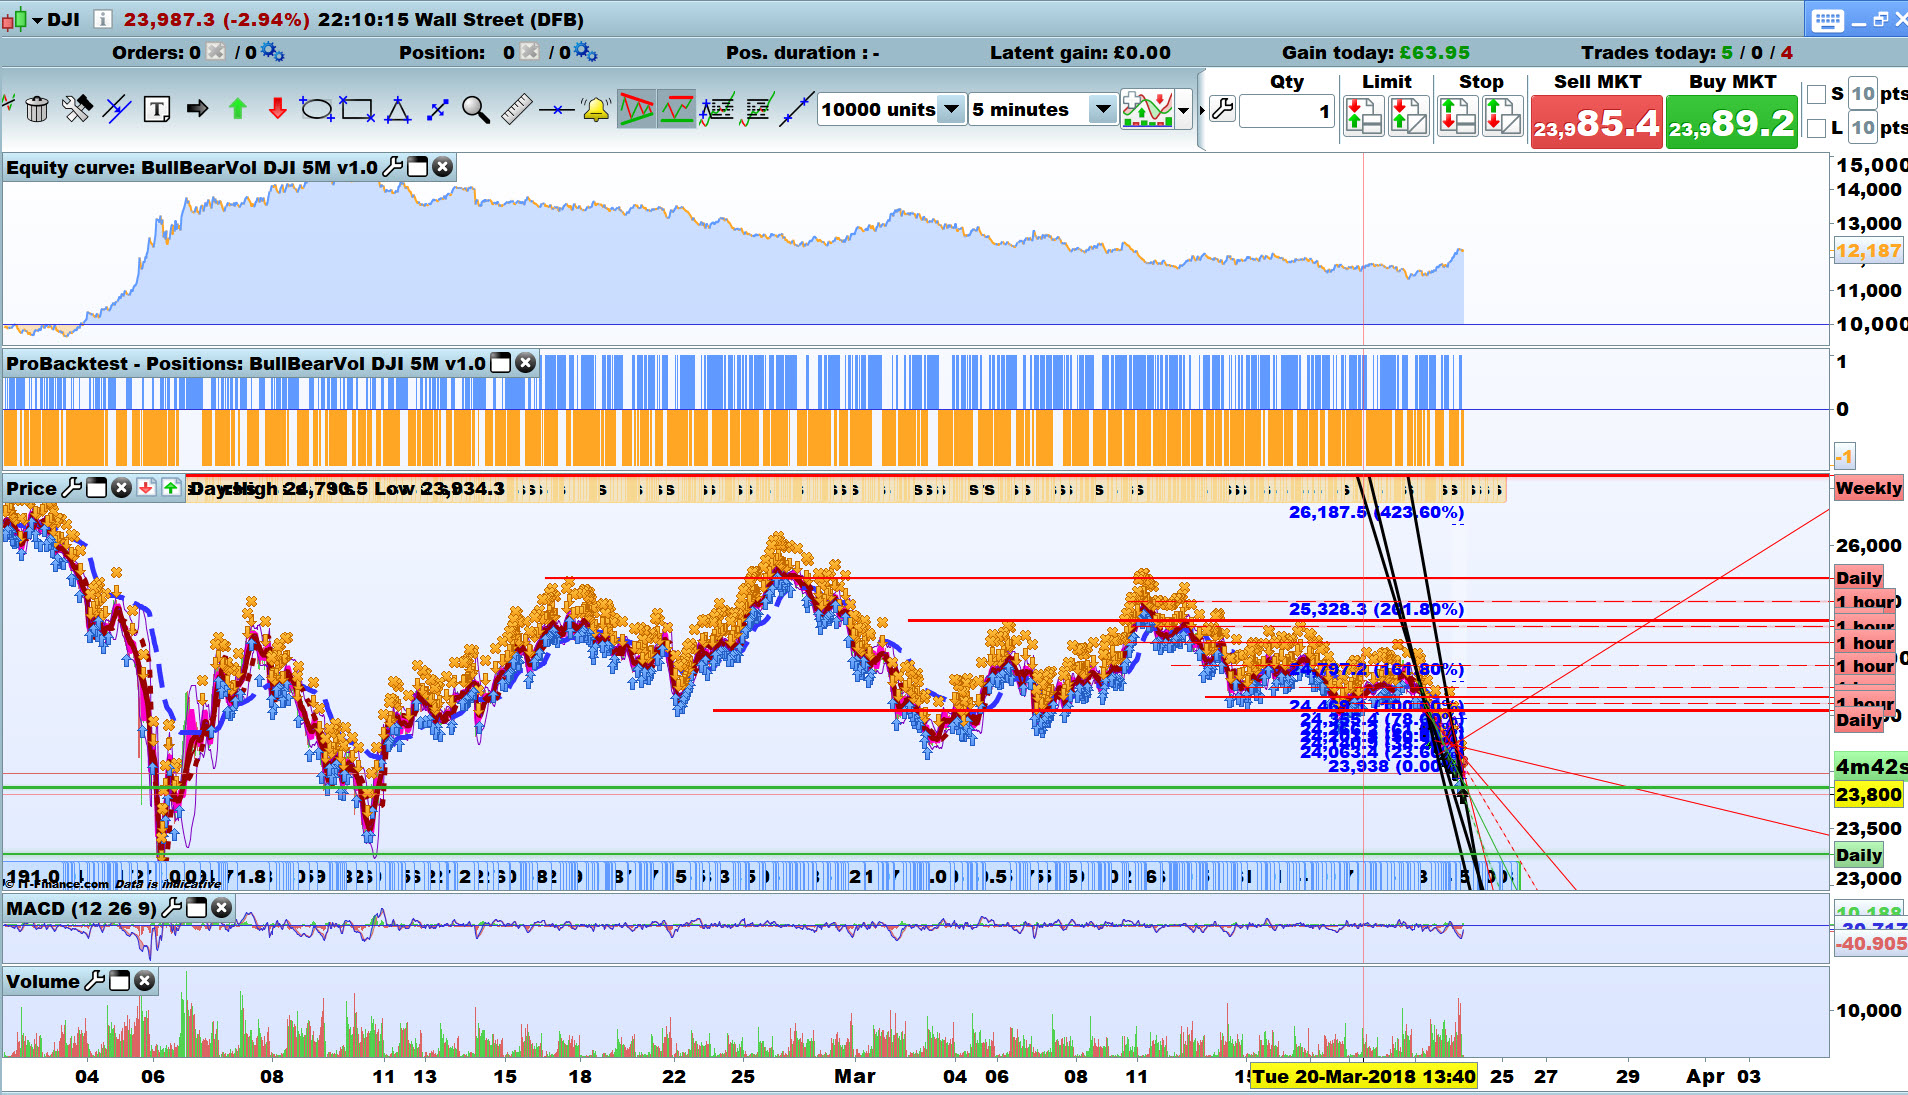
Thought I’d give it a whirl! 🙂 Period 18 and spread = 2
Tried adding various to reduce that long slide in equity curve, but none made enough difference to leave in the code.
GraHal
Hey Gabriele,
Thank you very much for your reply, your time and code expertise (and your self correction of the trigger 🙂
You made my day !
Did you try this strategy directly inspired by your brillant indicator?
Is there a way to emprove it?
Cheers,
Chris
PS : thanks Grahal for your support; I am checking it right away;
Sorry Gabriele,
Just red more closely your warnings about “industrialising” this strategy and your message indirectly answering my questions.
; thanks also for pointing out this Wyckoff that is just what I needed to formalize my intuitions and method;
I would be interested in sharing thoughts in MP; I have just a few questions promise;
here is my mail ct197475 (at) hotmail.fr;
Chris
Yeah Kris75 , it’s an interesting one alright! 🙂
Be good if you can work it so that gain doesn’t slip away over the following weeks?
Cheers
GraHal
I’ve got it running on Demo, the last 2 trades entered at a good logical point and went to a very good profit in a short time, but then the profit turned to loss.
So the entry may be okay (but only 2 trades in last 2 hours) but the Exit may need work (but aren’t exits nearly always a pain to get right?).
I did, sometimes it’s not taken. 🙂
@grahal even in a markup phase of the market a crossing signal might not be the right entry sometimes. You have to exit your long position when you start to see distribution and this means:
- When the target is met;
- When the uptrend line is broken;
- when volumes are showing selling pressure in a range market (and in this case you will see bulls stronger than bears)
Hard to make this automatic….at least for me 😀
I agree gabri and hard for me also! 🙂
I have moved over to a weird way of trading (most would think?) but I try anything and everything … keeps my interest up!
I enter via a coded Strat, which also has coded exits, but I nearly always see that the trade needs to exit before the exit code executes (for similar reasons as you say above). So I exit manually and then pop the Strat back running again! 🙂
It looks (from Demo performance this morning) that your code could be a good candidate for my weird trading method! 🙂 I’ll have to get into your code and Wyckoff fully then give it a shot!
Thank You
GraHal
GraHal, I actually think you have a very smart strategy.