Fea
FeaParticipant
New
Hi
I was hoping someone with better coding knowledge could help to create an indicator that looked for the following two triggers. I tried to a adapt some of the indicators found on this site but my attempts have failed miserably. I have found this to be an extremely reliable indicator for near term direction change regardless of chart time frame ie. 1, 5, 60 min, daily timeframe. Infact confirmation on multiple timeframes is even a stronger indication.
Should be coupled with manual assessment of oversold/overbought nature and infliction of longer duration Stochastic 40,4,4 and 60,10.6 i.e lower probability when longer time frames are embedded in overbought or oversold territory.
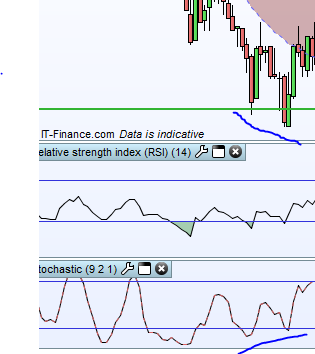
Buy divergence
- Price formed a Lower Low (confirmed by a higher close price on the following bar) and the corresponding 14,3,3 Stochastic %K has formed a Higher Low
Sell divergence
- Price formed a Higher High (confirmed by a lower close price on the following bar) and the corresponding 14,3,3 Stochastic %K has formed a Lower High
FeaParticipant
New
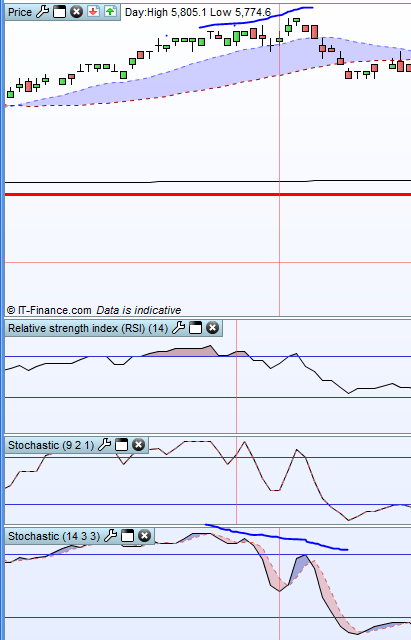
For an additional example in the attached the indicator would not trigger until the later Higher High in price even though there are lower minor highs that happen between the two obvious peaks.
Ideally the code would look for the peaks to occur with in a modifiable number of periods .
Thanks
Kevin
FeaParticipant
New
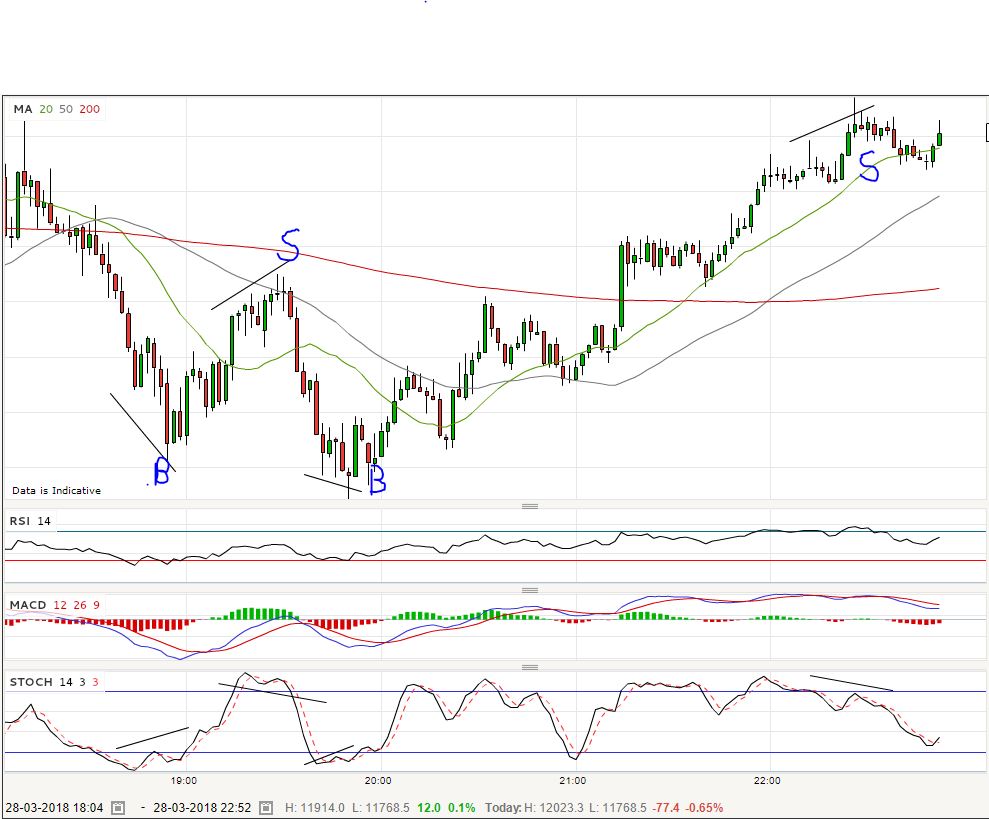
Trading with short term divergence coupled with a secondary confirmation like a MACD cross can be very powerful and high probability. The attached is an example of 4 short term trades on the DAX.
The chart is 28/3/2018 from 6-11pm Australian time to 2min timeframe present 4 trade opportunities results were.
18:56 buy 25points
19:32 Sell 40 points
19:52 Buy 20 points
22:28 buy Stopped 0 points
FeaParticipant
New
Hi Robert
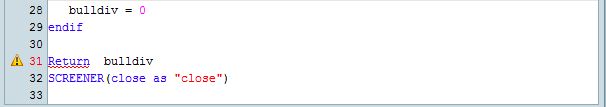
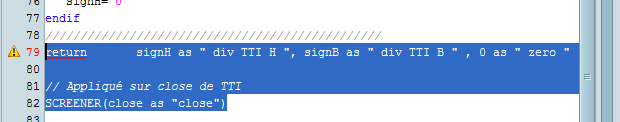
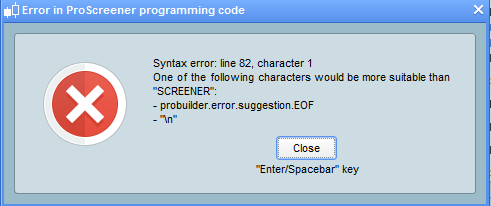
I have tried to get the programing in the last two links to work but I get a similar error for both as per the attachments. Can you advise or better still are you able to share these as *.ITF files.
Thanks
Kevin
Indicators/Oscillators should only use RETURN as the last line, not SCREENER which is a keyword reserved to ProScreener only, so you should remove (or simply comment out) that line.
FeaParticipant
New
Hi Robert
I have been able to get two to work but they don’t seem to identify the situations I am looking for. I can not get the “https://www.prorealcode.com/topic/divergences-tti-stoch-extreme/” to work. In it presented state it errors, but in noticed there seems to be a lot of lines that are commented out. I have tired to play around with reinserting them but it only produces further errors. Can you please advise?
Thanks
Kevin
Commented lines were added by the author for debugging purposes, you should either ignore or remove them.
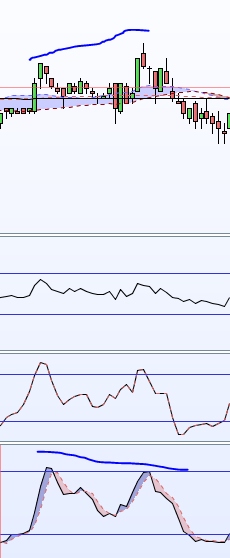
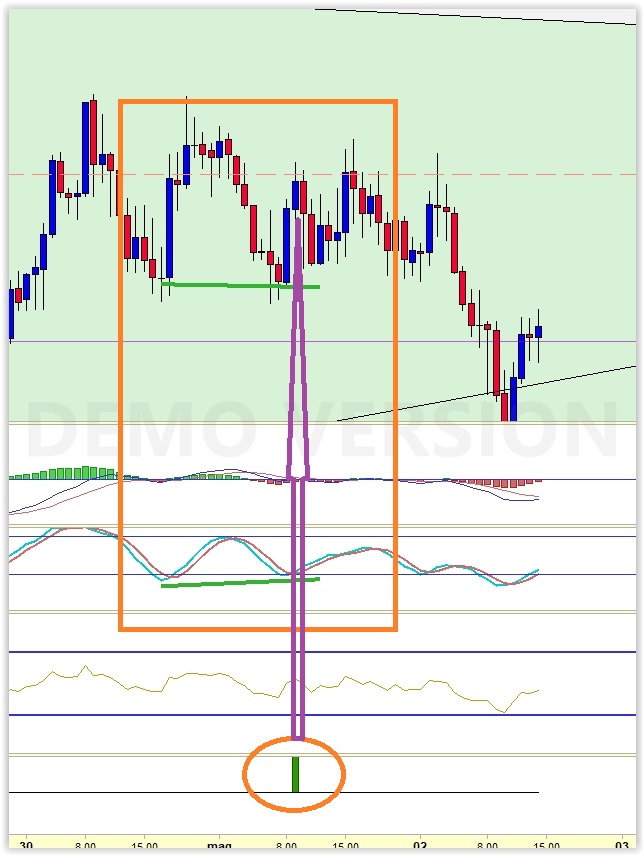
I am using it and it works (see my screenshot). Of course it most often detects divergences which are slightly divergent! But this is an issue code cannot solve, while your eyes can!
Automated strategies are a quite different from manual trading; if a price HIGHEST is 12600 and the CLOSING price reached 12599 then pulled back, you can see it as double top while a stgrategy would not!
FeaParticipant
New
Thanks Robert
I tried it again against a different index chart and now it works. It looks like this would form a really good basis for what I am trying to achieve. Please understand I am not good at programing, generally I use the standard offering that can be selected. So I am sorry if these questions are basic but as I cant “read” and understand all the programing I am not clear on what is actually being compared.
The program compares the price higher high or lower low to the divergence of a Stochastic line. What is the setting of the line for example: is it K on a Stochastic of 11,3,3 or something else?
Which line in the program set the Stoch to be used…line number?
The code asks for a variable to be defined “ma”, what is this variable and what do you set it to?
Thanks
Kevin
- It is comparing twweeeerrf
This is the one I use (you can import attached .ITF file from within ProBuilder), I can’t fine where I found it, but for sure it is somewhere in this forum
// DIVERGENCES STO adapted from HK-LISSE code

// p = 14                  //Stochastic periods
// k = 3                   //K line value
// d = 6                   //D line value (used by Average)

x = stochastic[p,k]        //X is this is the K line
y = average[d](x)          //Y is the D line (an SMA of K line)


if x>overboughtzone then
   hi=max(hi,x)
   hico=max(hico,max(high,high[1]))
endif
if x crosses under y then
   sto2b=sto1b
   sto1b=hi
   hi=0
   p3b=p1b
   p2b=max(p1b,hico1)
   p1b=max(highest[3](high),hico)
   if p2b=p1b then
      p2b=max(p3b,p4b)
   endif
   hico=0
   hico1=0
endif
if x<y then
   p4b=hico1
   hico1=max(hico1,high)
endif
if p1b>p2b and sto1b<sto2b and x crosses under y and x<x[1] then
   signB= -2
else
   signB= 0
endif

if x<oversoldzone then
   lo=min(lo,x)
   lowco=min(lowco,min(low,low[1]))
endif
if x CROSSES OVER y  then
   sto2h=sto1h
   sto1h=lo
   lo=100
   p3h=p1h
   p2h=min(p1h,lowco1)
   p1h=min(lowest[3](low),lowco)
   if p2h=p1h then
      p2h=min(p3h,p4h)
   endif
   lowco=100000
   lowco1=100000
endif
if x>y then
   p4h=lowco1
   lowco1=min(lowco1,low)
endif
if p1h<p2h and sto1h > sto2h and x crosses over y and x>x[1]  then
   signH= 2
else
   signH= 0
endif
////////////////////////////////////////////////
return  signH as " div STO bull ", signB as " div STO bear " , 0 as " zero "
As for STOCHASTIC, in your code you define it as:
Kline = Stochastic[14,3](close) //14,3
Dline = Average[3](Kline)       //3
then you can reference a BULLISH crossing over the OS zone:
IF Kline CROSSES OVER 20 AND Kline > Dline THEN....
FeaParticipant
New
Hi Robert
Each of the examples you have provided I believe contains parts of what I am looking to achieve, but I am not experienced enough to strip the required parts out it and compile.
I only use Price and Stochastic K (regardless of overbought or oversold levels)
I wish to compare:
-When price makes a Higher close (HC) than a previous High and compare that to the corresponding two values of Stochastic K , if HC2 >HC1 and Sto2 < Sto1 than they re divergent (price is going higher but Sto is going lower) so “return an indication”
-When price makes a Lower close (LC) than a previous Low and compare that to the corresponding two values of Stochastic K , if LC2 < LC1 and Sto2 > Sto1 than they re divergent (price is going lower but Sto is going Higher) so Return an indication”
Often the situation looks very much like the image you attached, but sometime the divergences happens within two consecutive bars. From there it takes the human to analyse
Are you able to program this or should I use the custom coding request form to get a quote? I am grateful for your free help that you have given so far but I realise this is taking up your time.
Thanks
Kevin
I’ll have a try. I’ll let you know when I have a (hopefully) working code ready.
Sorry
Fea, I tried to code something the way you need, but did not succeed easily. I think it could take too much time for me.
I suggest that you use the custom code form.
hi Roberto, I see that on this indicator we can put an alarm! I’m afraid I do not really understand … can we say to him, for example on bearish divergence, as soon as a higher vertex diverges with a lower vertex in formation thus in real, (not yet closed!) so I get an alert? I am looking for this kind of indicator that scan the differences in training … if yes pourrioez you communicate me the procedure to follow, because I could see alert settings in the indicator but I do not understand their interpretations well ..a big thank-you Excellent day